VeChain, Flow, Waves Price Analysis: 03 May

With Bitcoin sailing near its high liquidity range, the wider market refrained from making a volatile move in the last few days. Thus, the sentiment still lurked around the ‘fear’ zone.
With little to no surprise, the near-term technicals of VeChain, Flow, and Waves skewed in favor of the sellers. The buyers still needed to inject volumes to alter the existent bearish narrative.
VeChain (VET)
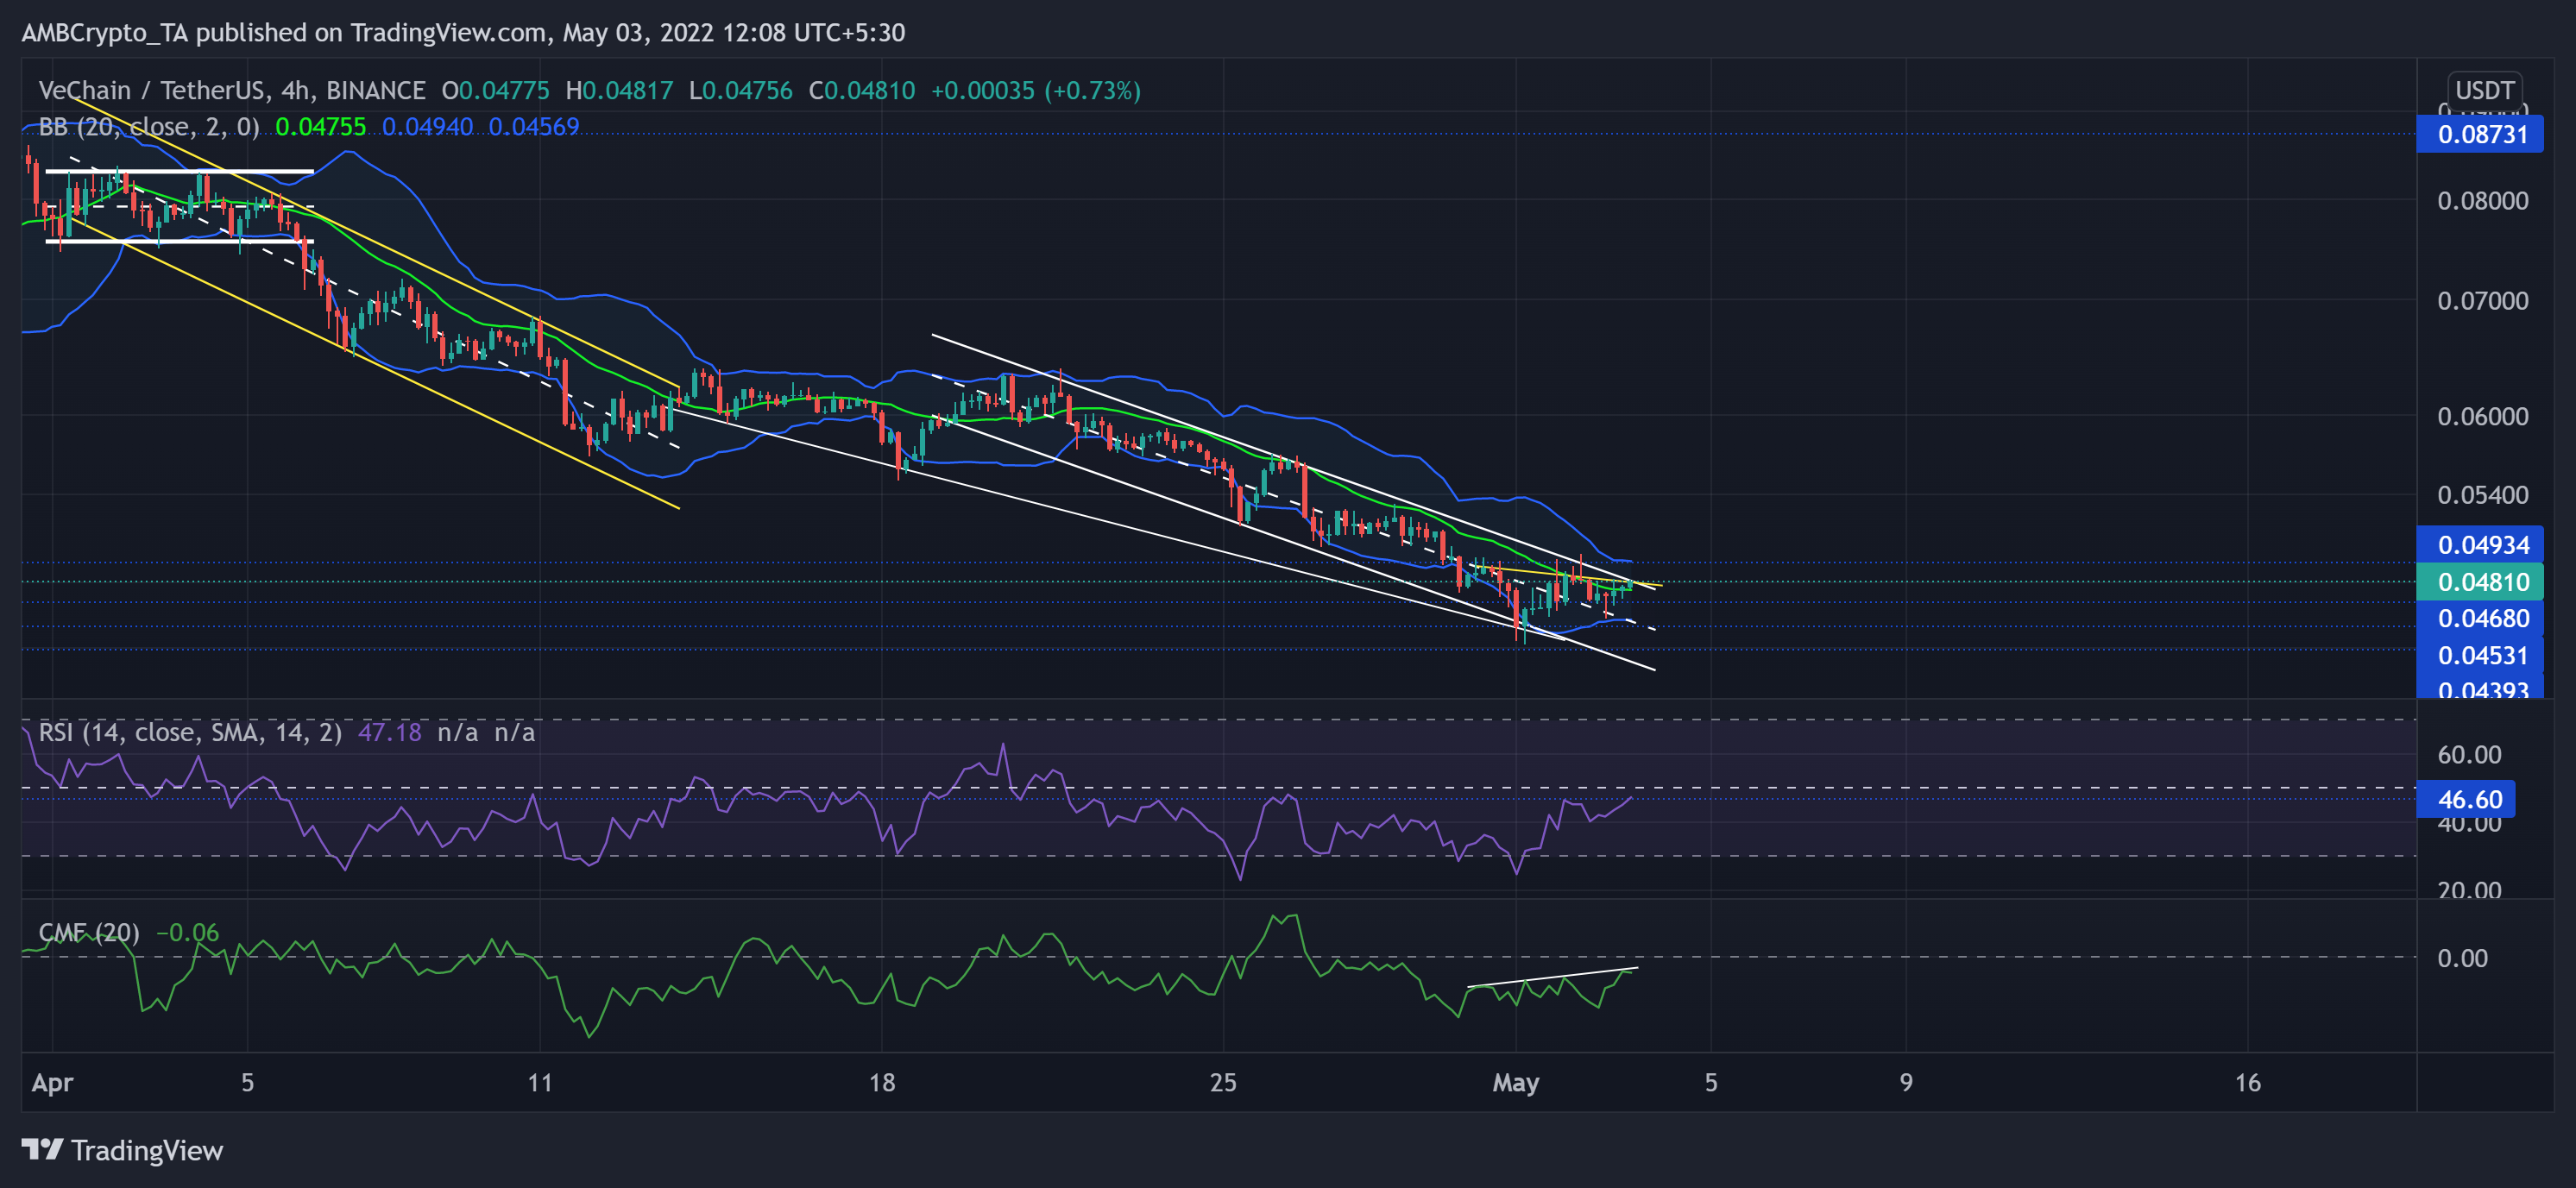
After rebounding from the $0.08 ceiling on 31 March, the sellers drifted a rally toward the $0.04-support and matched VET’s mid-March lows. The altcoin shed over half of its value and plunged toward its seven-week low on 1 May.
This devaluation kept VET below the basis line (green) of the Bollinger Bands (BB) for the most part in the last month. The two-day gains from the multi-week low aided the alt to peck above the basis line. But the BB has narrowed its volatility over the last day. A break above the current down-channel (white) is needed to topple the $0.049 boundary in the coming times.
At press time, VET was trading at $0.0481. While rising from the ruins of its oversold region, the RSI observed a solid comeback but plateaued at the 46-mark. Also, the CMF cast a hidden bearish divergence with price over the last few days.
FLOW
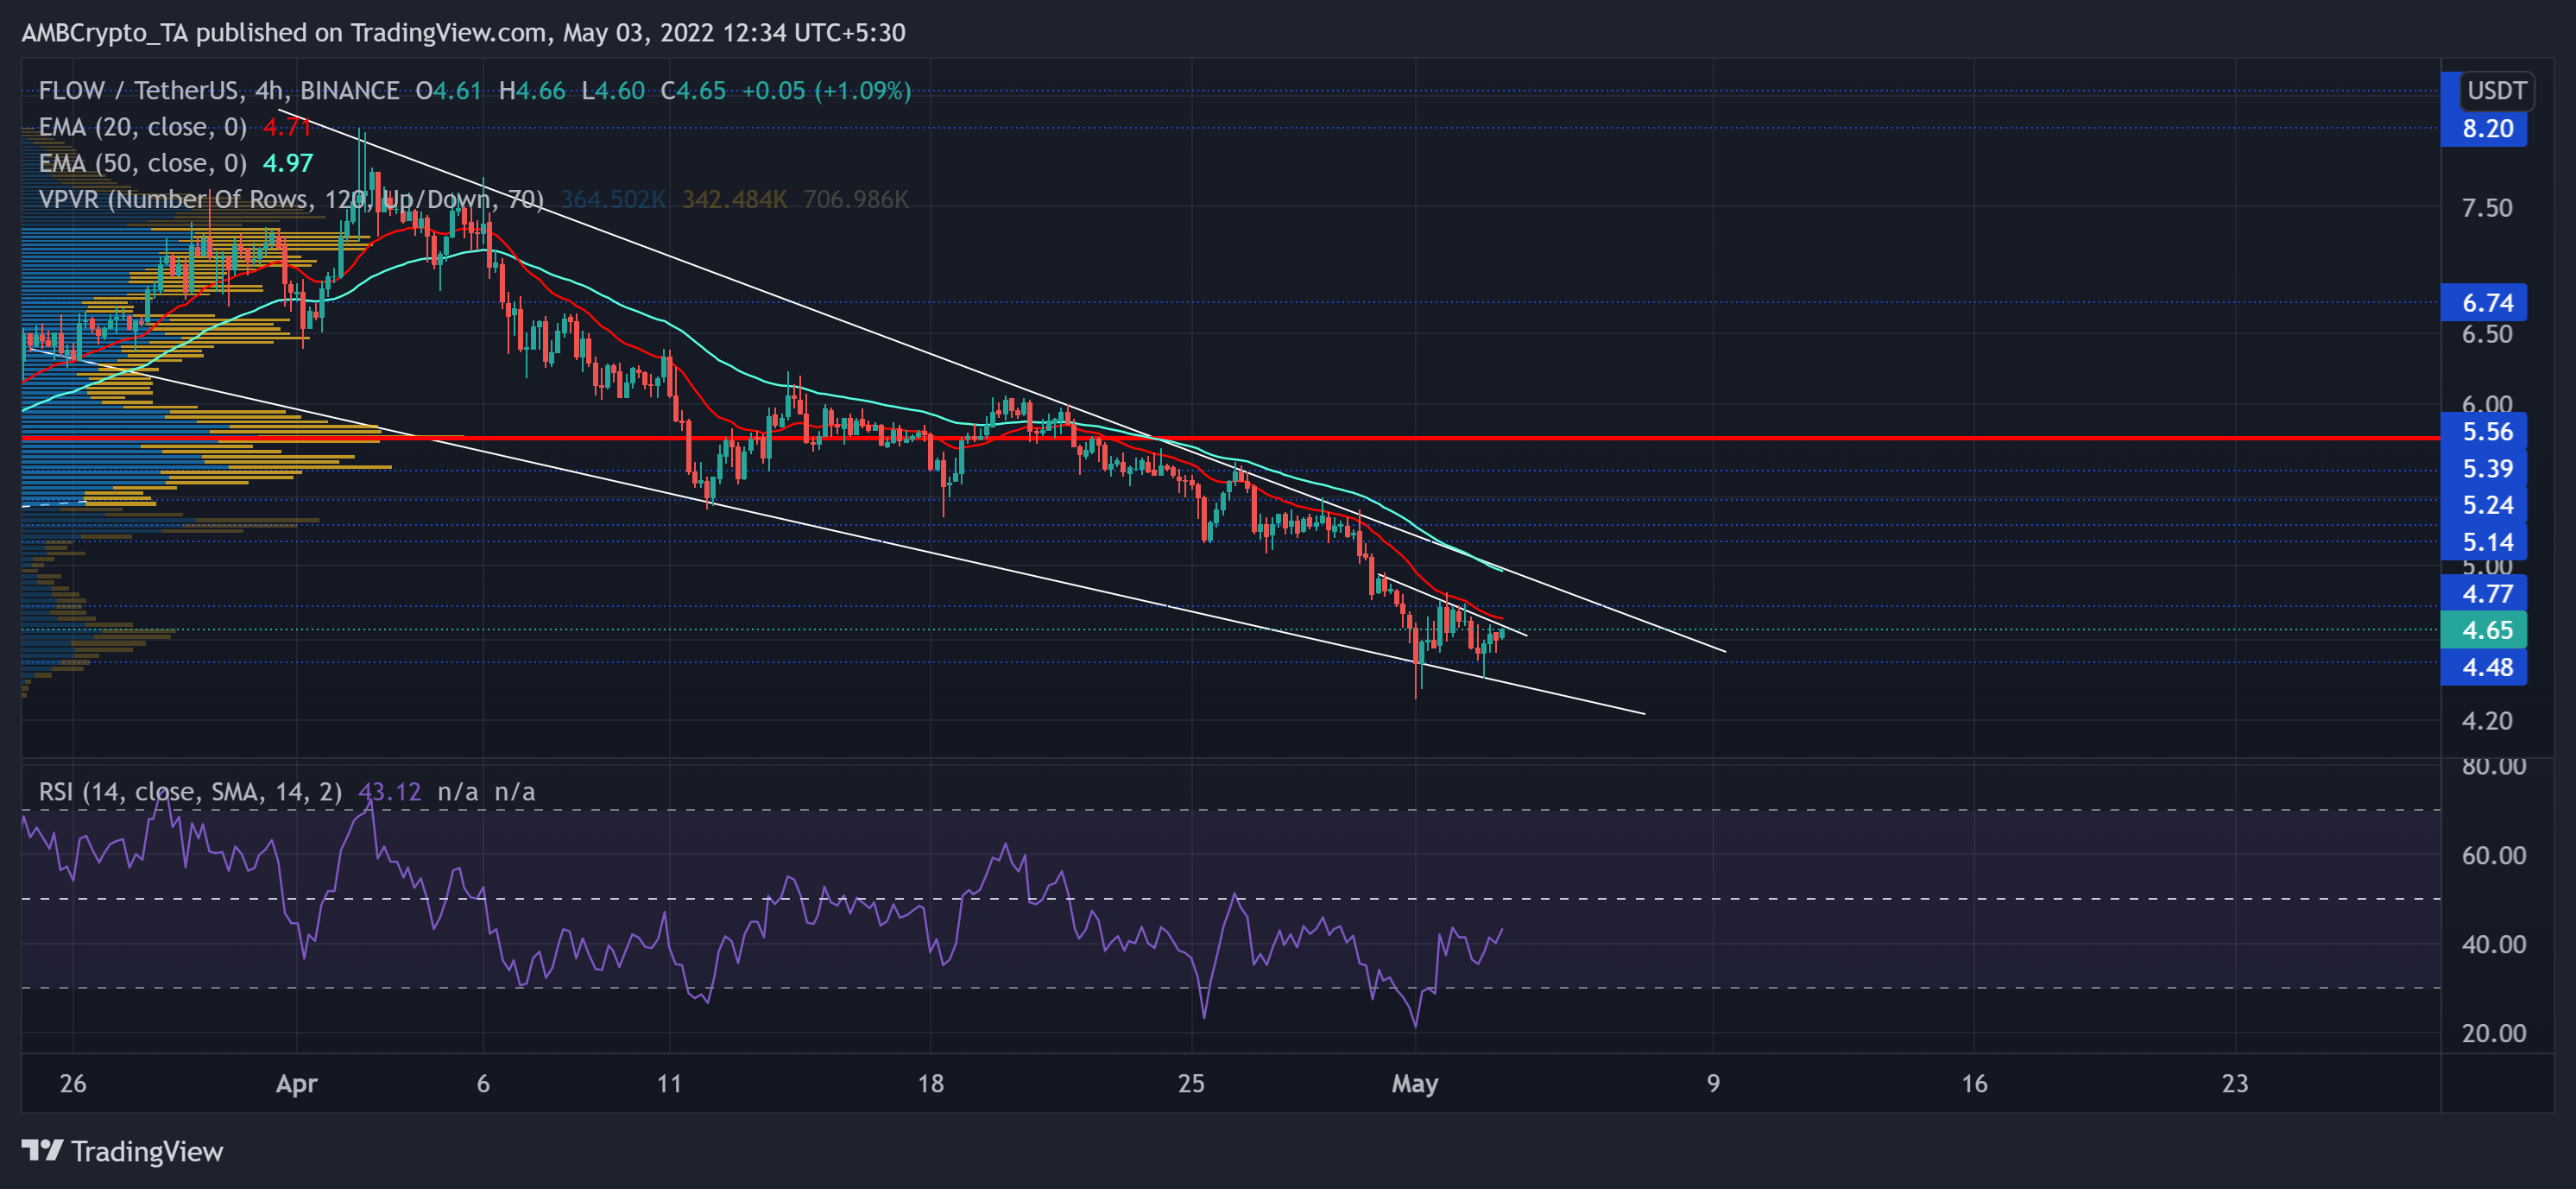
FLOW had been on a constant quest to find fresher grounds until finally stabilizing at the $4.48 floor in the last three months. The bulls have been on a back seat while the sellers rode along with the recent falling wedge plummet.
This phase pushed the alt below its 20/50 EMA while gliding under its high liquidity range near the Point of Control (red). From this point, the short-term EMA lines could continue to pose testing barriers in FLOW’s revival.
At press time, FLOW traded at $4.65. The RSI saw exponential growth from the oversold region. A potential close above the equilibrium could open doorways for a trend-modifying rally.
WAVES
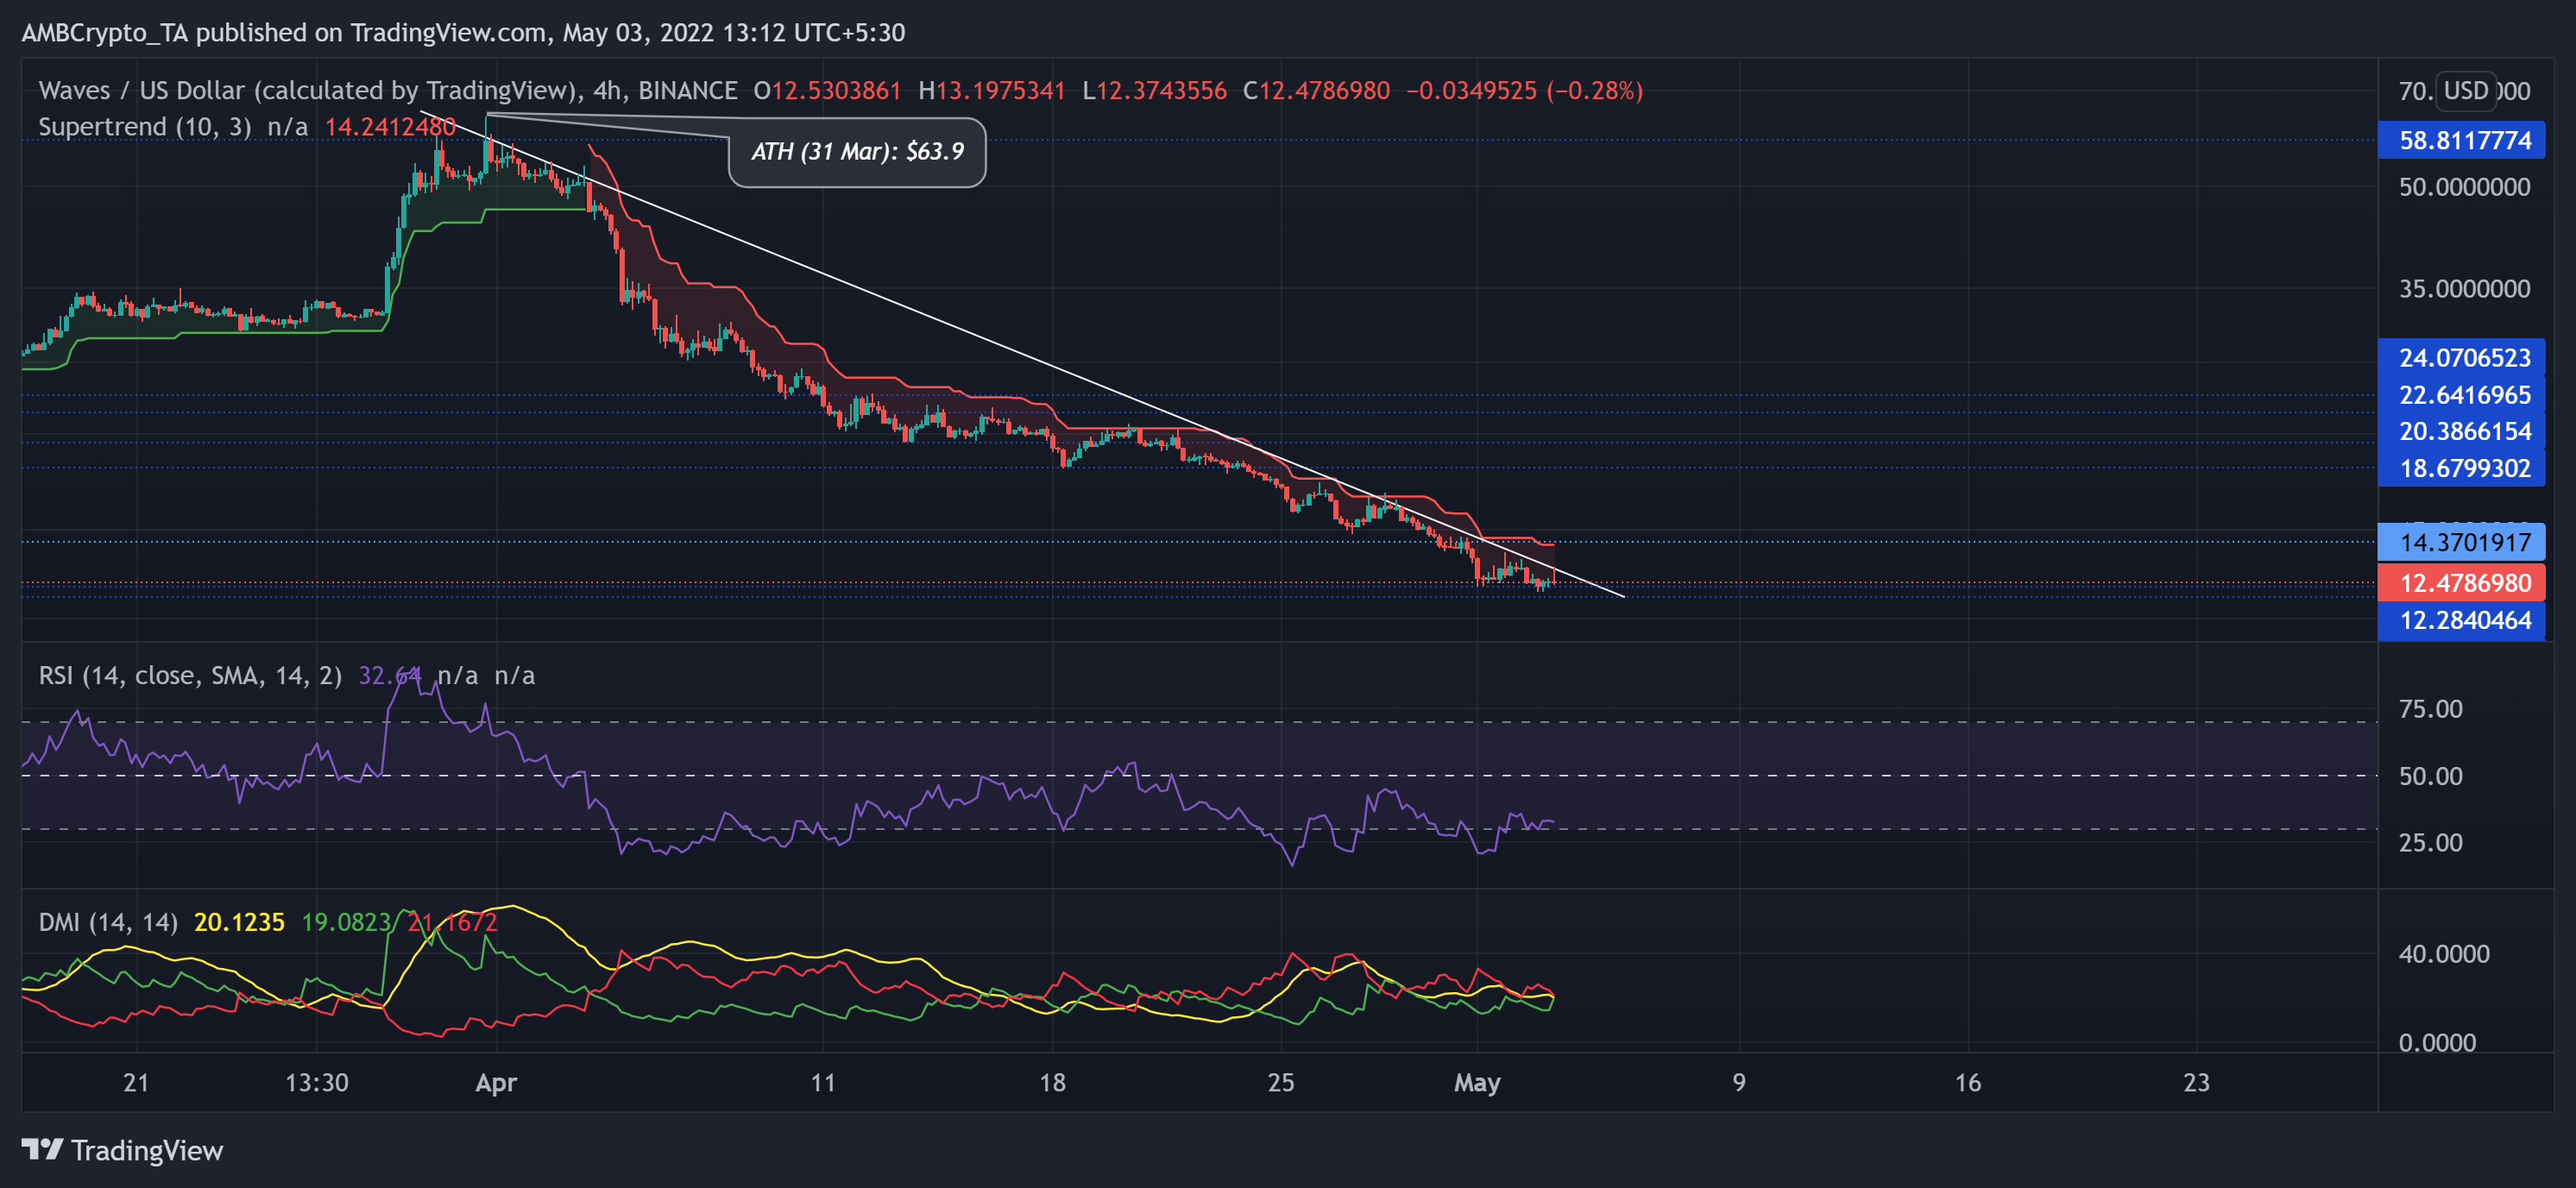
WAVES steeply fell since the beginning of April while it pierced through vital price points. The altcoin lost over 80% of its value from 31 march until press time.
While the $11-$12 range seemingly supported the recent retracements, WAVES’ long-term trendline resistance (white) stood quite stiff. Not surprisingly, the Supertrend still struggled to change its stance from the red zone.
At press time, WAVES was trading at $12.47. The RSI slightly jumped from the oversold region in its revival endeavor. Also, the DMI lines were on the verge of a bullish crossover in the 4-hour timeframe. This crossover could help bulls break the bounds of the alt’s immediate resistance.


