VIRTUAL bulls struggle to defend $3, face 37% losses in 10 days – Details

- VIRTUAL has seen reduced trading volume over the last ten days
- The liquidity cluster below $3 marked it as a short-term price target
Virtuals Protocol [VIRTUAL] has not relinquished its long-term bullish outlook. And yet, the deep retracement from the all-time high at $5.25 is a worry for buyers. In fact, the psychological $3 level appeared ready to crumble in the face of seller momentum.
Bearish momentum has seized control over the last ten days
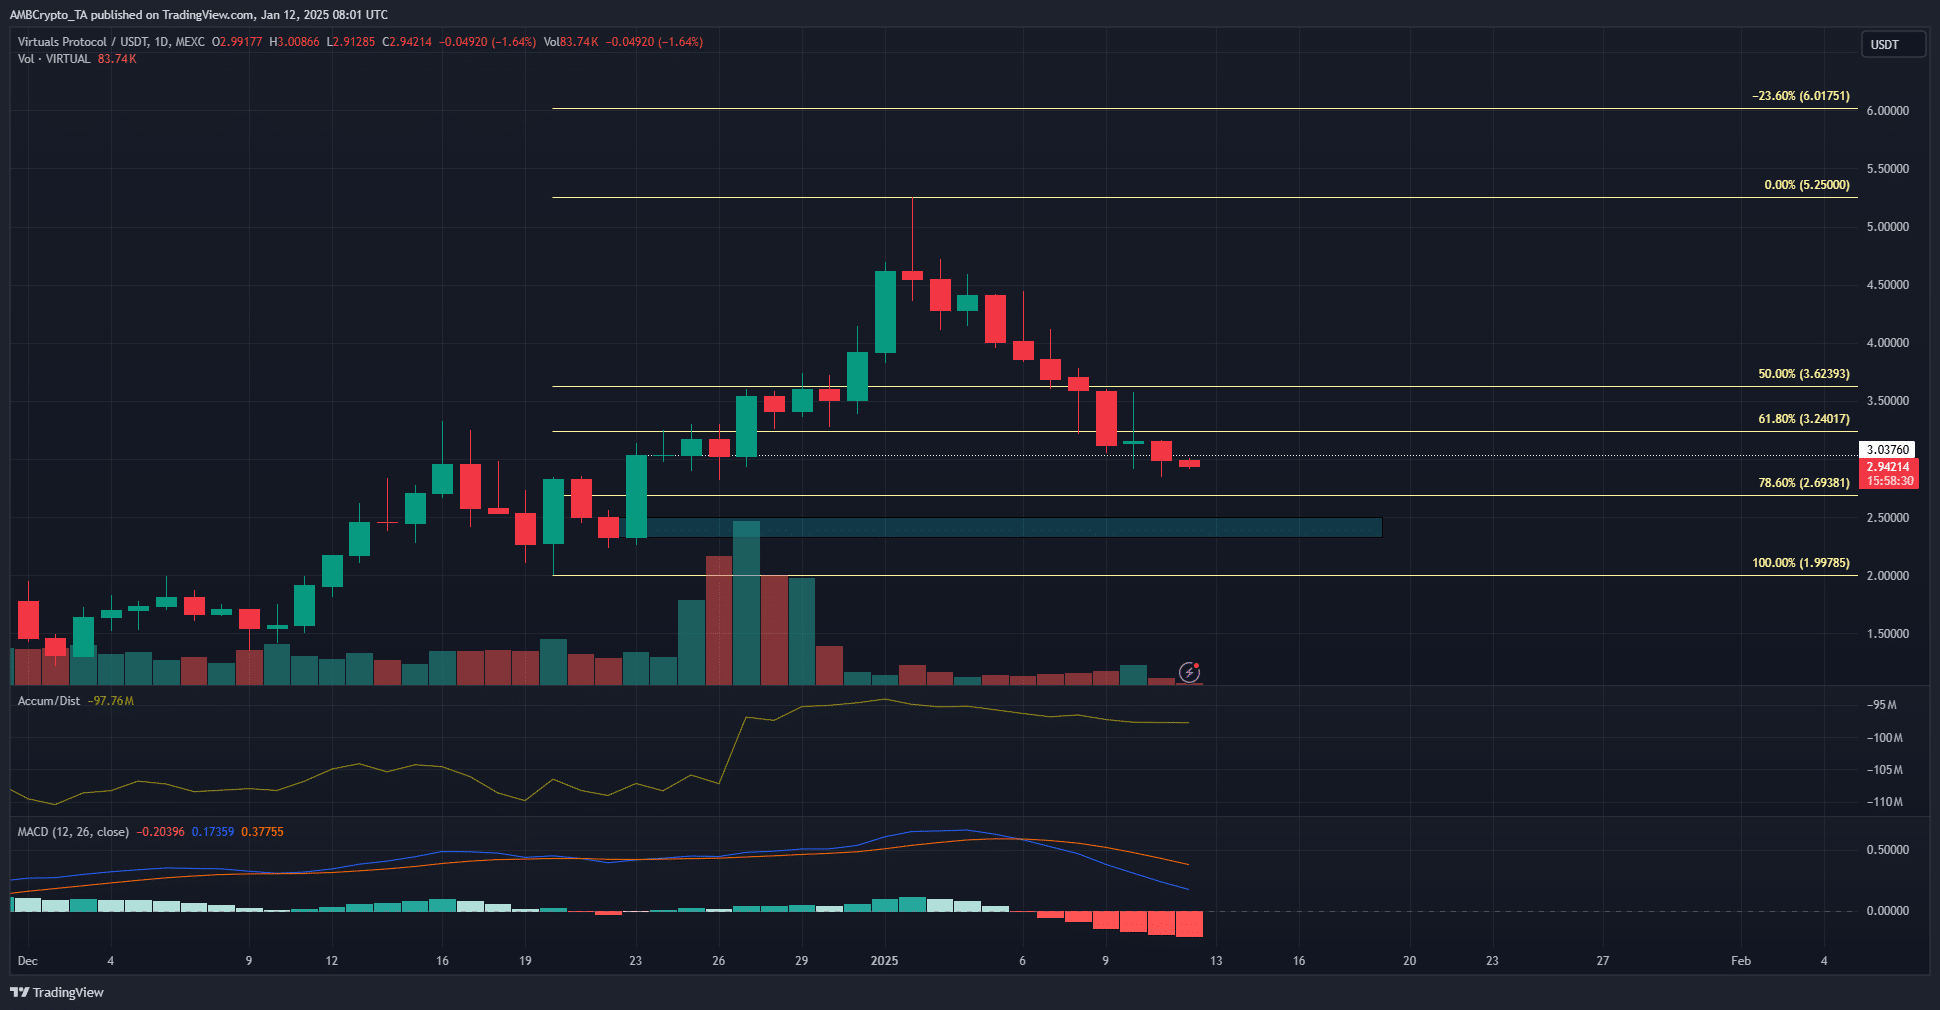
The price of the token has been falling lower each day since 02 January, with just two green days. While the trading volume was much reduced compared to the rally that took VIRTUAL to $5.25, the losses were still significant.
Virtuals Protocol has shed 37.81% in the last ten days, measured from the session close on 02 January and not the high at $5.25. The $5.25 measurement brought the losses to 45%. In either scenario, the outlook for VIRTUAL would be strongly bearish.
The 61.8% retracement level was ceded to the bears, and the $3.03 support was not defended either. The bullish order block at $2.45 is the next hope for a bullish reversal.
While the MACD suggested bearish momentum has been growing, the indicator remained above zero. This meant that the long-term trend was not bearish. Instead, just the momentum of the last ten days was so. The fall in selling volume meant the A/D indicator fell slightly, but did not slide lower substantially.
Both indicators showed short-term bearishness, but also underlined some hope for recovery once market sentiment shifts.
More losses in sight for VIRTUAL

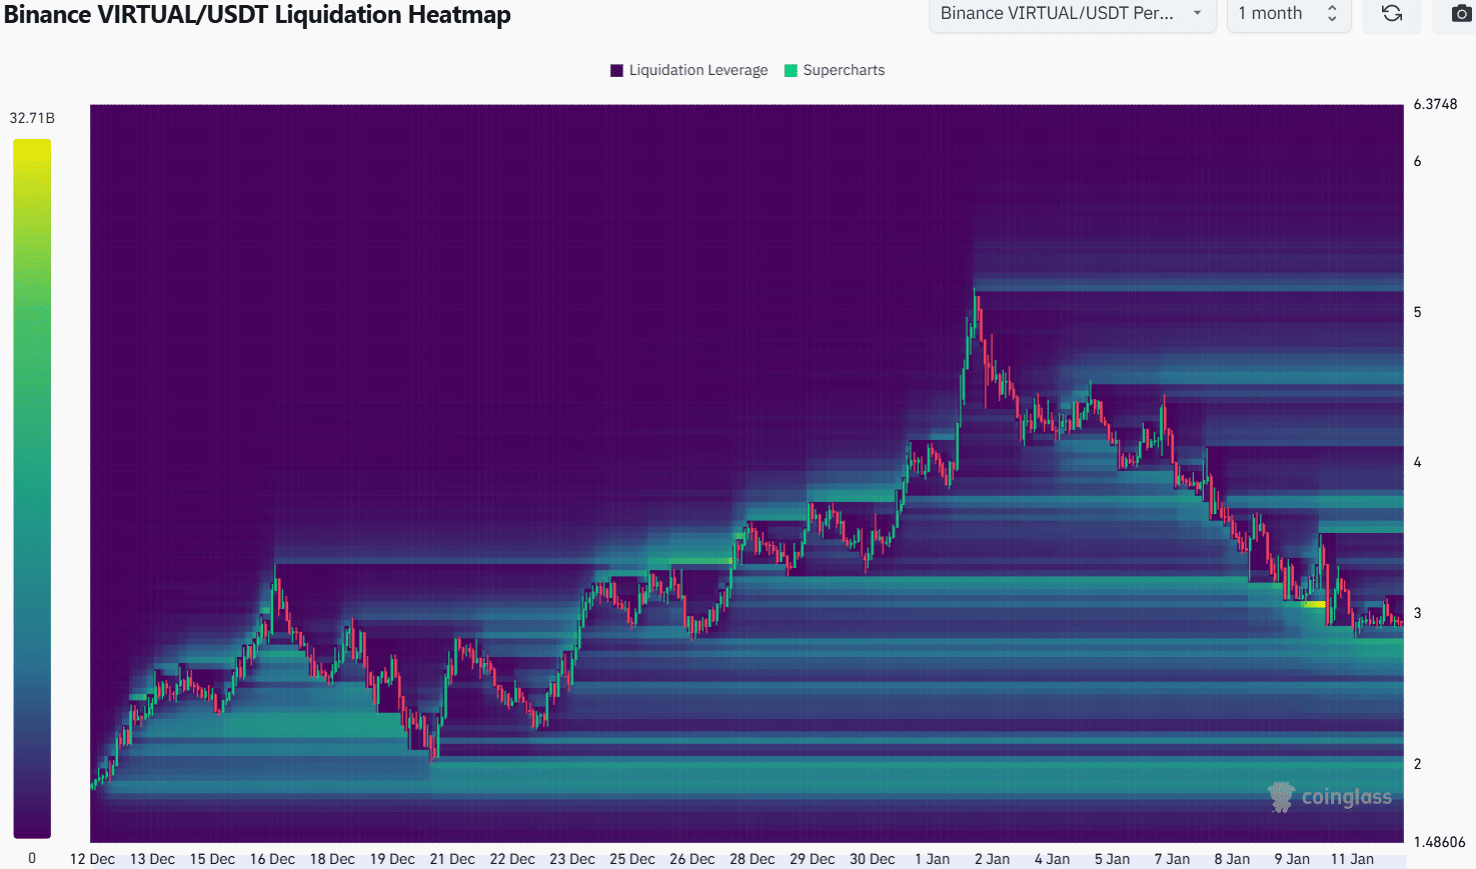
Source: Coinglass
While the daily timeframe was not technically in a downtrend, the lower timeframe charts were. The series of lower lows and lower highs gathered liquidation levels to them. At the time of writing, the two nearest liquidity clusters were at $2.77 and $3.55.
Is your portfolio green? Check the Virtuals Protocol Profit Calculator
Therefore, in the coming days, these would likely be the pivotal levels for the trend of the Virtuals Protocol token. A drop to $2.77 can be anticipated, given the firm bearish short-term momentum of the coin.
Disclaimer: The information presented does not constitute financial, investment, trading, or other types of advice and is solely the writer’s opinion


