Warning signs for Ethereum’s price? Traders, watch out for this index!
A short-term price dip may be in store for Ethereum.

- Ethereum’s metrics revealed bulls have a reason to be concerned, despite its recent rally
- Higher timeframe bias was bullish, but a 2% -7% drop might happen within a week or two
On 20 May, Ethereum [ETH] surged past its critical resistance zone at $3.1k after three weeks of trying. This move came soon after news of the spot Ethereum ETF’s approval broke out, with an official approval coming on 23 May.
Since the surge, however, the trading volume has fallen to the levels it was at earlier in May. The NFT marketplace also saw a notable drop in activity. Additionally, U.S.-based investor interest has slumped too.
Coinbase Premium reached 2024’s lows
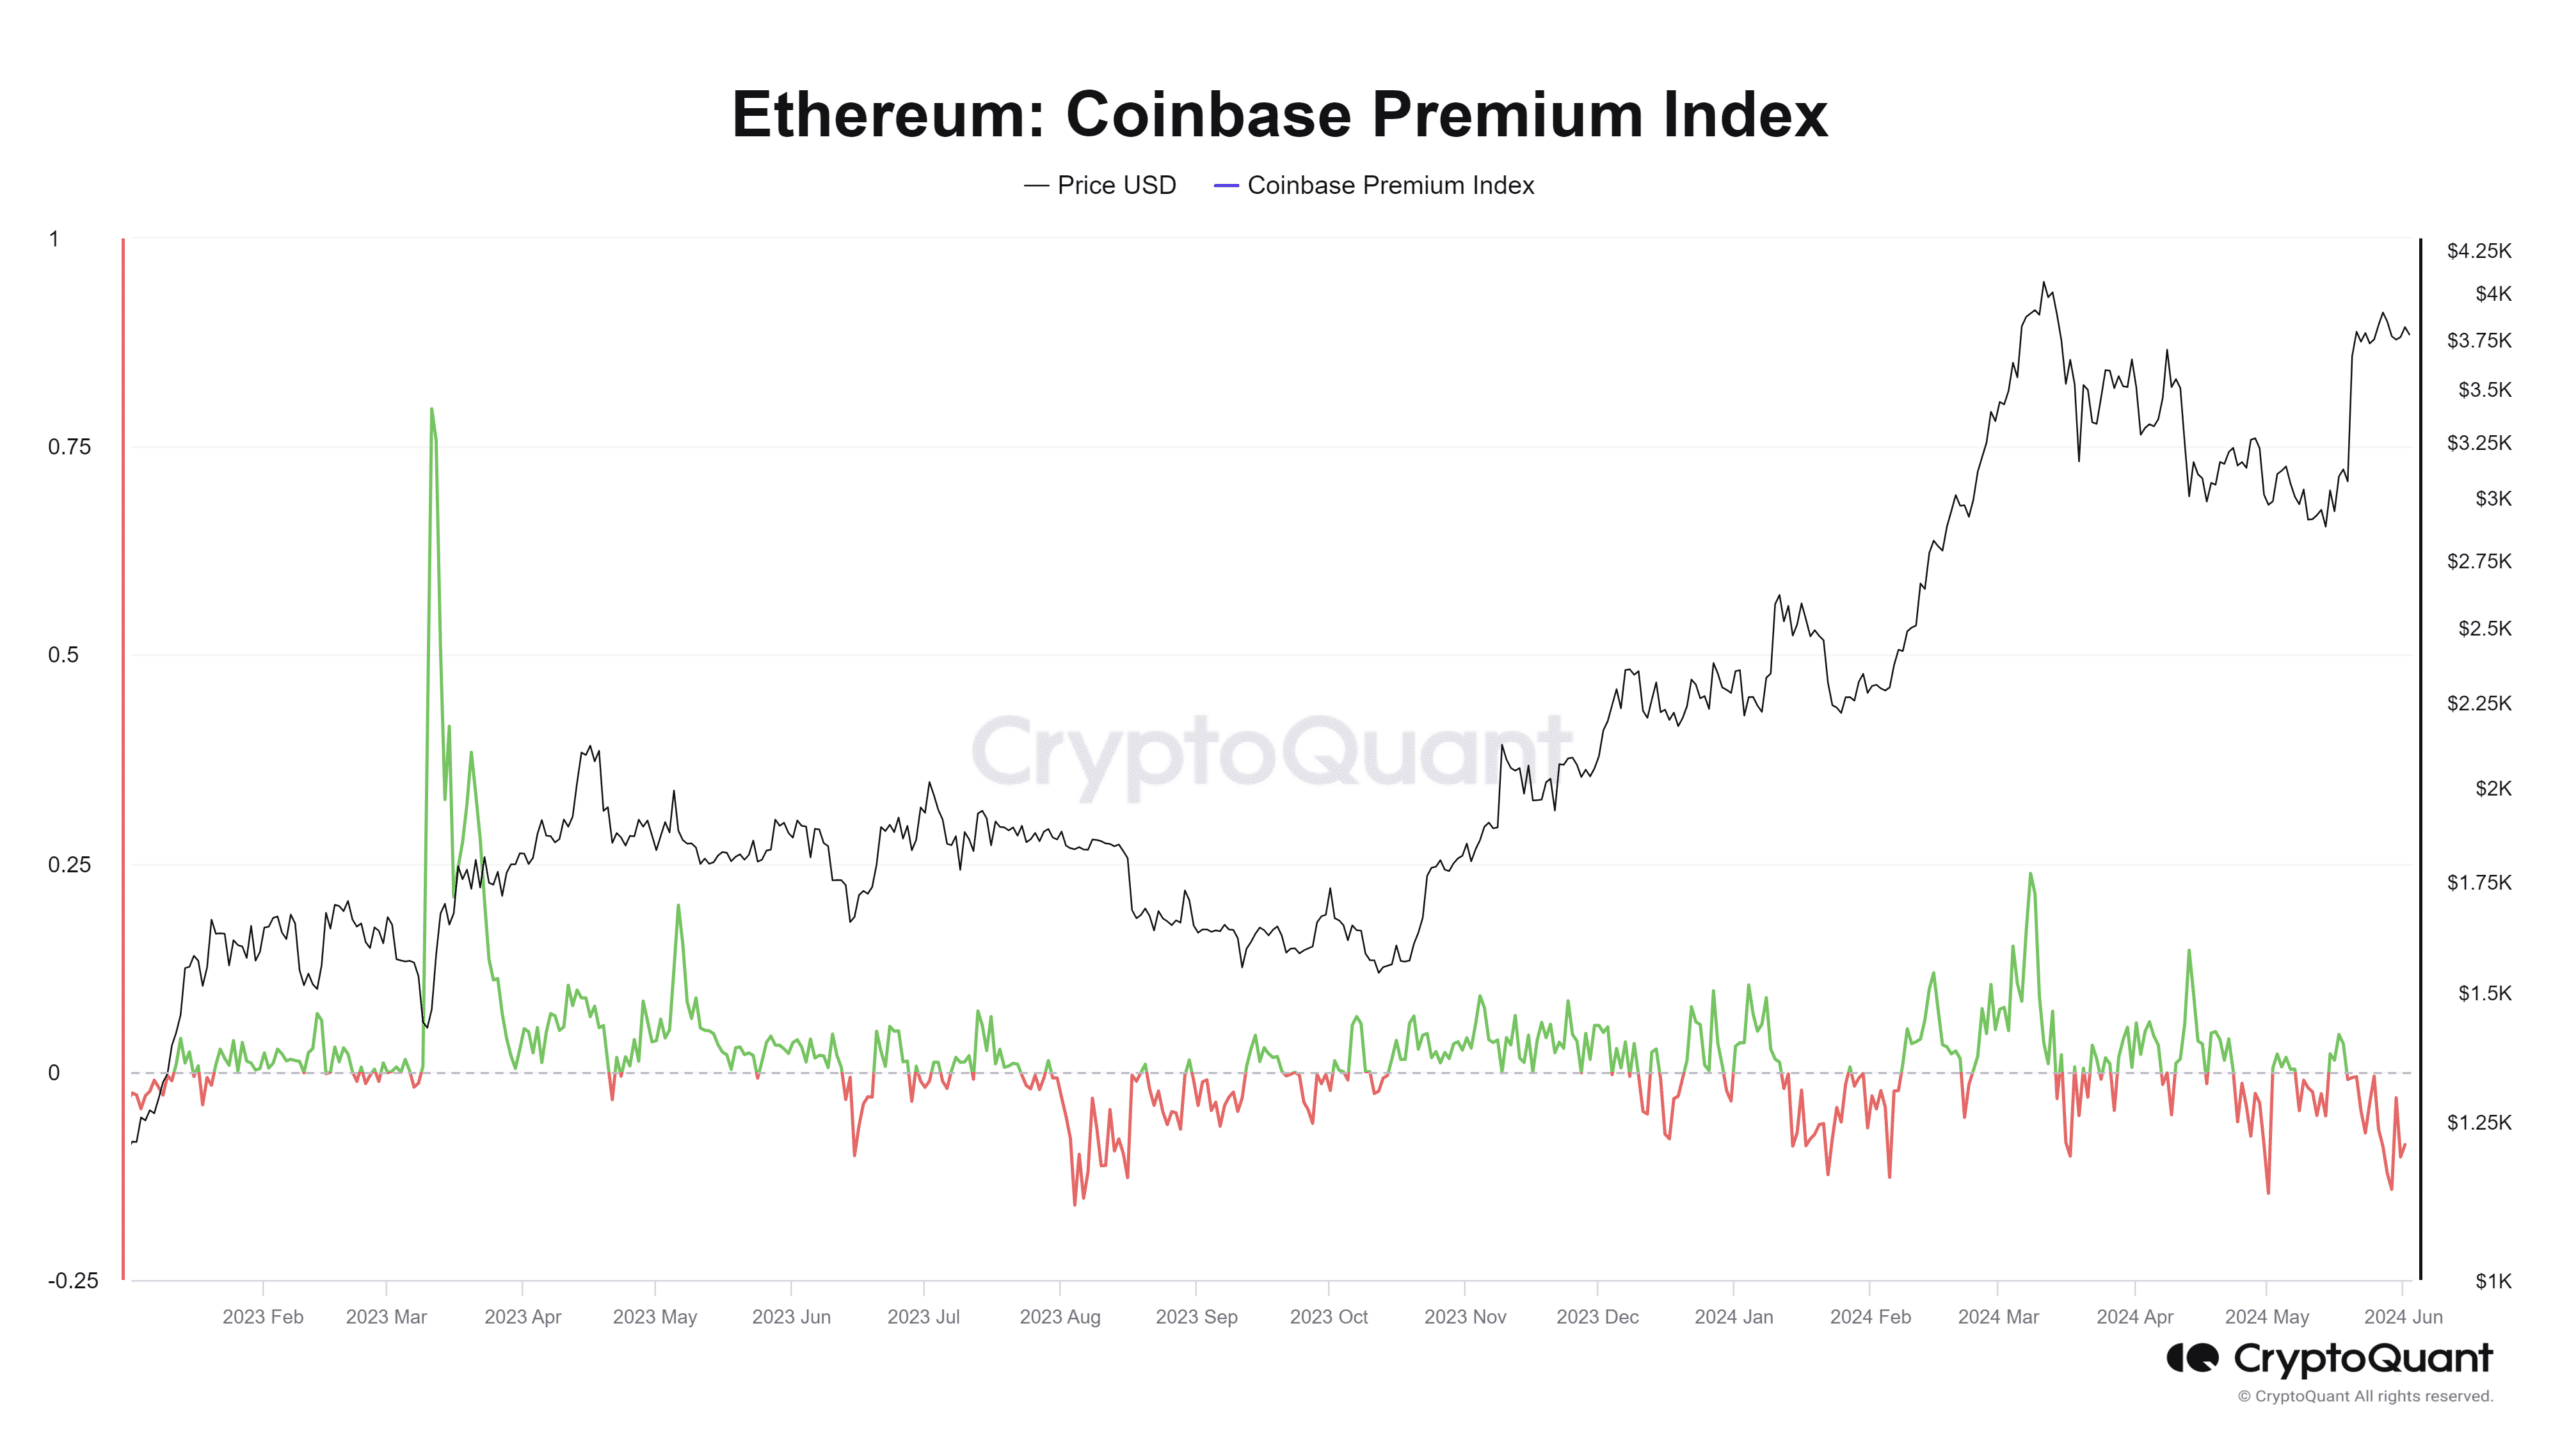
The Ethereum Coinbase Premium Index is the percent difference between the Coinbase ETH/USD pair and the ETH/USDT pair on Binance. It is a good indicator of the interest levels from investors in the U.S since they can access Coinbase and not Binance.
Back in August 2023, the premium saw a sharp fall to reach -0.16. Just ten days later, the price of Ethereum fell from $1.8k to $1.6k. While the Premium Index does not presage every price drop, a decline in this metric is a notable clue that demand on the other side of the Atlantic may be falling.
On 29 May, it fell to -0.141 – A sign of shrinking demand even as Ethereum traded above the $3.7k-level.
Other clues that ETH prices might retrace soon
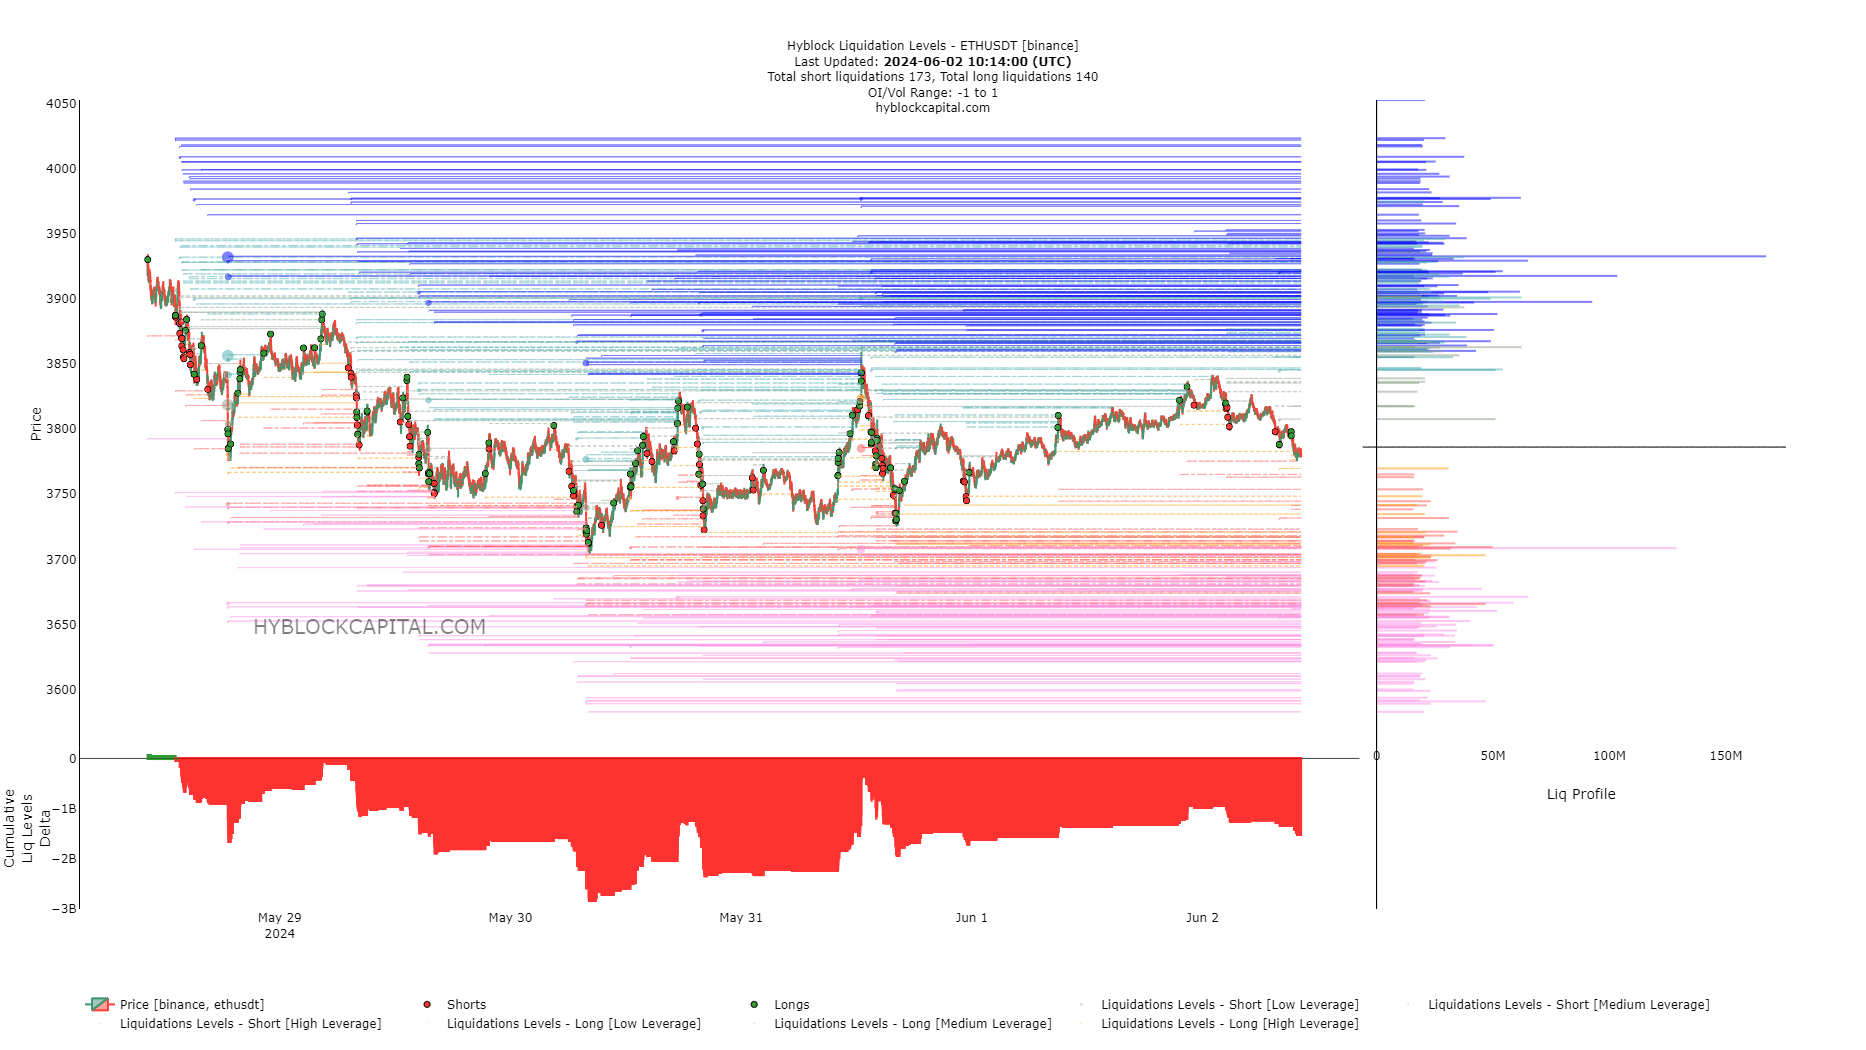
The liquidation levels data from Hyblock revealed that the cumulative liq levels delta was firmly negative. Now, while it has improved over the past two days, the short positions comfortably outweighed the longs.
Hence, to trigger the liquidations of many of these bears, the prices might jump higher. For example, the price action on 31 May saw a similar scenario play out. The long liquidation levels clustered at $3.7k, just 2.4% lower than the market price at press time, could be taken out before a bounce.
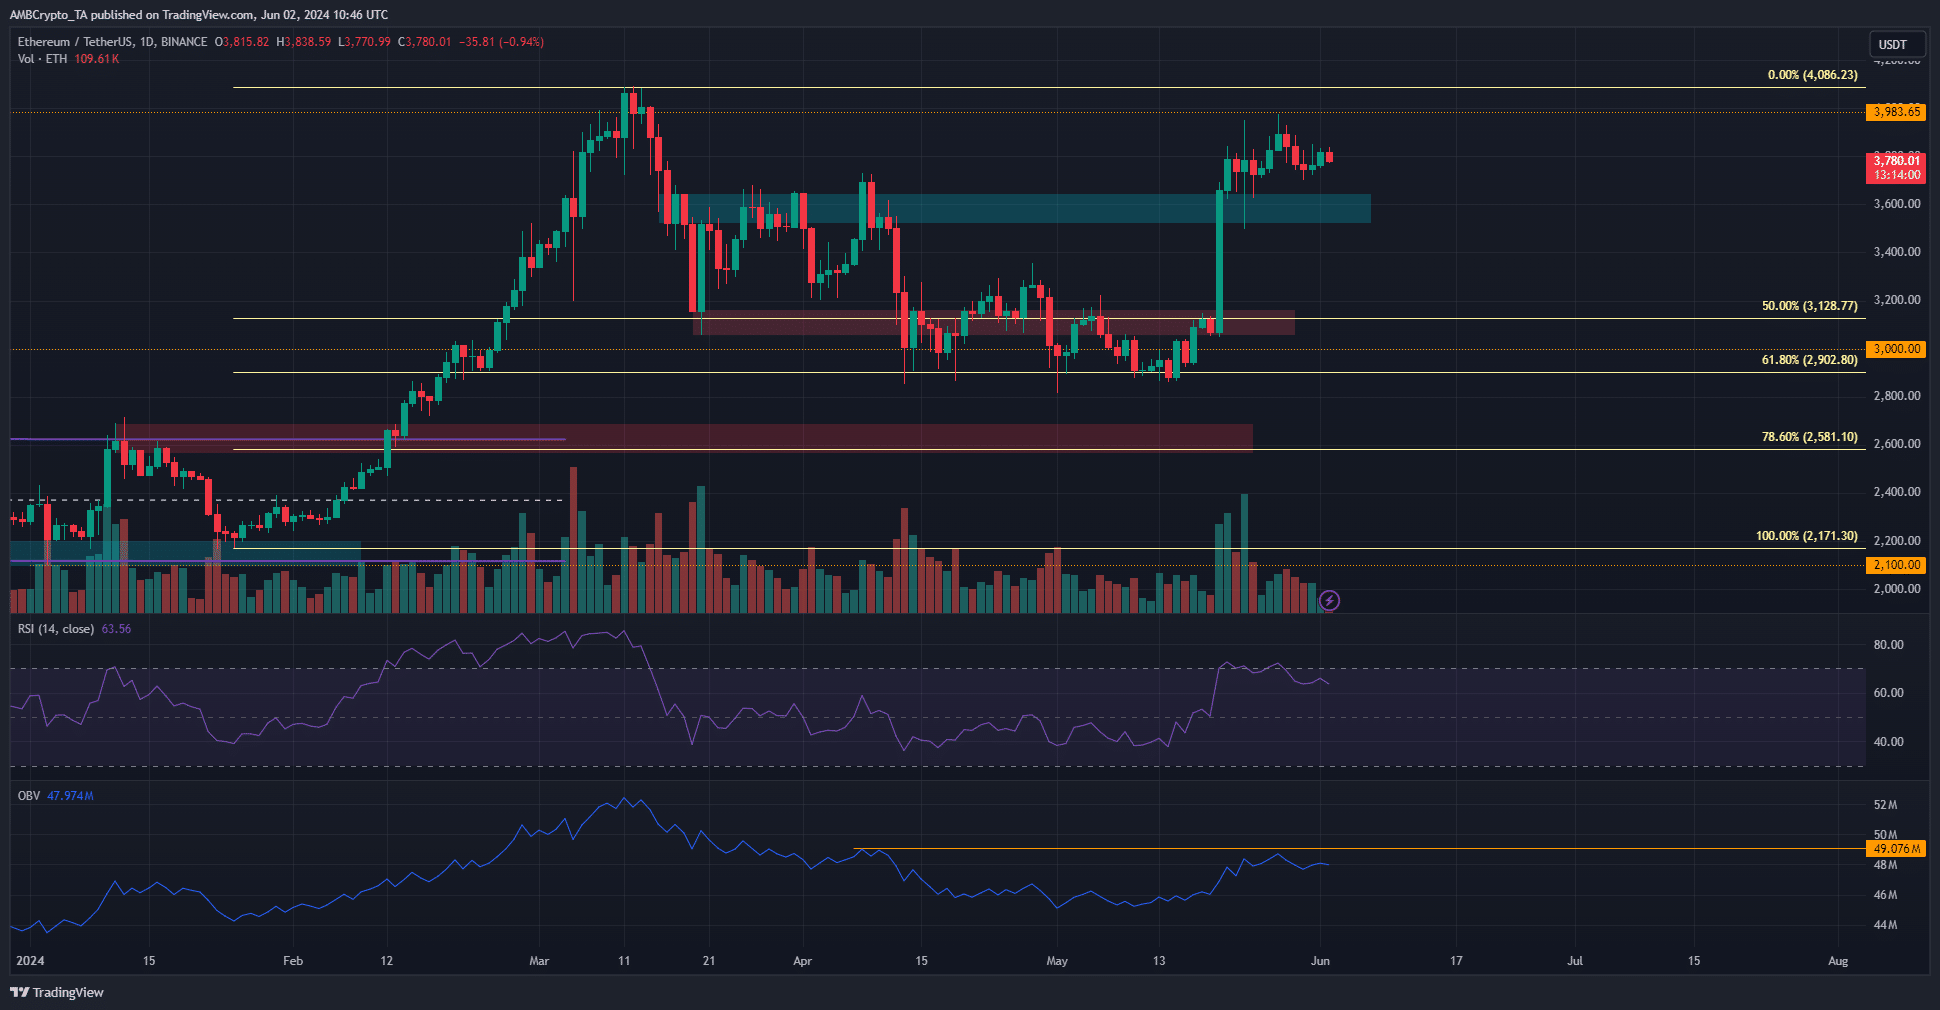
The cyan box from $3540 to $3640 highlighted a demand zone from March. The market structure was bullish, and this demand zone is important in the short-term. The OBV was unable to clear a lower high from April, which pointed to a lack of consistent demand during its recent rally. The indicator also reinforced the likelihood of a price drop towards $3.6k.
Read Ethereum’s [ETH] Price Prediction 2024-25
The long-term trend is upward based on the Fibonacci retracement levels. The rally earlier this year retraced to the 61.8% level at $2.9k and saw a recovery in May.