Analysis

WAVES: Here are the odds on the altcoin noting more losses on the charts
Posted:
Journalist

Disclaimer: The information presented does not constitute financial, investment, trading, or other types of advice and is solely the writer’s opinion.
- $4 or $3.3, which one first for WAVES?
- Price was back at September lows, a bounce could materialize
With a market capitalization of $410 million, Waves was ranked 85th, at press time. However, the asset has seen far better days. In March, it traded near the $60-mark but has been in a pronounced downtrend since then.
At the time of writing, the $3.75-level was one to watch out for. A few days ago, the platform tweeted about the Waves School lessons and Waves believes it is a great step forward in introducing crypto and NFTs to the masses.
Waves bulls routed as liquidity pocket is retested
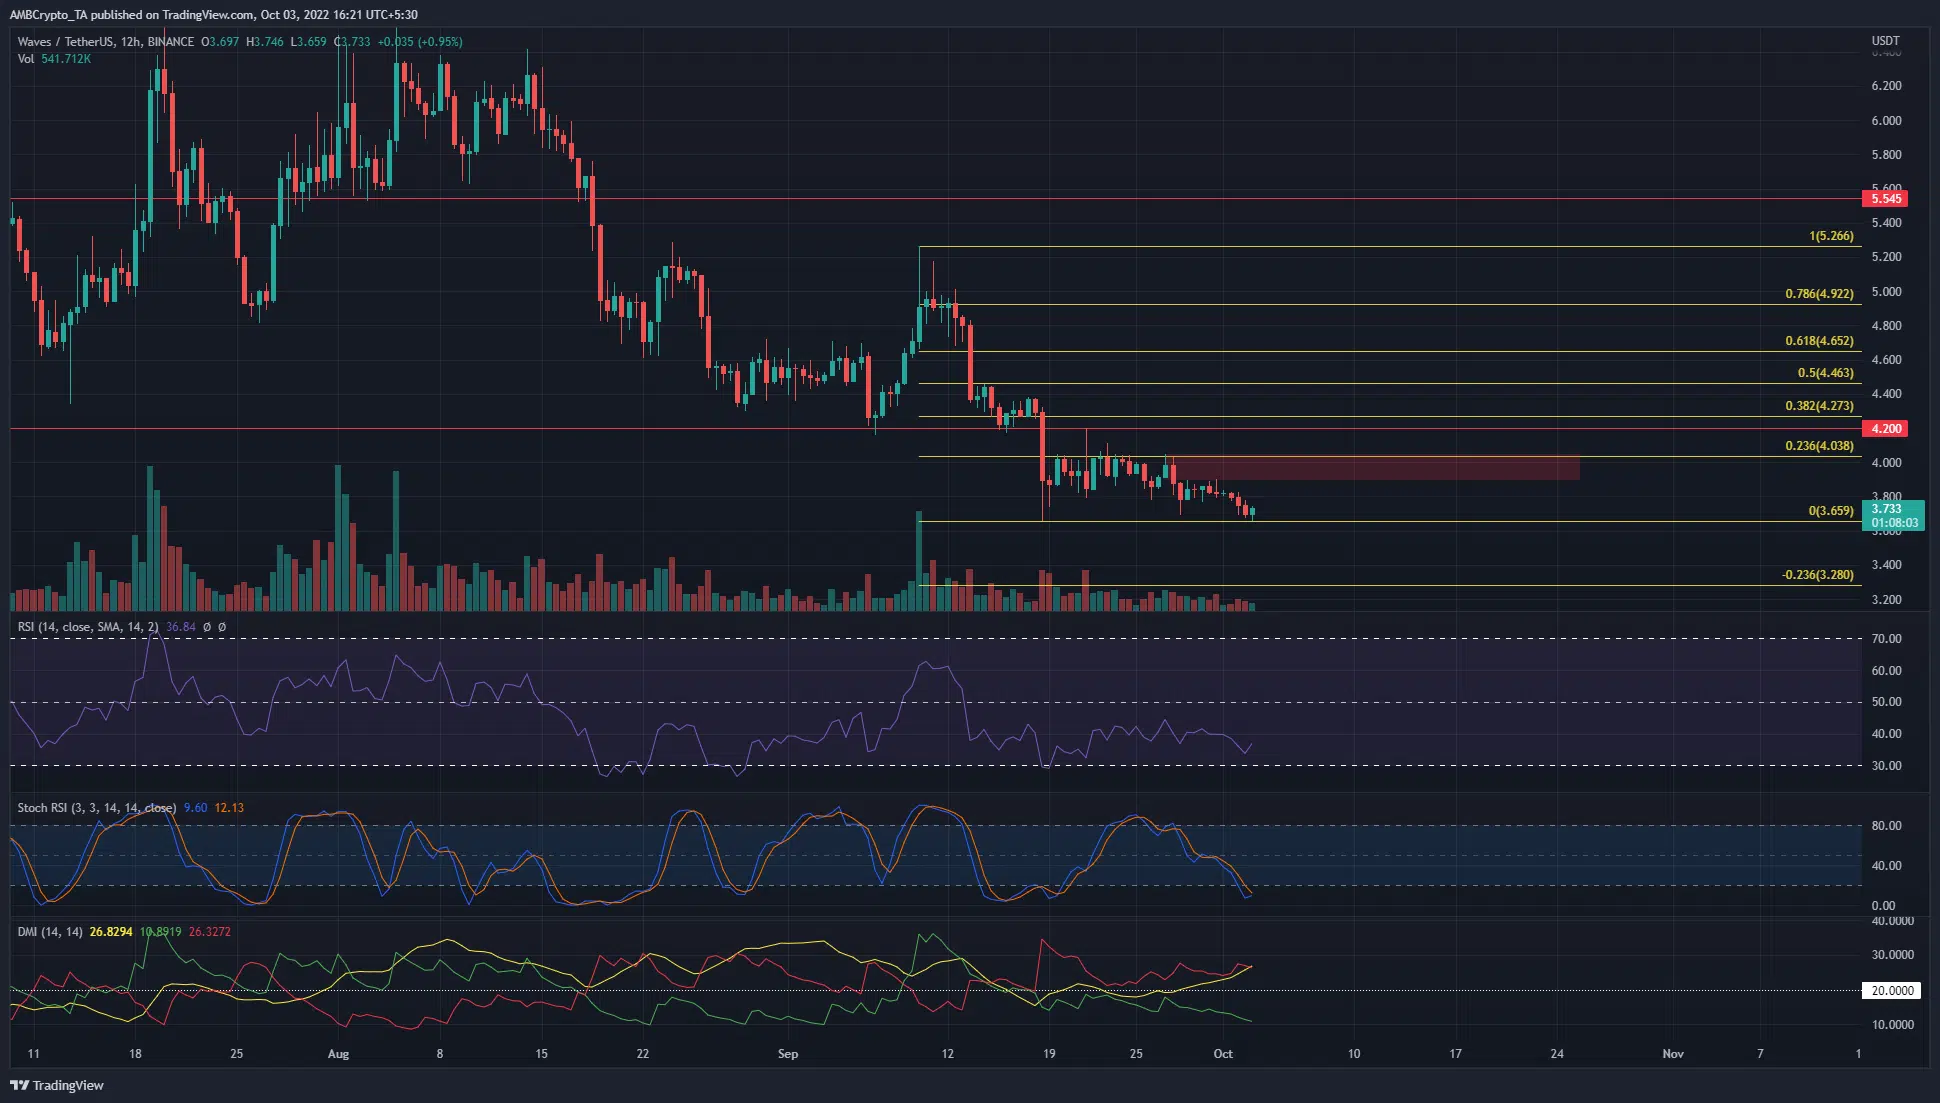
Source: WAVES/USDT on TradingView
On the 12-hour chart, the structure of WAVES was bearish and the downtrend was strong as well. The price surged in mid-September but it was still unable to beat the previous lower high. On a lower timeframe, the $3.7-pocket of liquidity had seen multiple candlewicks in the past month, followed by a decent bounce.
With time, these bounces weakened as the sellers gained more and more confidence following each retest. The past couple of days saw this zone flipped to resistance.
The indicators showed a bearish bias for WAVES as well. The RSI was at 36 and has been below neutral 50 for the better part of the past month. At the same time, the Directional Movement Index also indicated a significant downtrend in progress as both the -DI (red) and the ADX (yellow) were above 20.
Sentiment down, Bitcoin correlation doesn’t help either
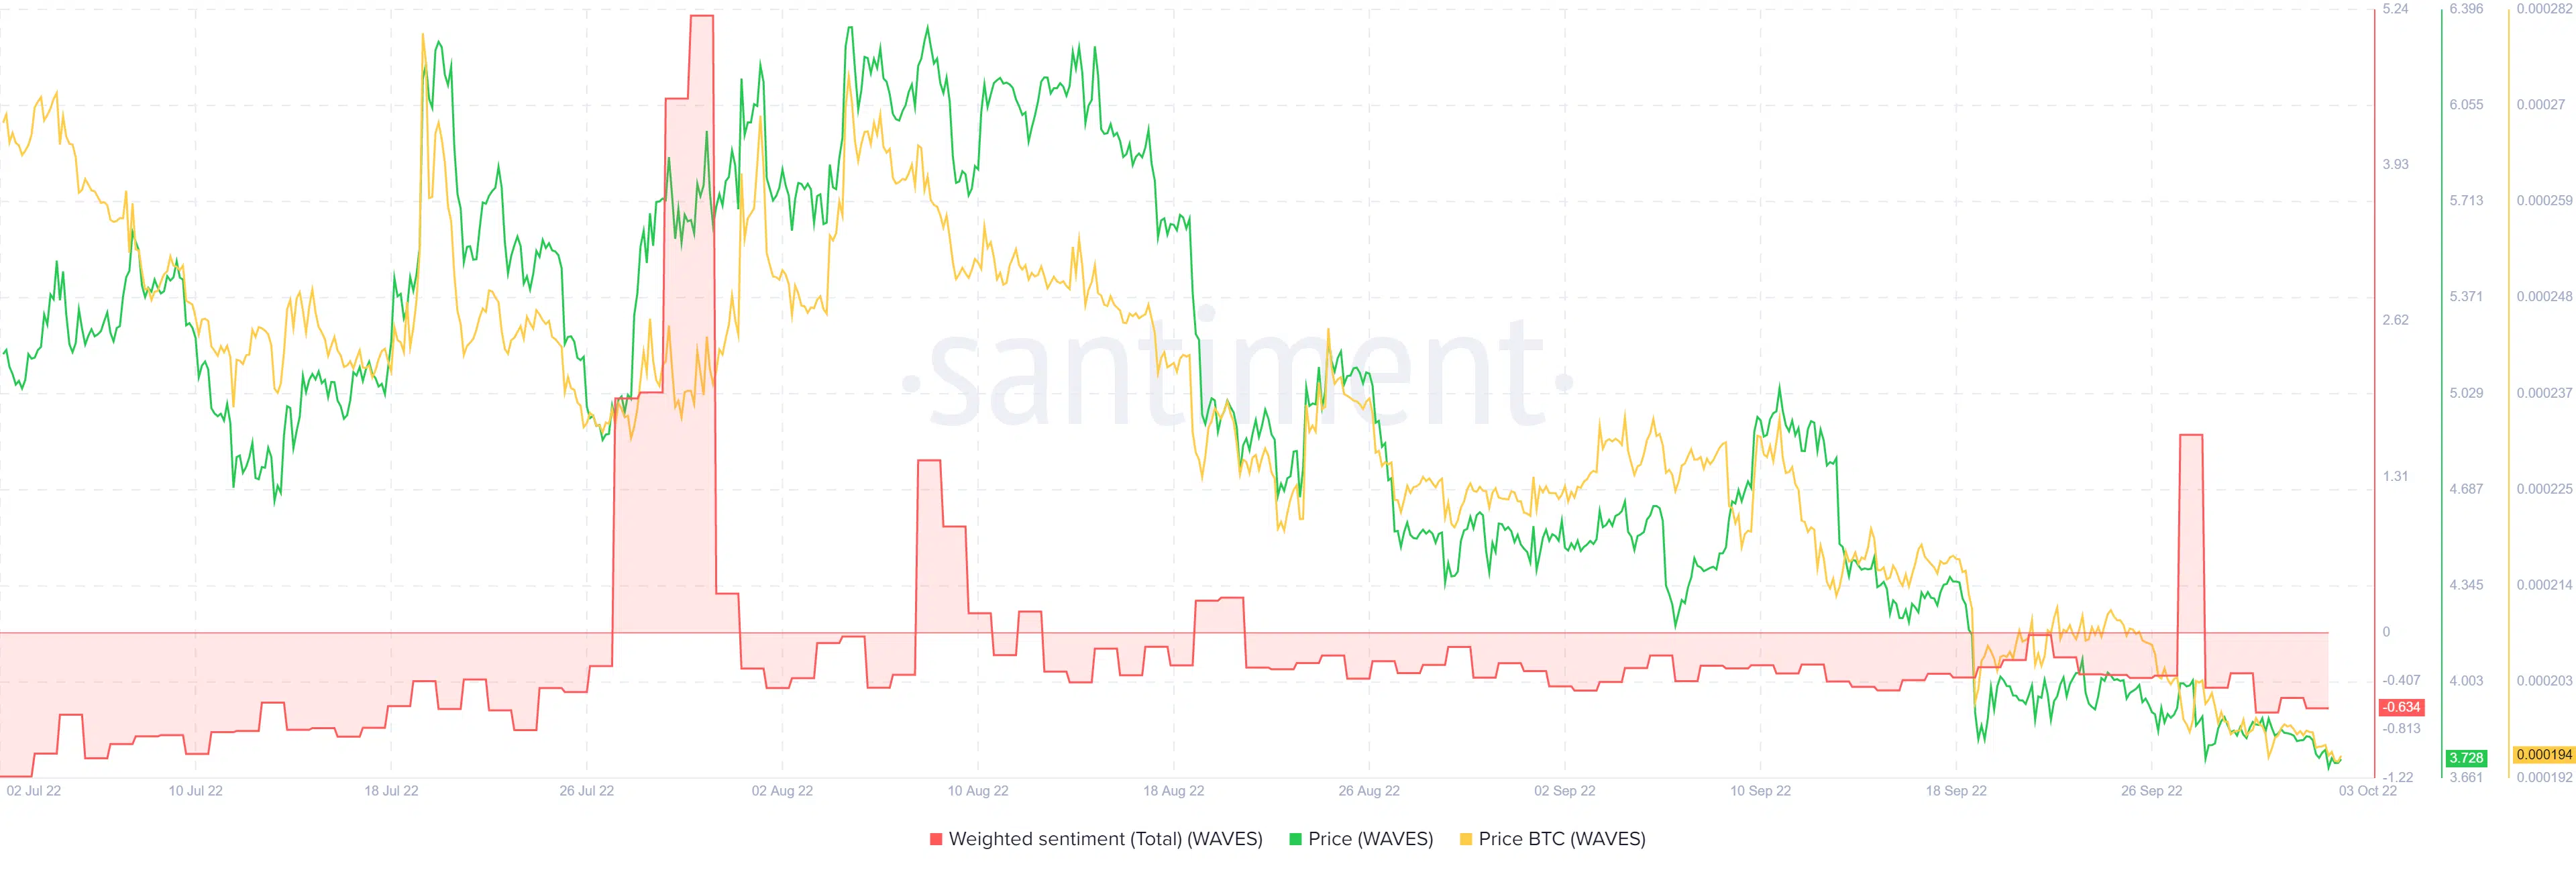
Source: Santiment
Right off the bat, the Santiment chart showed WAVES to move in tandem with Bitcoin on the price chart. This highlighted the fact that in recent months, Bitcoin has had a strong influence on the sentiment behind altcoins. It could take an uptrend for Bitcoin to revive bullish hopes behind altcoins, which in turn could depend on the health of global indices.
The total Weighted Sentiment has also been negative, which reflected the sentiment behind the asset on the price charts.
All together, the bearish sentiment across the market meant Waves also faced strong selling pressure. The technical structure favoured the bears and the $3.75 and $4 were strong resistance levels.
A move above $4 could provide some compelling evidence of a shift in market structure. However, with Bitcoin unable to beat the $20.5k resistance, another leg downward could slowly unfurl on the price charts of WAVES.