Whales flock to Toncoin despite price risks: What’s your move?
TON may shed some of its double-digit gains from last month as buying pressure plummets in the market.
- Toncoin has seen an uptick in whale accumulation.
- However, it remains at risk of decline.
Toncoin [TON] has seen a surge in whale activity on its network in the past few weeks, CryptoQuant analyst Joao Wedson found in a new report.
According to Wedson, there has been a notable uptick in wallet addresses holding between 100,000 and 1 million TON tokens.
Wedson argued that:
“Such behavior from major players is often a strong indicator of the asset’s potential and perceived value. Their growing accumulation signals a positive outlook and a belief in the continued growth and stability of TON.”
However, the ongoing whale accumulation has failed to move the needles, as readings from TON’s price chart showed that it may be poised for a short-term decline.
TON has a rough road ahead of it
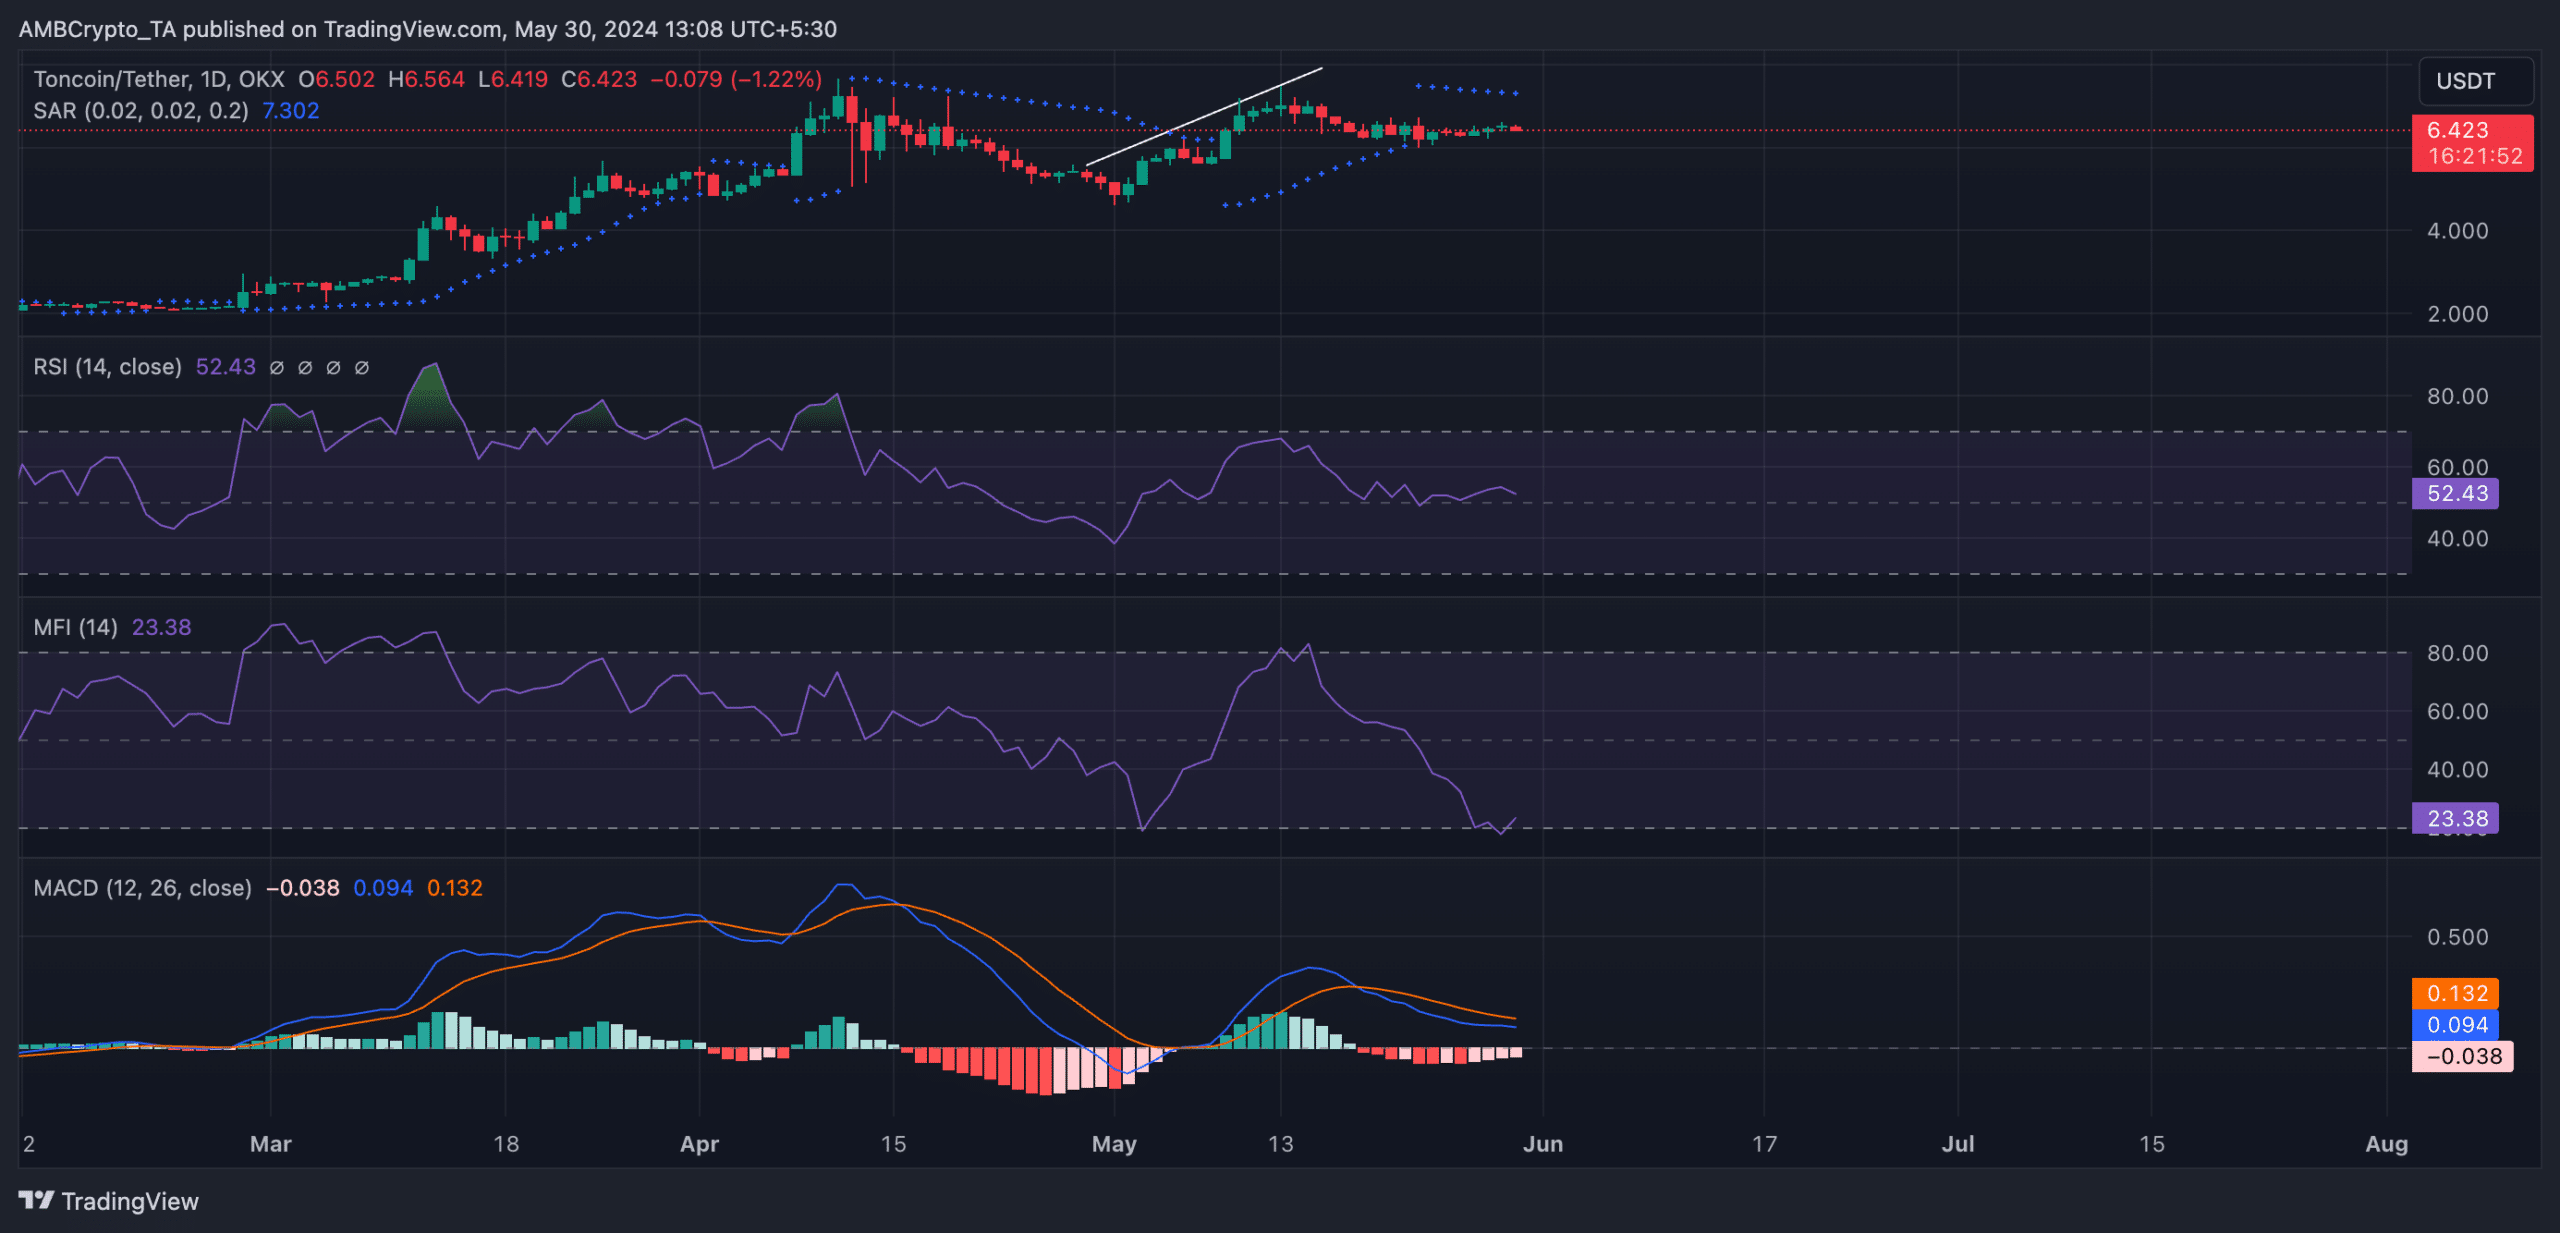
At press time, the altcoin exchanged hands at $6.43. While its value has risen by 20% in the last month, TON may soon shed some of these gains.
Despite TON’s price growth, its Relative Strength Index (RSI) and Money Flow Index (MFI) have declined, thereby creating a bearish divergence. At press time, TON’s RSI was 52.57, while its MFI was 23.39.
At these values, the indicators showed that even though TON’s price has risen in the past few weeks, the underlying buying pressure might be weakening.
The divergence formed tells market participants that the uptrend might be nearing exhaustion, and a potential decline is on the horizon.
Confirming the possibility of a downtrend, the dots of TON’s Parabolic SAR indicator rested above its price.
This indicator identifies an asset’s potential trend direction and price reversals. When its dotted lines are placed above an asset’s price, the market is said to be in decline. This indicates that buying pressure is weak, and the asset’s price may witness a decline.
In addition, TON’s MACD line (blue) rested below its signal line (orange) as of this writing.
Is your portfolio green? Check the Toncoin [TON] Profit Calculator
This setup is regarded as bearish as it signaled that TON’s upward momentum has weakened, and its shorter-term moving average (MACD line) was now falling faster than the longer-term moving average.
Traders often interpret it as a sign to exit short and take long positions.


