
- AVAX’s NVT ratio downtrend signals potential undervaluation, indicating bullish prospects.
- For a bullish reversal, AVAX needs to break above the Ichimoku cloud and see the MACD line cross above the signal line.
Avalanche [AVAX] is currently showing promising signs of a bullish reversal, driven by recent market dynamics and buying pressure. But what does it need in order for the bulls to make a complete overturn?
AMBCrypto took a look at AVAX’s network value to transactions ratio. It is on a downtrend, which is typically a bullish signal indicating the token may be undervalued relative to the amount of transactions.
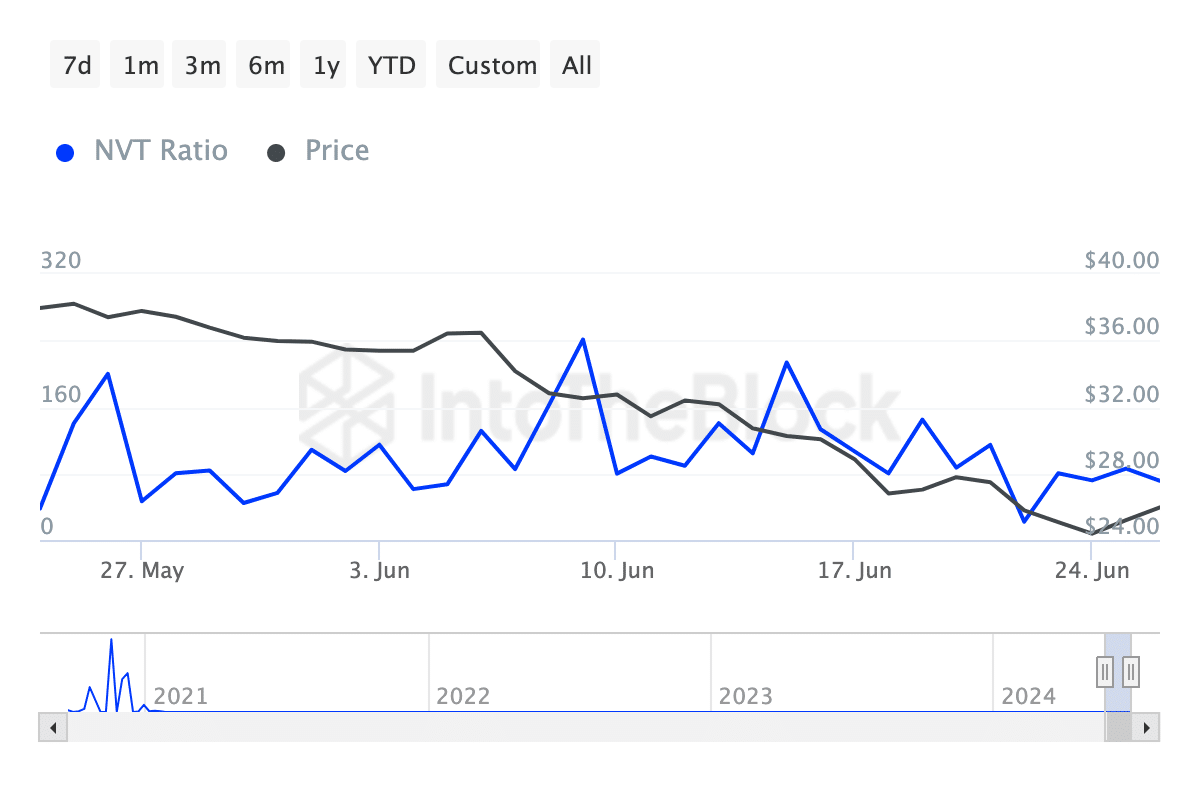
Source: IntoTheBlock
However, the decline in active addresses through June signals reduced network activity, potentially dampening bullish momentum unless reversed.
AVAX bulls overpowered by the bears
AVAX’s exchange netflow ratio has increased, with an overall trend of AVAX moving into exchanges in larger amounts recently.
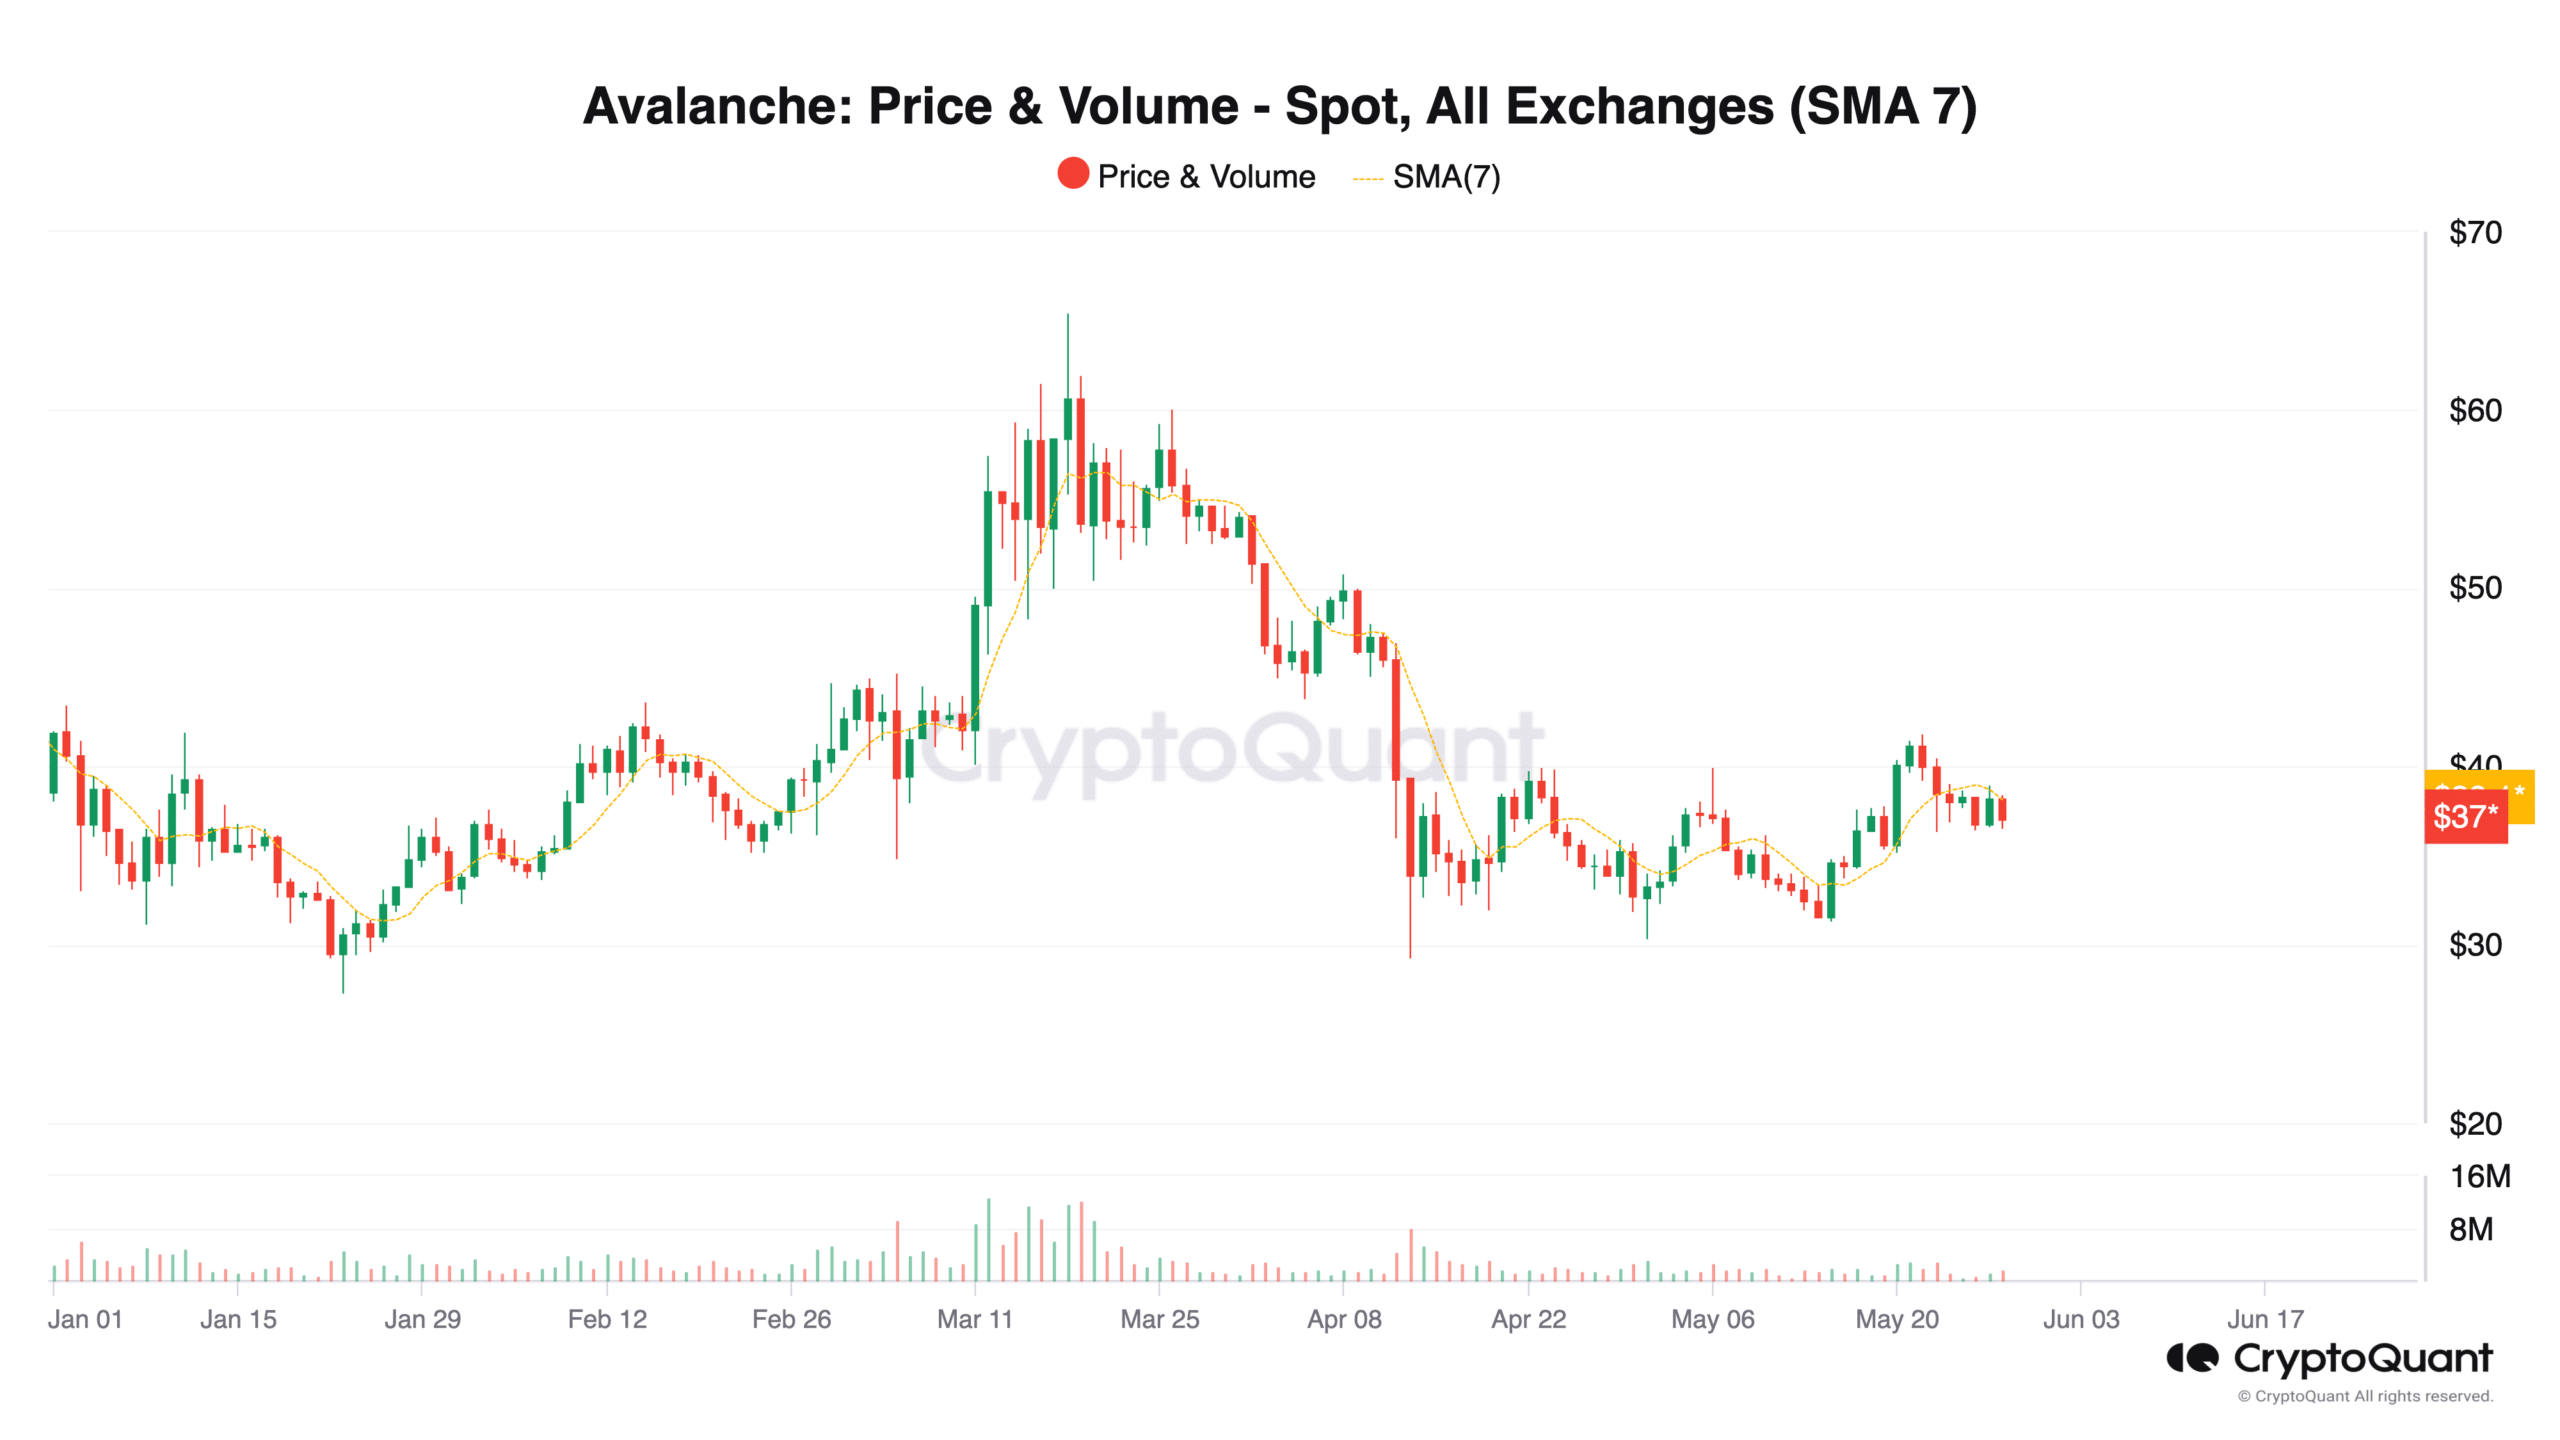
Source: CryptoQuant
If the NVT ratio continues to decline amidst rising transaction volumes, it supports a healthier, fundamentally driven growth, contributing positively to a bullish market reversal.
The Ichimoku Cloud (or Kumo) is currently showing a red cloud, suggesting an incoming bearish phase. The Tenkan-Sen (blue line) appears to be below the Kijun-Sen (red line), which is another bearish signal.
Crossover under the cloud completely undermines the current bullish momentum.
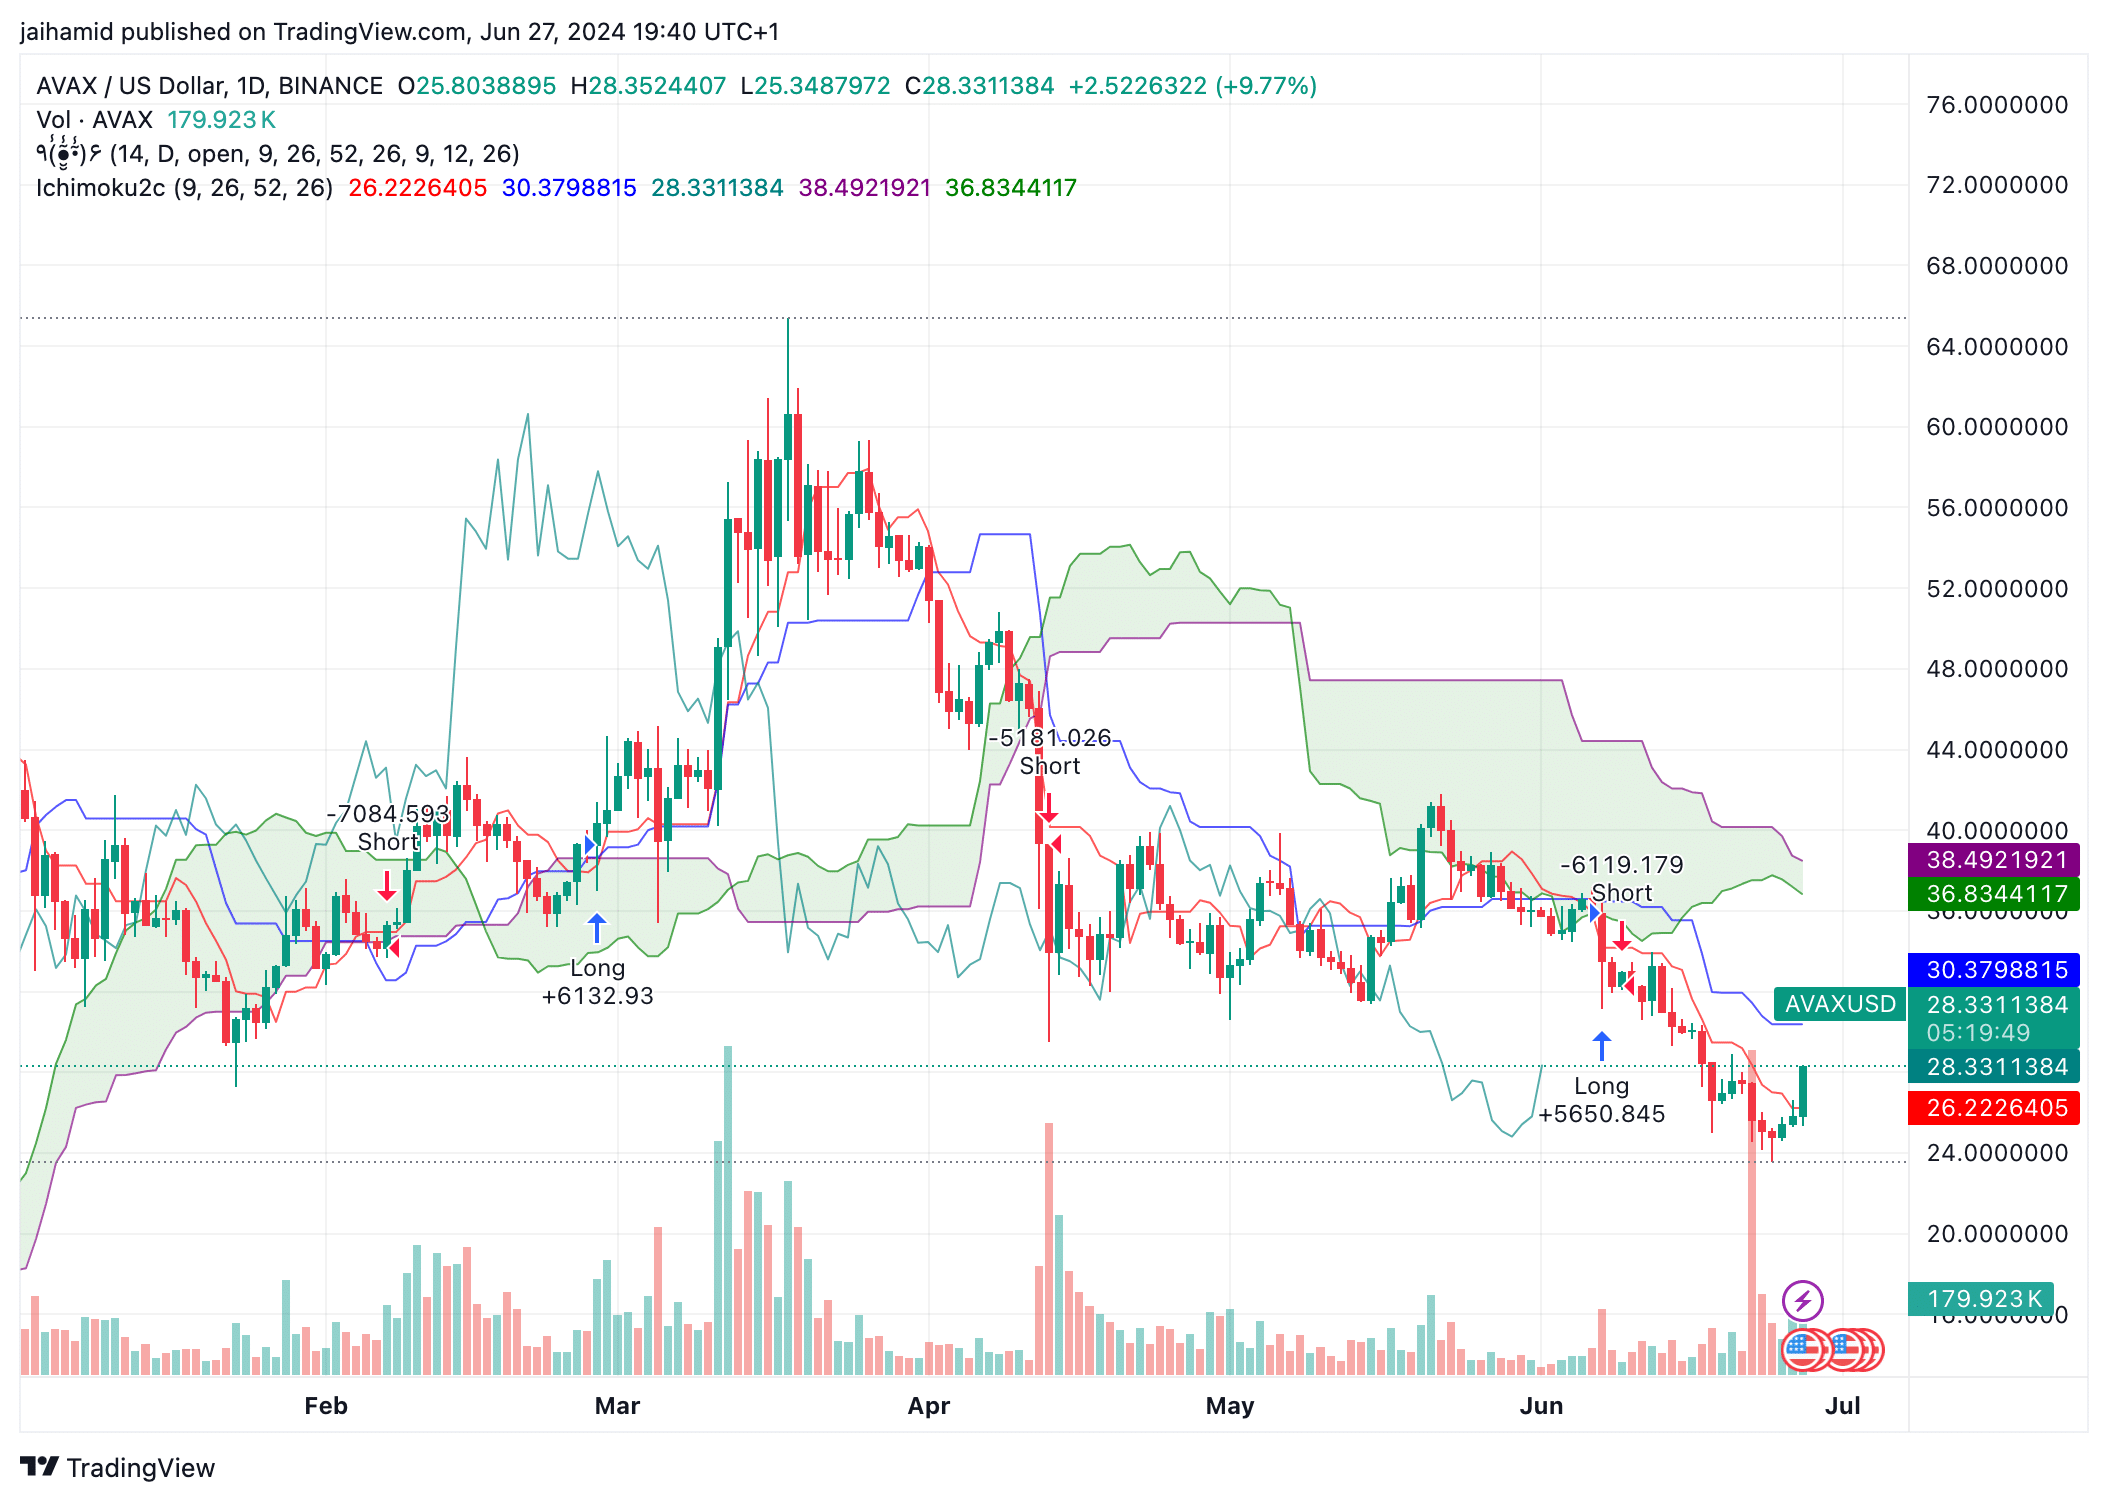
Source: TradingView
For a bullish reversal to hold, AVAX needs to break above the Ichimoku cloud convincingly, accompanied by a crossover of the Tenkan-Sen above the Kijun-Sen within or above the cloud. An increase in volume on bullish days would support this reversal.
Interestingly, the 200-day MA shows a significant bullish trend over the long term, currently placed far below the current price level. The MACD line is below the signal line and both are heading downward, led by the bears.
Should the price attempt a recovery, the green MA (200-day) may act as a critical support level. Any reversal from this level would signal a bullish reversal.
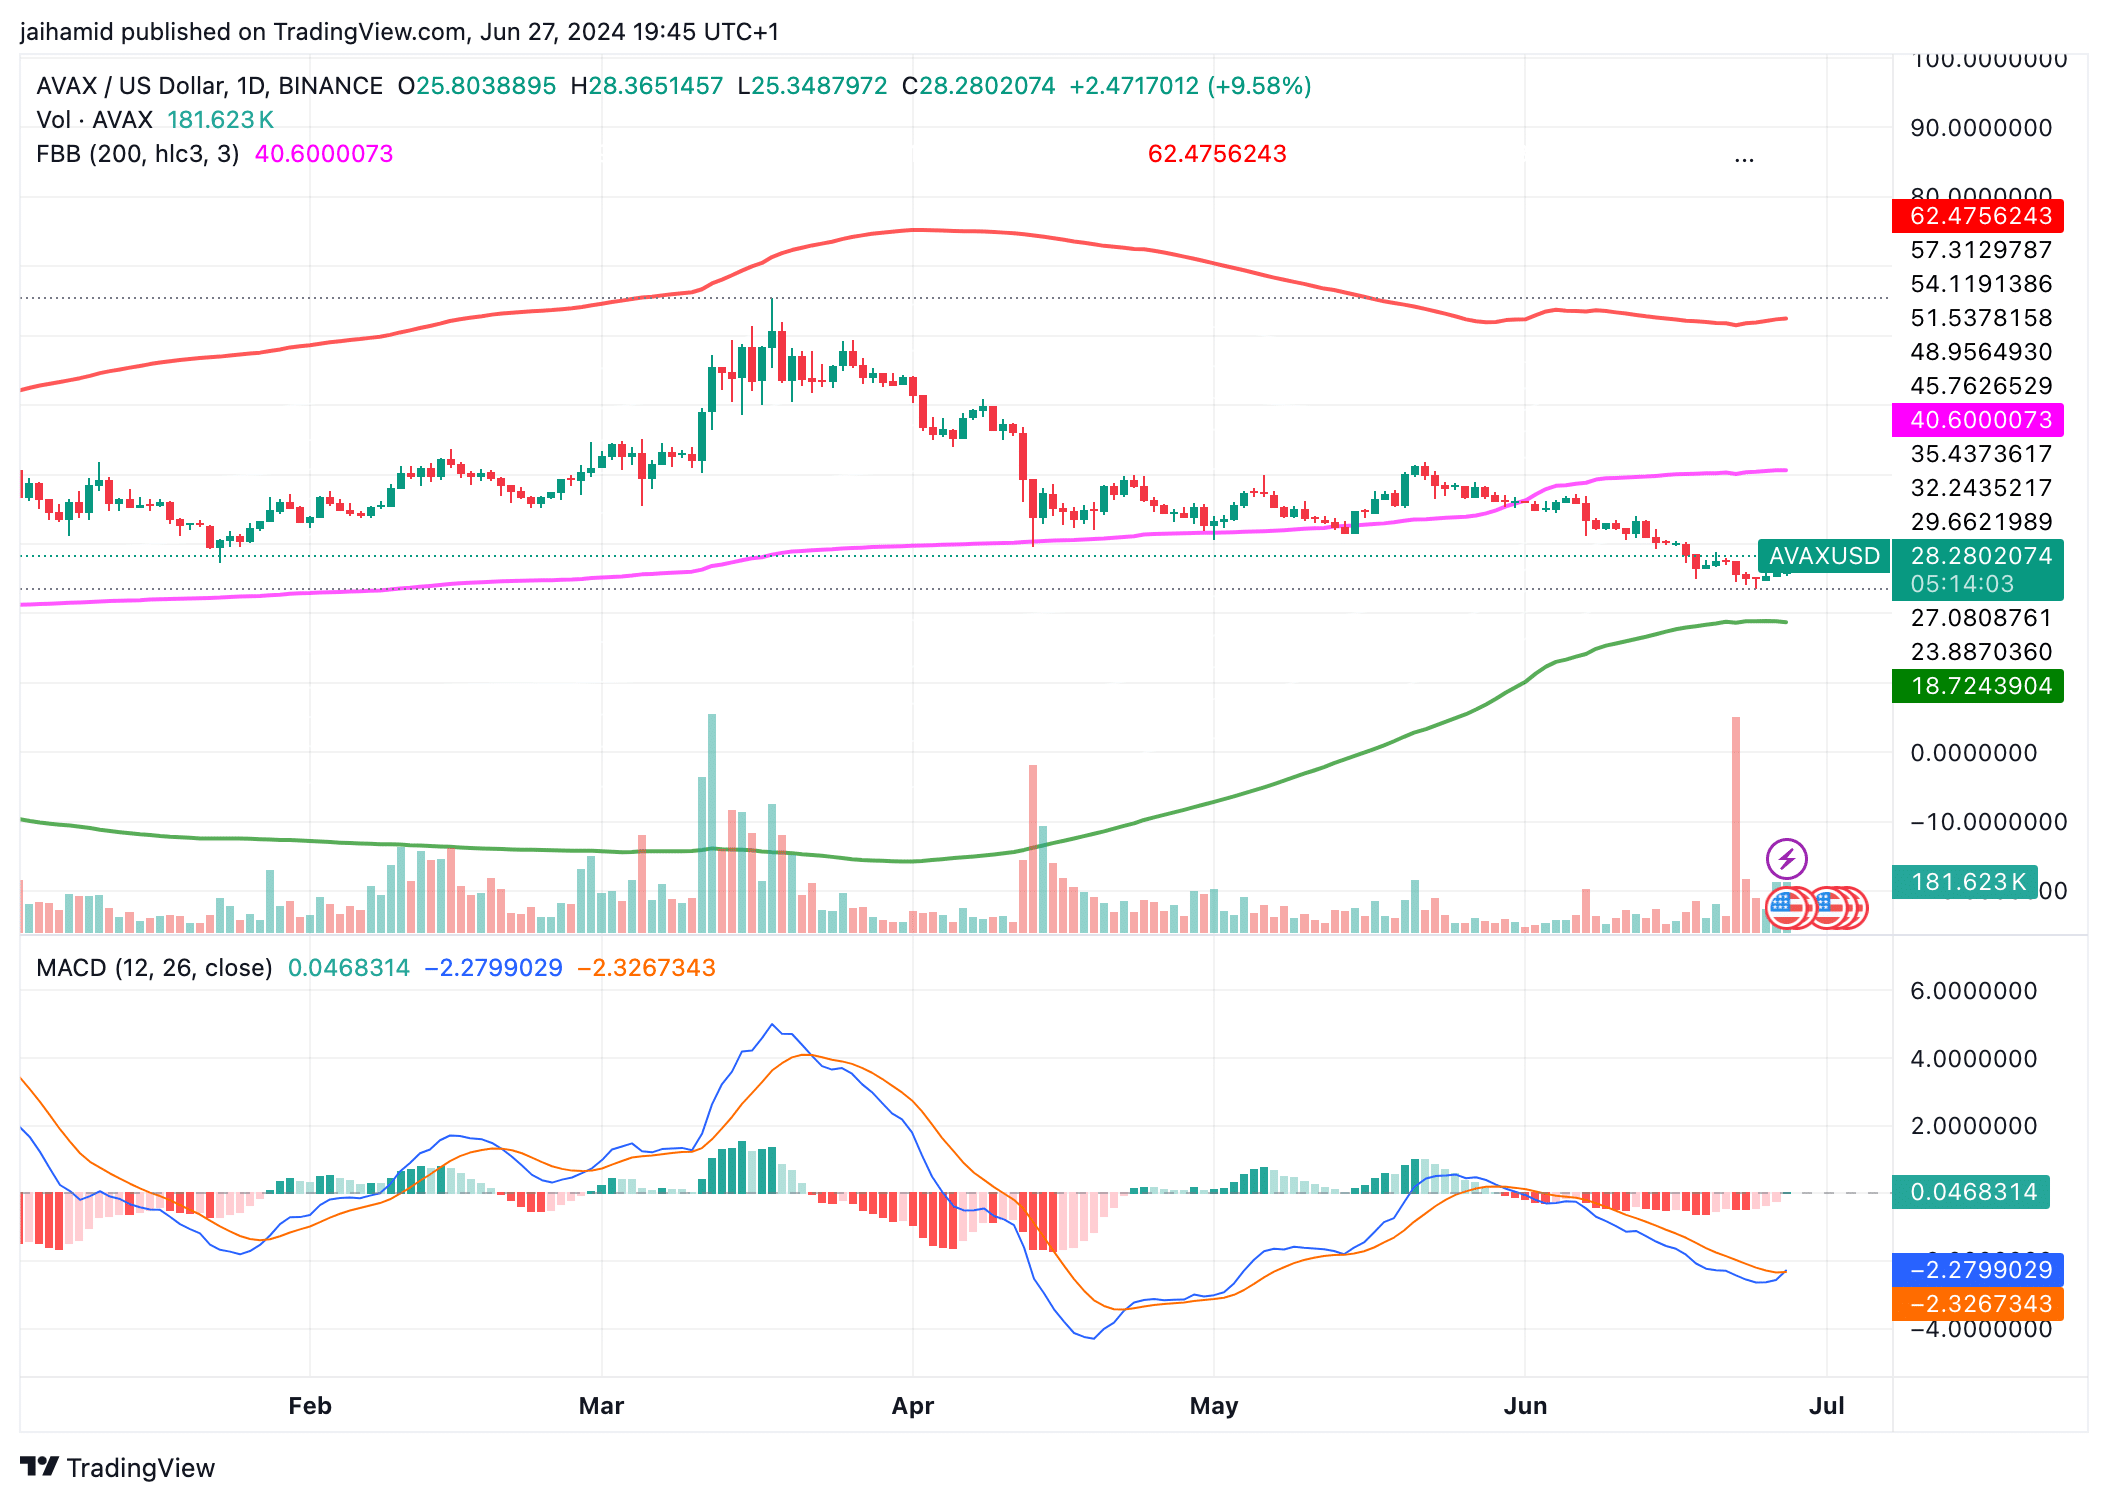
Source: TradingView
Realistic or not, here’s AVAX market cap in BTC’s terms
However, a convincing reversal would require the MACD line to cross above the signal line and the price to break above the middle red Bollinger Band.
Unfortunately, the current setup leans heavily towards bearishness, with potential for further declines.


