What Bitcoin trading in this consolidation phase holds for the future

Disclaimer: The findings of the following analysis are the sole opinions of the writer and should not be considered investment advice
Bitcoin Dominance had found a bottom at 39.5% in January and has slowly been rising. This indicated that the capital flow was directed toward Bitcoin and away from altcoins. Moreover, the USDT (Tether) Dominance has also fallen from 4.87% last week, to 4.28% at press time, which suggested that market participants were beginning to deploy their capital into crypto assets after sitting on the sidelines with Tether. A recent report on Bitcoin noted that a period of heightened volatility may be around the corner. What can we expect from the king of the crypto sphere on the price charts?
BTC- 1D
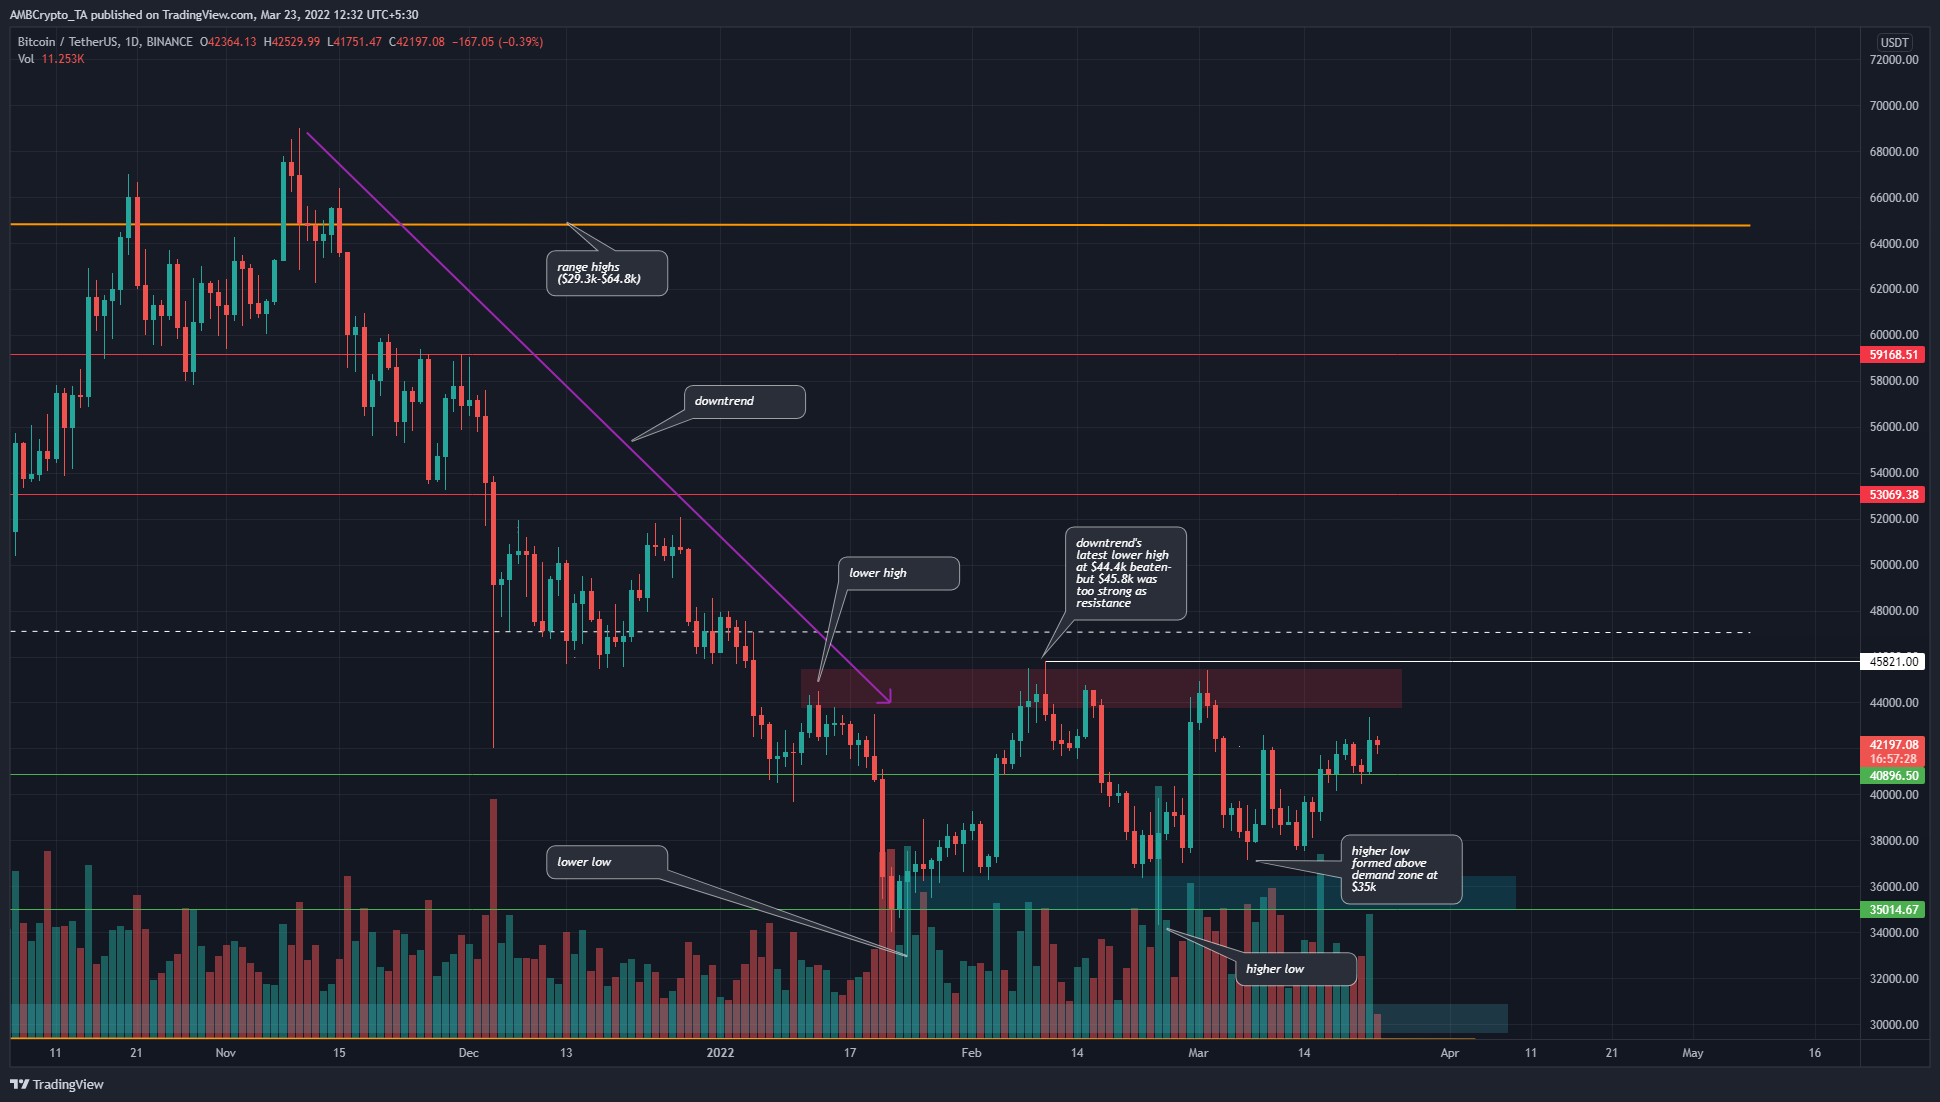
The downtrend of Bitcoin began when the $59.1k level was broken and tested as resistance, and this downtrend appeared to last till early February. However, in early February, Bitcoin rallied to $45.8k, a local high.
Crucially, this mark was higher than the most recent lower high of the BTC downtrend at $44.6k. At the same time, the price also registered higher lows. This meant that, at the very least, the downtrend had stalled.
The $45.8k zone represents a strong zone of supply, and all the way to the $52k, the chart is crowded with areas where sellers are expected to be strong. Therefore, while a longer-term bearish bias has weakened considerably, the bulls were not in the driving seat either.
Rationale
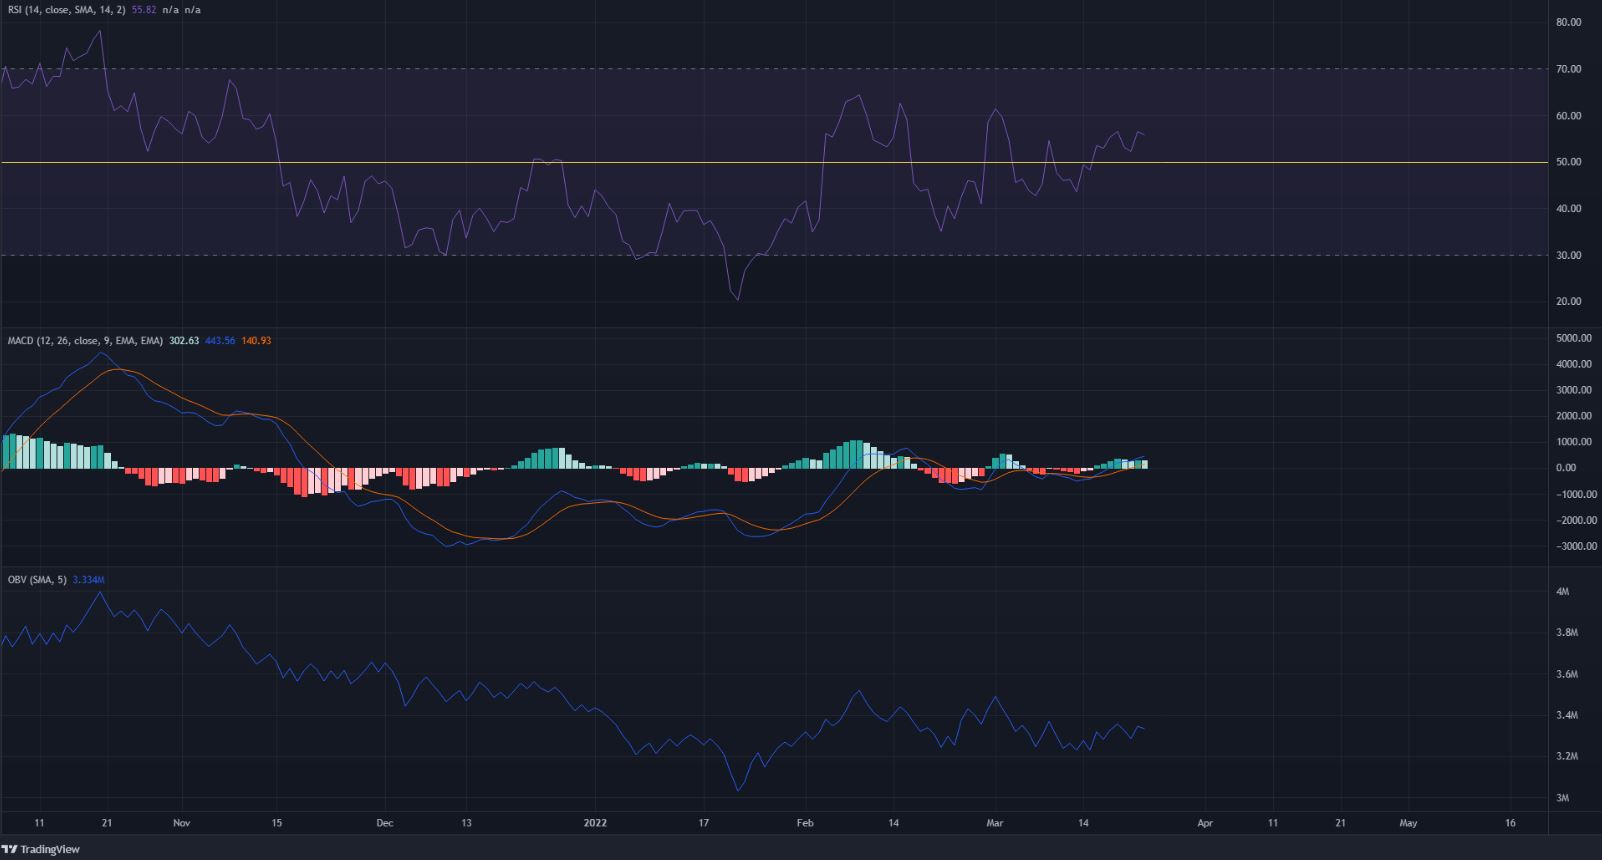
The indicators painted much the same picture for Bitcoin. The RSI had crossed over above the neutral 50 line, after nearly a month of struggle. The MACD also formed a bullish crossover and climbed above the zero line. Both of these indicators showed that the hold of the bulls on the market had weakened- but not necessarily that bullish momentum was strong.
The OBV went a step further in highlighting how, despite a break in market structure, the demand from buyers was simply not strong enough. The OBV has been on a downtrend since November- and has climbed somewhat since January (higher lows). Yet, this development was likely not enough to spark a new move to the upside.
Conclusion
The price of Bitcoin appeared to be consolidating, as buyers and sellers fought fiercely over each significant horizontal level. The $44k-$45k area was a strong band of resistance, with $48k as a resistance level as well. To the south, the $38k level and the $35k-$36.4k area could act as support.