What Chainlink’s [LINK] supply flows tell us about the bulls’ readiness

Chainlink’s network continues to enjoy robust user growth thanks to its strategic position as a Web3 oracle services provider. However, the aforementioned growth has so far failed to reflect on LINK’s performance.
LINK’s price action has been heavily bearish since Q4 2021, but its bearish momentum has fallen significantly since May. In fact, the bulls have been shy about taking over, judging by the limited upside.
LINK managed to push out of its wedge pattern during the first week of July. Even so, at press time, its price continued to deliver a lot of sideways action on the charts.
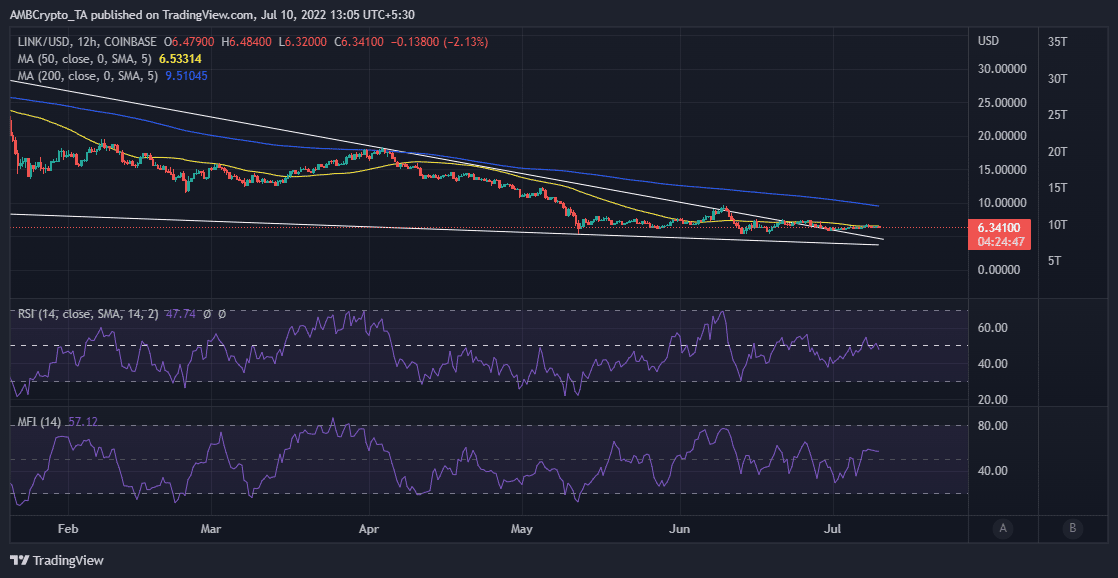
LINK was trading at $6.34, at press time, following a 2.11% drop over the last 24 hours. Its RSI has been hovering within the 50% range since 8 June. Furthermore, its MFI indicated a lack of directional momentum over the last 48 hours.
Struggling to find traction
LINK investors are currently going through a phase of uncertainty given dwindling activity. This, despite the lack of more downward pressure at its press time support level.
On-chain metrics revealed that active addresses have fallen significantly since the start of July. Active addresses dropped from 6,490 on 30 June to 1,971 by 9 July.
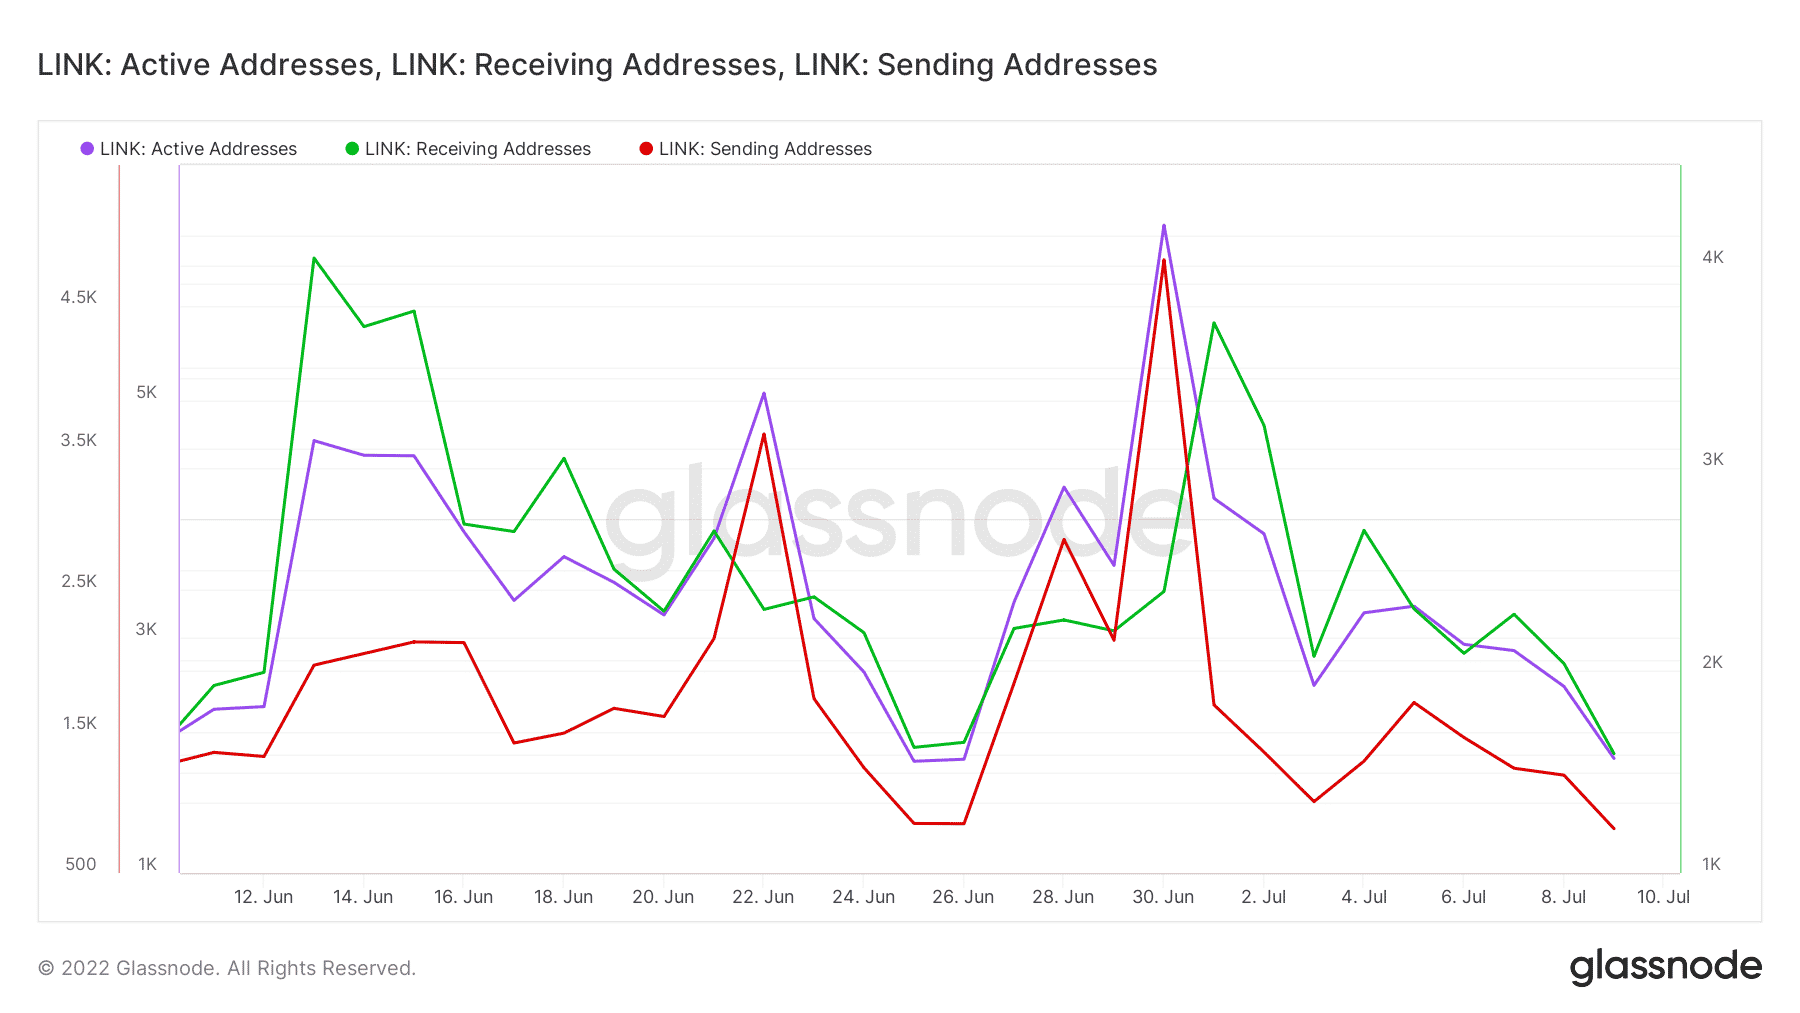
Receiving addresses dropped from 3,720 on 1 July to 1,590 on 9 July, while sending addresses dropped from 1,687 to 813 over the same period. This means that despite the lower price action, there are fewer addresses selling their LINK than those buying.
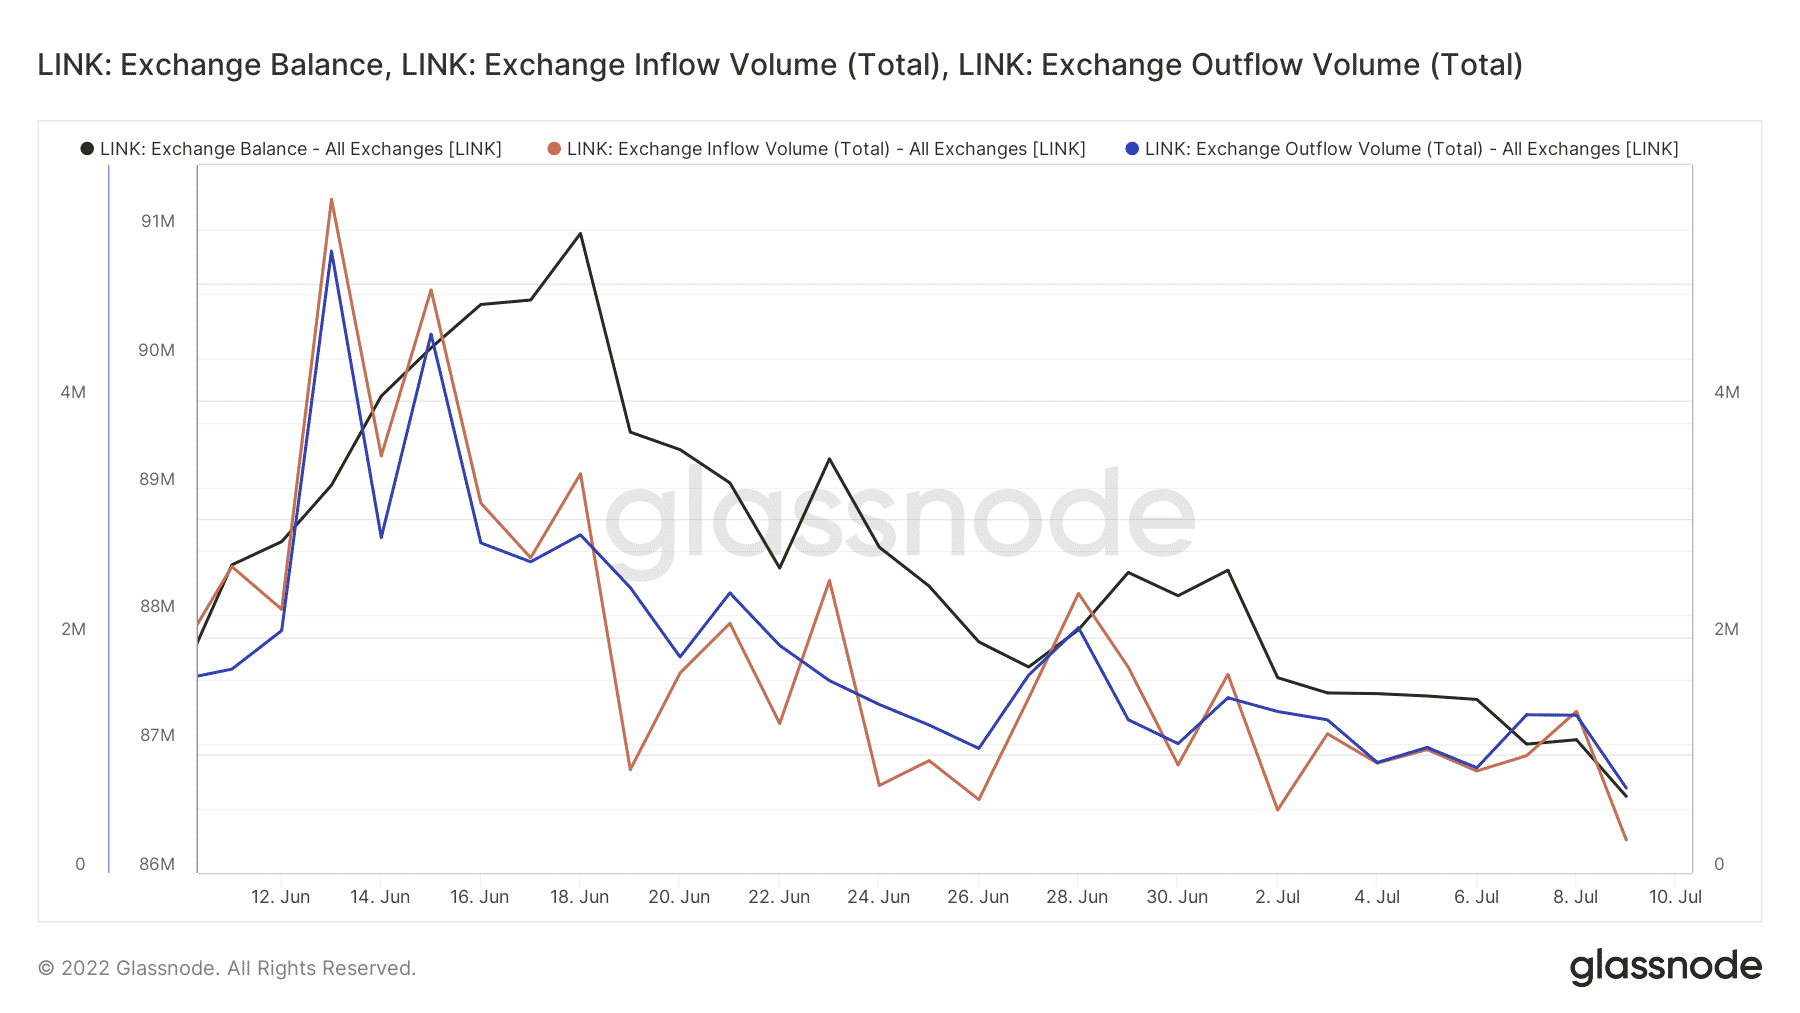
Exchange balances and flows revealed a similar outcome. Exchange balances have dropped significantly in the last 30 days. Exchange balances peaked at 90.96 million LINK coins to 86.59 million coins over the last four weeks.
Exchange outflows and inflows have also fallen significantly over the same period. On the plus side, exchange outflows (720,554 LINK on 9 July) outweighed exchange inflows (280,712 LINK on 9 July) by a significant margin.
LINK’s supply distribution by the balance of addresses on Santiment revealed that whales have been divided in the last few weeks. Addresses holding more than 10 million LINK slashed their holdings from 60.84% to 55.38% between 27 and 28 June.
Their balances, at press time, stood at 55.35%. Meanwhile, addresses with between 1 million and 10 million coins increased their holdings from 16.32% to 21.66% between 27 and 29 June. They controlled 21.38% of LINK’s total supply by 10 July.

Addresses holding between 100,000 and 1 million LINK trimmed their balances from 9.14% to 8.77% between 6 and 10 July.
Conclusion
These supply distribution metrics suggest reduced activity and more steady balances. These are also evidence of reduced exchange flows. This means LINK’s price action might extend its inactivity a while longer until investor confidence returns.


