What does Kaspa’s ‘latest ATH’ mean for KAS and its price action?
KAS has made a significant recovery, hiking by 44.03% over the past month.

- Kaspa’s Open Interest surged to hit an all-time high on the charts
- On the price front, KAS hiked by 44.03% in the last 30 days alone
Since hitting a low of $0.101 a month ago, Kaspa [KAS] has recorded a strong uptrend to hit a high of $0.179 on the charts.
This upward momentum has persisted over the last 24 hours. In fact, at the time of writing, Kaspa was trading at $0.171. This marked a 10.7% hike over the course of just 24 hours. Equally, the altcoin gained on the weekly and monthly charts too, appreciating by 4.69% and 44.03%, respectively.
And yet, KAS remains approximately 17.48% below its ATH of $0.2075.
With Kaspa finally finding some momentum on the charts, the question – Is Kaspa now on the verge of a sustained uptrend?
What does altcoin’s chart suggest?
According to AMBCrypto’s analysis, Kaspa, at press time, was at the end of a strong uptrend, one accompanied by bullish sentiment among investors.
For starters, we can see this upward momentum with a bullish crossover on the MACD. In the last 24 hours alone, the MACD line crossed over the Signal line, indicating the potential for bullish trend continuation.
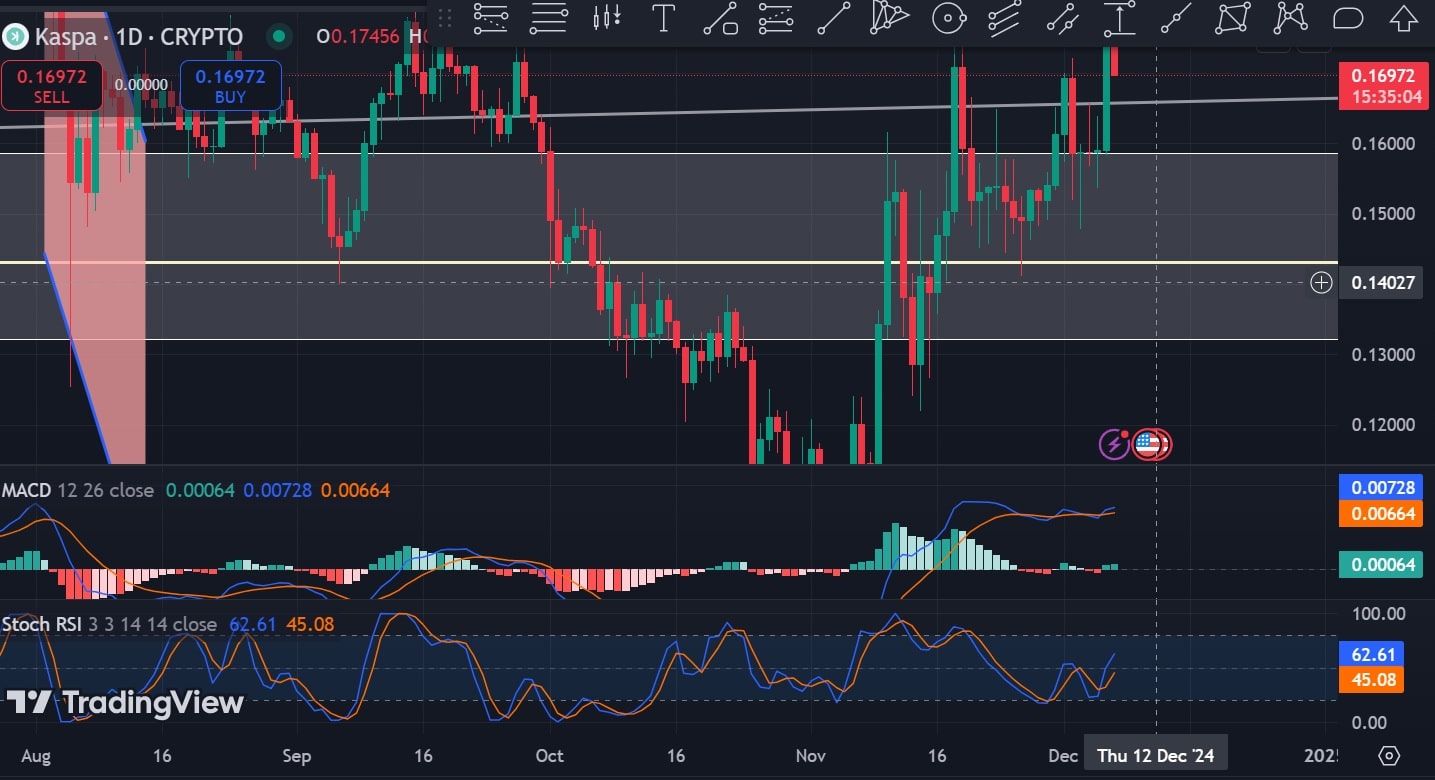
Equally, the Stochastic RSI made a bullish crossover a day ago, suggesting that buyers are now in control of the market.
A higher buying pressure usually results in low supply amidst rising demand, thus pushing the price up the charts.
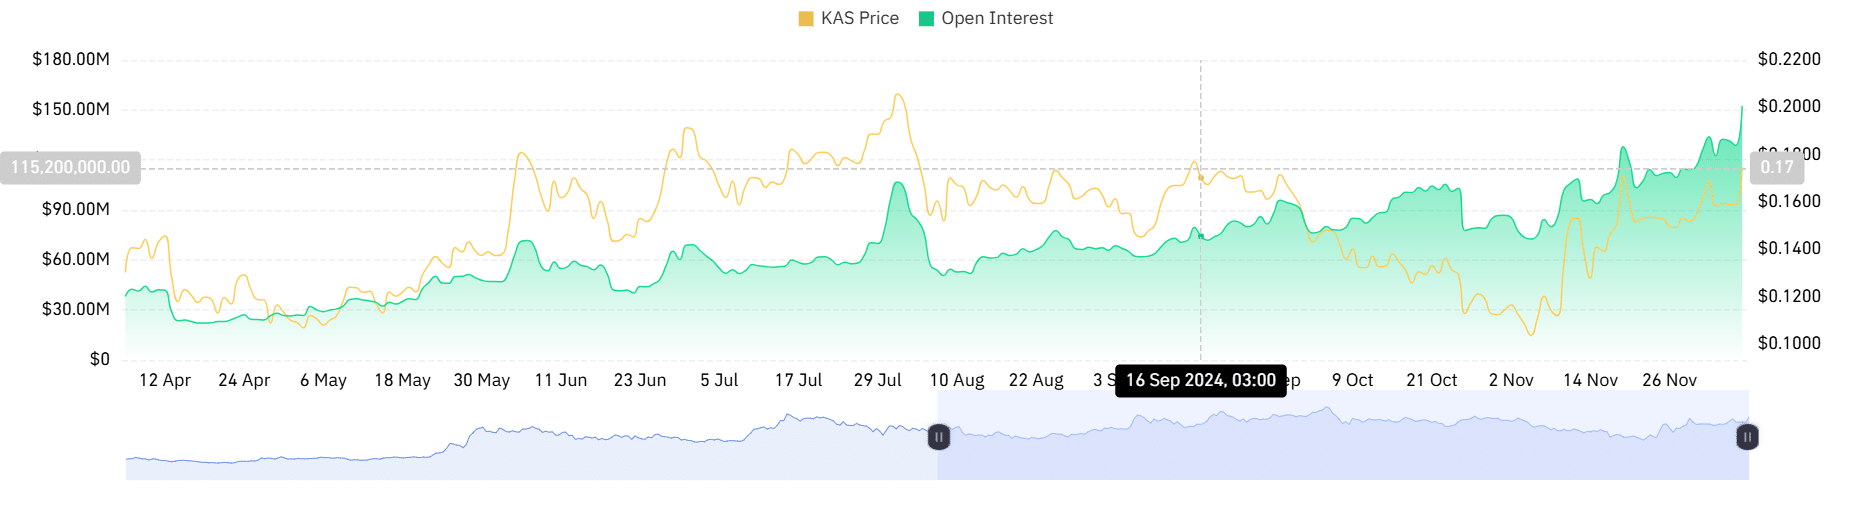
Additionally, this buying pressure can be further supplemented by the number of investors entering the market.
Consider this – Kaspa’s Futures Open Interest surged to hit a new all-time high of $152.5 million. When the Open Interest is such a massive inflow, it implies that investors are opening new positions anticipating further gains.
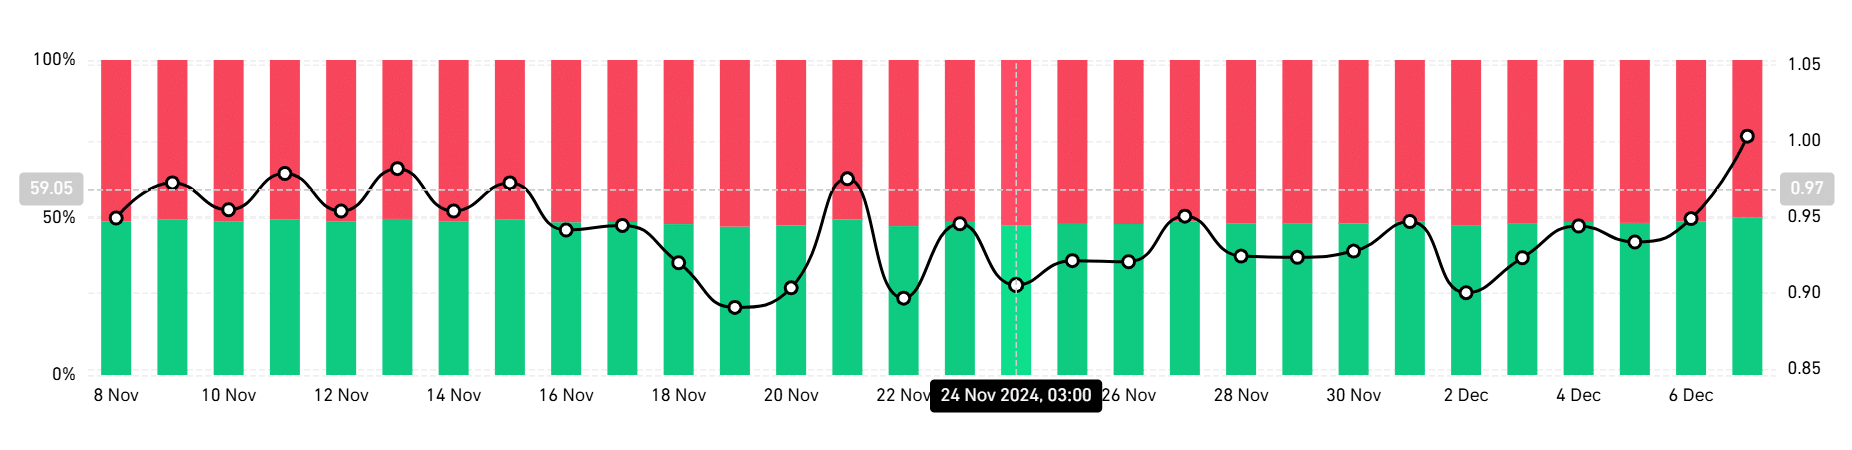
Finally, KAS’s long/short ratio revealed that investors have been taking long positions. With longs dominating the market, it would imply that investors are bullish and are betting on the price to climb.
With more longs, we can conclude that these new positions are mostly longs.
What next for KAS?
As can be observed from its price chart, Kaspa is currently in a bullish phase. With positive sentiment and greater investor favorability, KAS could see some more gains soon.
Therefore, if its current market conditions prevail, KAS will attempt to breach the $0.180 resistance level where it has faced multiple rejections. A breakout from here will see Kaspa hit $0.184 and move towards $0.19 for the first time since August.
Subsequently, if a market correction appears, the altcoin will find support at around $0.161.


