Ethereum Futures can tell you this about ETH prices in February
Ethereum’s futures monthly volume on Chicago Mercantile Exchange Group (CME Group) is at its highest in three years.

- Ethereum’s futures monthly volume rose to a three-year high on the Chicago Mercantile Exchange Group in January.
- Open interest on the exchange also registered a new high in January.
- Key volatility markers showed that the coin remained prone to price swings.
Ethereum’s [ETH] futures monthly volume on derivatives marketplace Chicago Mercantile Exchange Group (CME Group) closed January at a 26-month high, data from The Block’s data dashboard showed.
CME Group is one of the world’s largest derivatives marketplaces, with over 120,000 active users spread across 60 countries. The trading activity on the exchange is noteworthy as it enjoys patronage from many institutional investors, one of which is BlackRock.
According to data from The Block, ETH futures trading volume on the exchange totaled $24.34 billion in January, marking a 16% surge from December’s $21.13 billion.
Apart from the trading volume that climbed to a multi-month high on the exchange, ETH’s open interest also registered a significant uptick in January. Per The Block’s data, ETH’s open interest on CME Group in January was $732 million, its highest since January 2022.

While ETH’s price rose briefly post-ETF approval in January, it spent the rest of the month declining and lingering within a narrow range. At press time, the coin exchanged hands at $2317, facing resistance at the $2370 price level.
Despite its sideways movement for most of January, ETH’s futures open interest on one of the largest derivatives exchanges climbed by 11% during that period.
Although the month saw some profit-taking activity, funding rates across exchanges remained positive. This suggested that despite ETH’s price consolidation within a narrow range, investors continued to open trade positions in favor of a price rally.
Risk of price swings on a wider time frame
An assessment of ETH’s price action on a weekly chart revealed the possibility of a price swing.
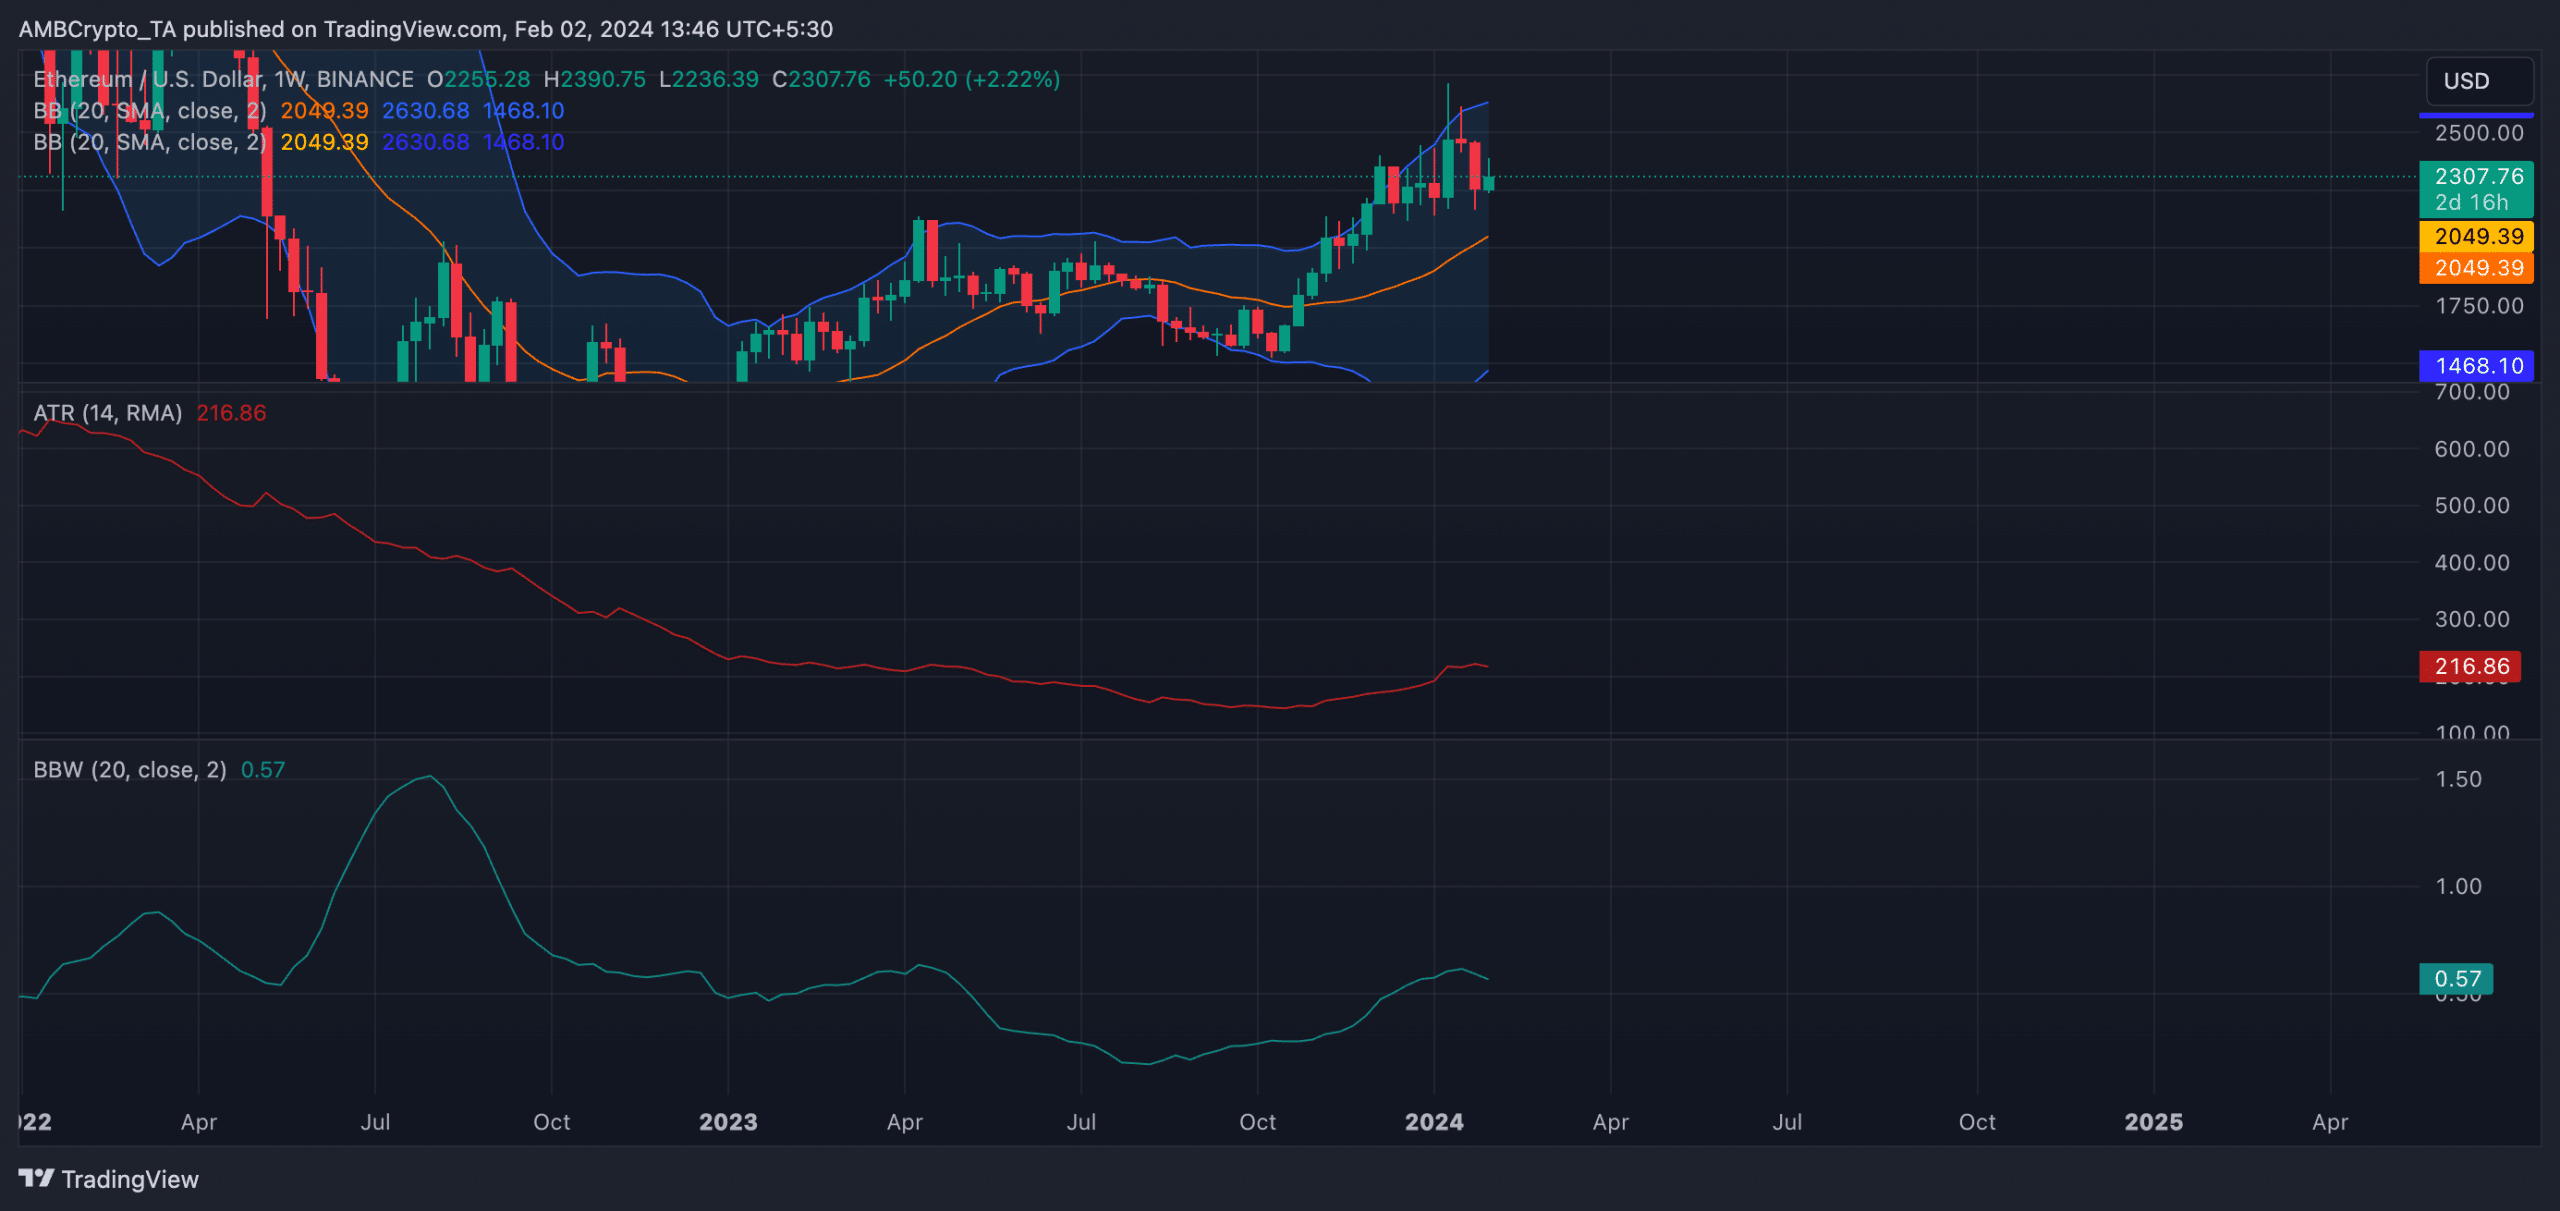
For example, the gap between the upper and lower bands of the coin’s Bollinger Bands (BB) indicator has progressively widened since the year began.
How much are 1,10,100 ETHs worth today?
When this gap widens in this manner, it signals an increase in price volatility. Confirming the volatile nature of ETH’s market, the value of the coin’s Bollinger Bandwidth has also risen since the year started.
Further, the coin’s Average True Range -which measures market volatility by calculating the average range between high and low prices over a specified number of periods – has climbed by 23% since the beginning of the year.


