What Monero traders should be wary of before these levels are toppled

Disclaimer: The findings of the following analysis are the sole opinions of the writer and should not be taken as investment advice
Buoyed by Bitcoin’s resurgence to $44k, the altcoin market was witnessing some recovery after recent sell-offs. Monero, which historically shares a high correlation with the king coin, bounced back from its support level and observed a much-needed rally. However, some important price levels have to be flipped to turn more heads.
The daily 200-SMA ran bearish and the market, at press time, was still more open to short-positions.
At the time of writing, XMR was trading at $248.4, up by 9.5% over the last 24 hours.
Monero 4-hour Chart
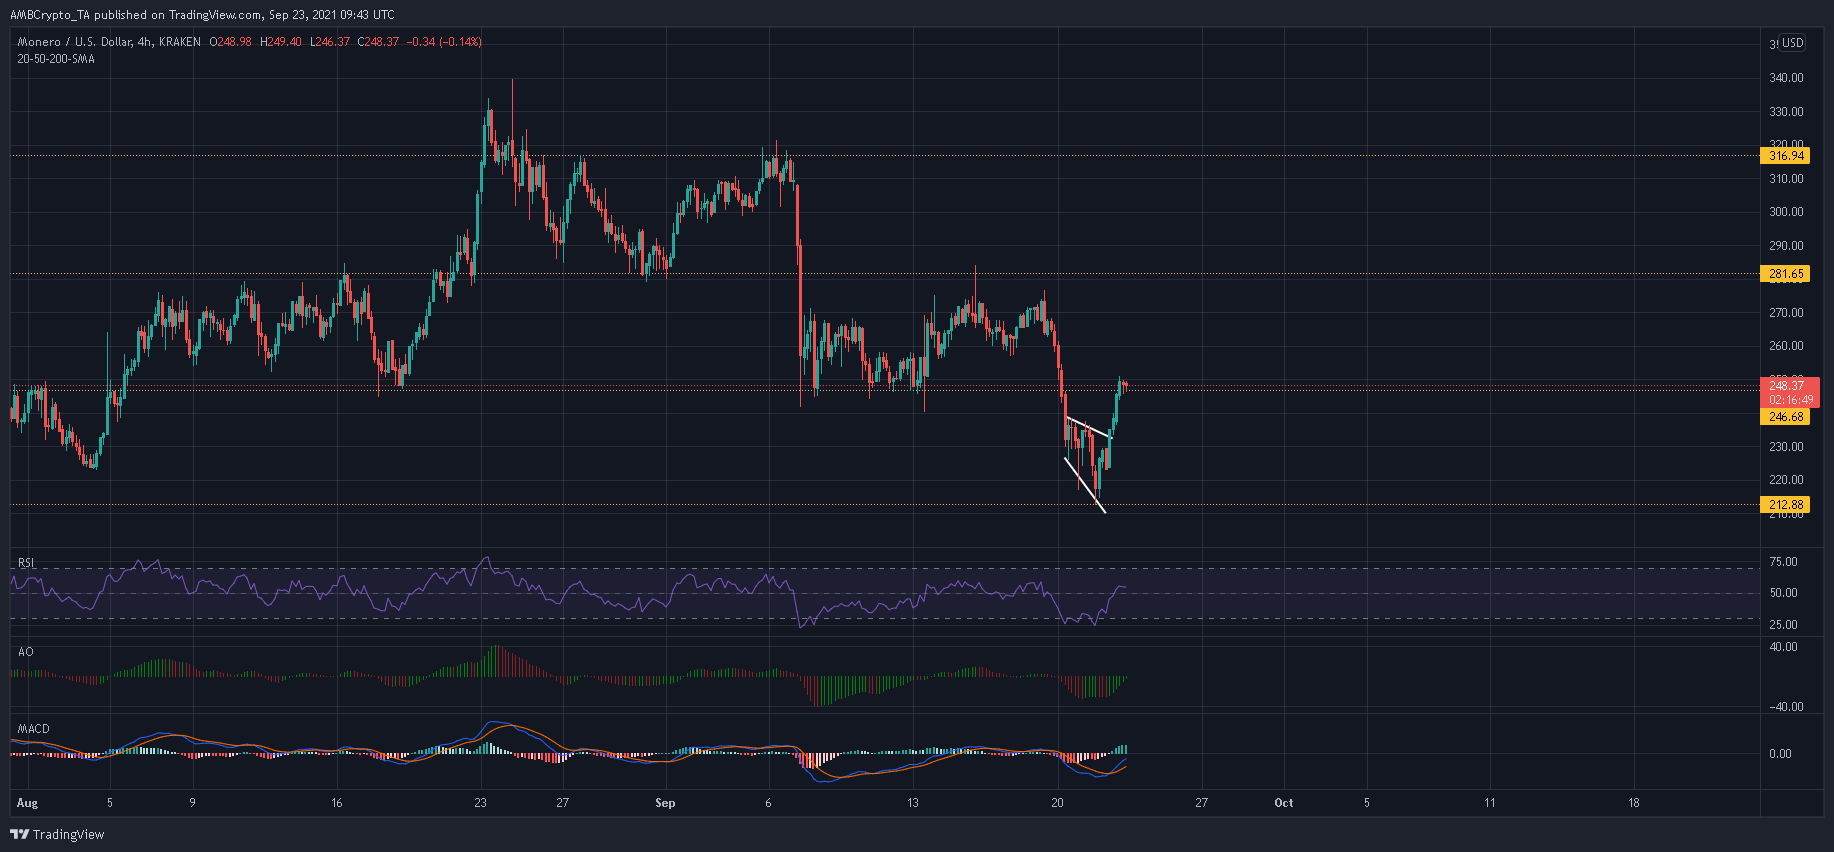
Monero was off to a decent start in the month of September. The altcoin shrugged past its late-August lows and saw a 15% surge to a 2-day high of $317. Since then, sellers seemed to have flipped the script. A relentless assault dragged XMR by over 30% as support levels of $281.6 and $247 succumbed to selling pressure.
From there, a broadening wedge breakout saw XMR regain some of its lost ground. However, sellers can be expected to keep gains under control.
This will be expected for a number of reasons. For one, the candles were still under their daily 200-SMA (not shown) – A reading which tends to attract short-sellers in the market. Secondly, XMR, at press time, was yet to decisively close above the $247-mark which functioned as resistance. In order to scale to new heights, XMR needs to overtake price ceilings of $247 and then, $281.6.
Reasoning
Since XMR was within a downtrend, buyers usually exit their positions once the RSI climbs to between 55-60. This allows traders to bag some profits before the next wave of selling pressure hits the market. If so, the next few sessions would see XMR slip to lower levels on the chart.
However, the MACD and AO were slightly more optimistic and looked to climb above their respective half-lines. In either case, the two indicators need to advance further before a bullish outcome can be expected.
Conclusion
XMR’s rally could be limited to $247-$250 before profit-taking is observed. The indicators were yet to assume bullish positions. Ergo, an extended rally seems unlikely.
When the next drawdown is initiated, expect XMR to revisit the $230-level. A more severe sell-off could even drag the price back to $212.9.


