What Solana needs to break the $160 resistance and trigger a rally
Solana’s strong market interest could push it past key resistance, setting off a rally.
- Solana nears key resistance at $160.70 with strong volume backing its momentum.
- Liquidation data hints at a potential short squeeze, boosting bullish pressure.
Solana [SOL] has experienced an upward surge, trading at $151.10, which marks a 3.54% increase in value at press time. As the token approaches critical resistance levels, the question remains whether SOL can sustain this upward momentum and ignite a broader rally.
Price action: Will SOL break key levels?
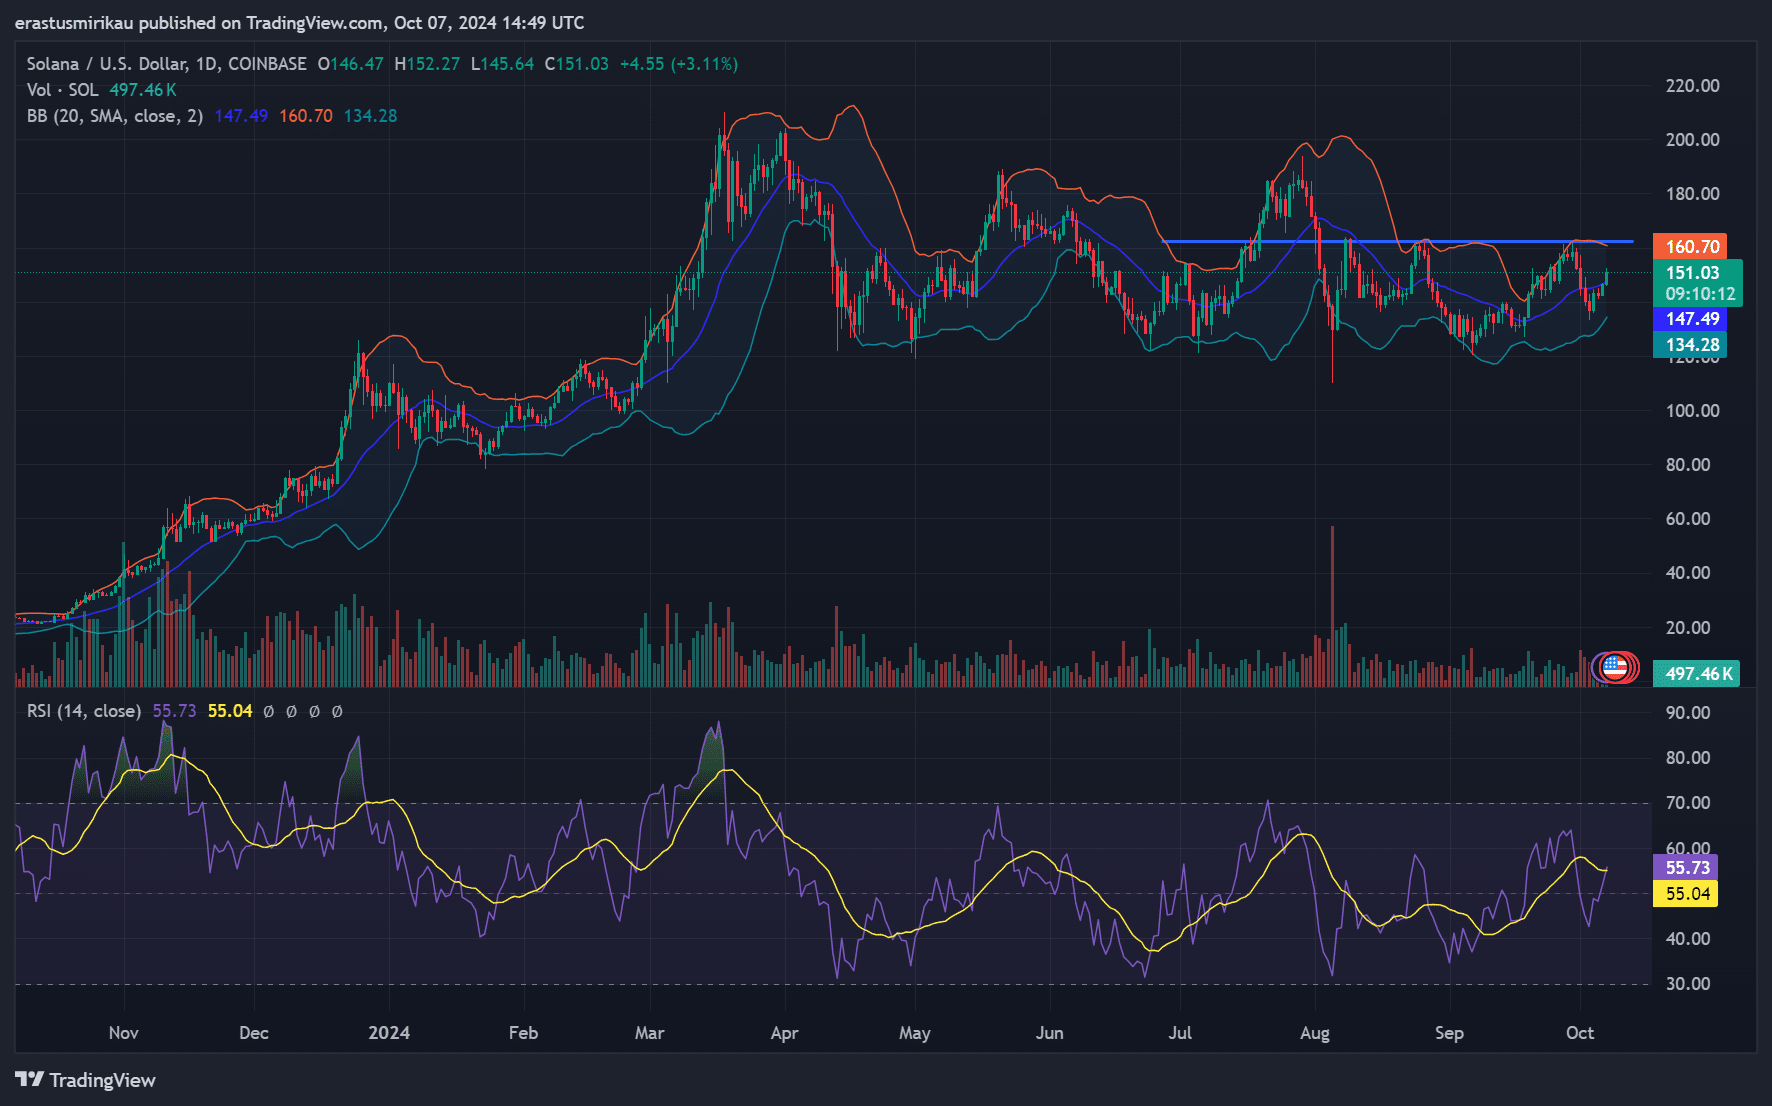
Solana’s price is pushing toward significant resistance at $160.70, with support holding firmly at $147.49. Solana is trading near the upper Bollinger Band, signaling potential for further gains.
Moreover, the Relative Strength Index (RSI) stands at 55.04, indicated that the market is still in a healthy position without being overbought.
Therefore, if Solana can breach the $160.70 resistance, it may open the door for more upward movement. However, failure to break this level could lead to consolidation or even a pullback.
SOL volume surge: A sign of momentum?
The recent 127.64% spike in trading volume is a crucial development for Solana. Increased volume often signals strong market interest, which can propel prices higher. Consequently, this surge in activity may help SOL overcome its resistance.
However, traders should be cautious, as high volume alone doesn’t always guarantee sustained price movement without breaching key levels.
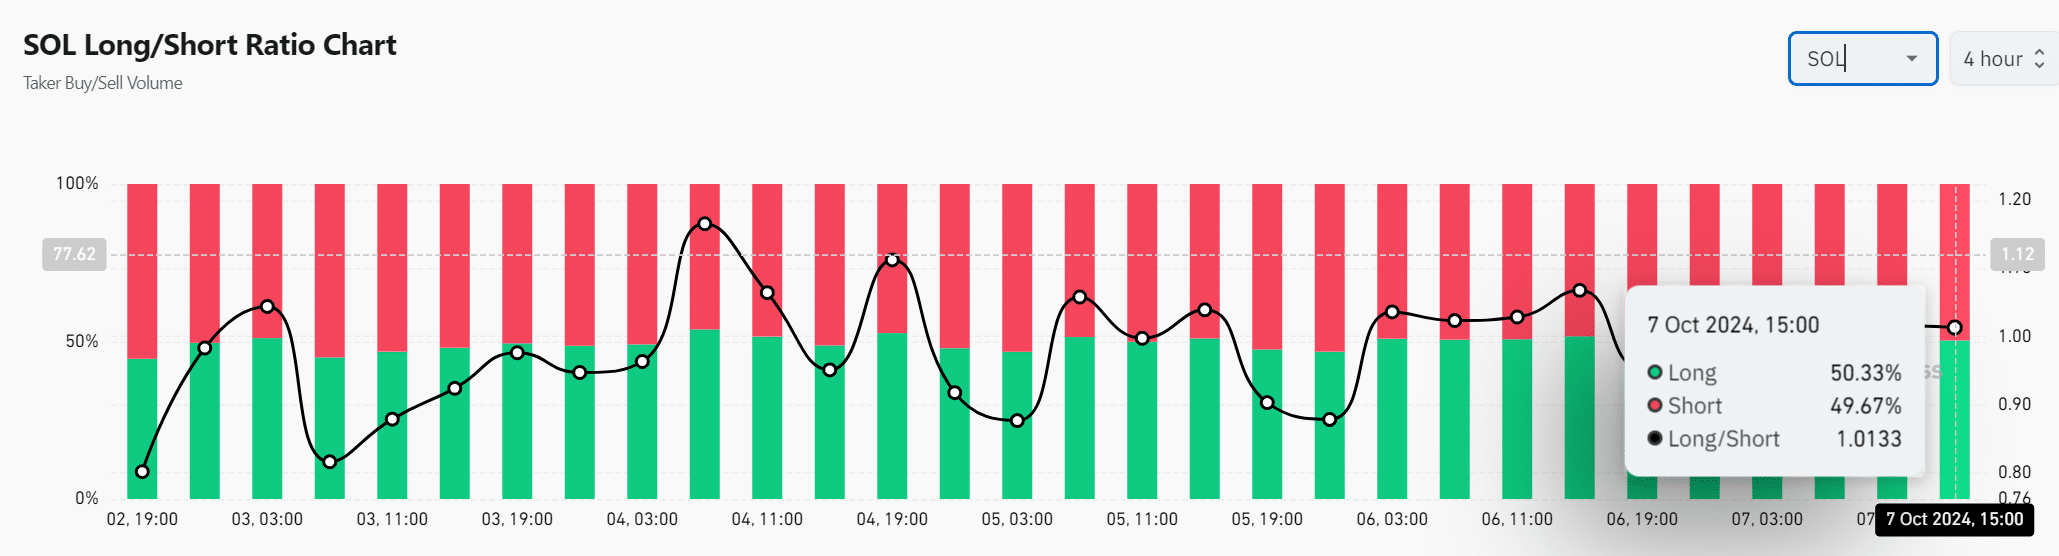
Long/short ratio: What are traders thinking?
Solana’s long/short ratio currently stands at 50.33% long and 49.67% short, indicating that traders are almost evenly split. However, the slight preference toward long positions shows a marginally bullish sentiment.
As Solana approaches resistance, this ratio could shift dramatically, especially if the price breaks higher, which could attract more buyers into the market.
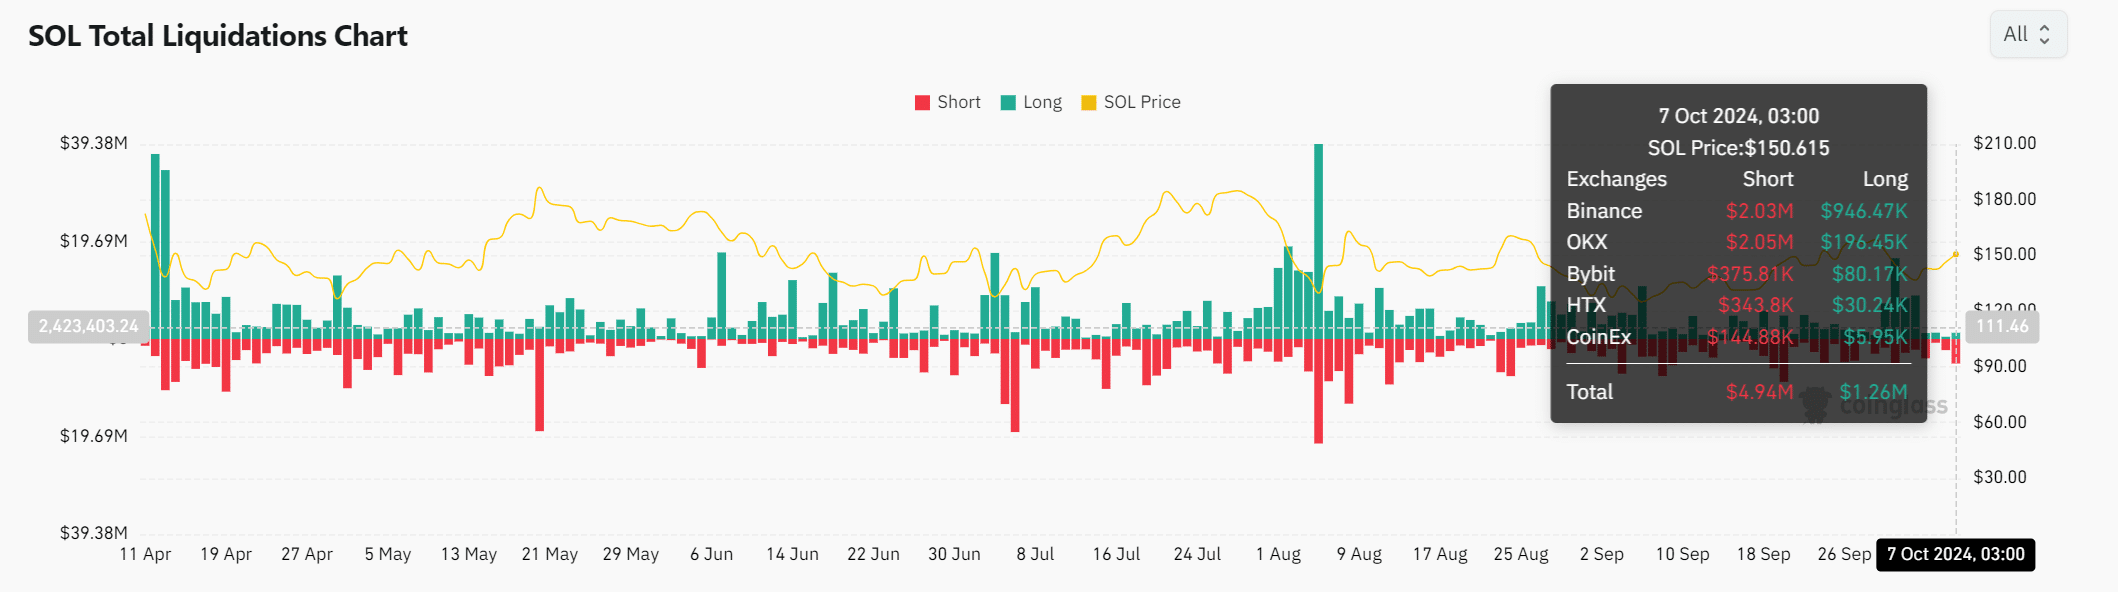
Liquidations: Can shorts get squeezed?
Liquidation data shows that $4.94 million in short positions have been liquidated, compared to $1.26 million in longs. This imbalance could fuel further upward momentum if short positions continue to be squeezed.
Consequently, if Solana’s price keeps climbing, it could force more shorts out of the market, adding more buying pressure.
Read Solana’s [SOL] Price Prediction 2024–2025
Conclusively, while Solana is showing strong bullish signs, it must decisively break through the $160.70 resistance to trigger a more substantial rally.
Therefore, traders should keep an eye on volume and liquidation data to gauge the likelihood of this breakout.