What does the future of Bitcoin depend on

- Investors holding 1,000-10,000 BTC and US institutional holders declined in recent months.
- BTC’s price remained below SMA as the bear trend persisted.
Bitcoin’s [BTC] price has been crawling at a snail’s pace, and the dominant direction remained bearish over an extended period. Nevertheless, a potential surge towards a bullish trend could potentially materialize, but it hinges on the actions of two distinct groups of holders, as highlighted in a recent report by CryptoQuant.
Read Bitcoin’s [BTC] Price Prediction 2023-24
Bitcoin holders stall the bull trend
A recent report by CryptoQuant suggested that the current Bitcoin trend could potentially transition into a bullish phase, contingent upon the upturn of two key metrics.
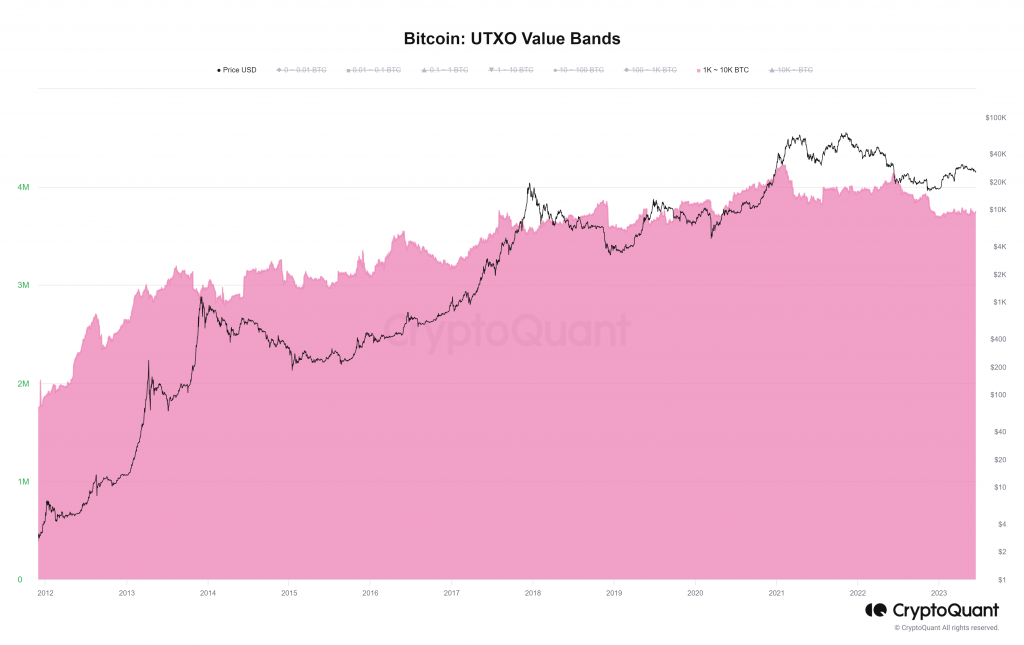
The first metric, known as the UTXO value bands, indicated a decrease in BTC holdings for certain groups of investors. These bands provide insights into the distribution of BTC holdings among different categories.
Historically, BTC prices have surged when large investors, often called whales, have accumulated substantial amounts of BTC.
Notably, the rise in the 1,000–10,000 BTC holding group has significantly triggered price increases. However, the latest data reveals a deviation from the previous pattern, as the quantity of BTC held by this group has not been increasing as of this writing.
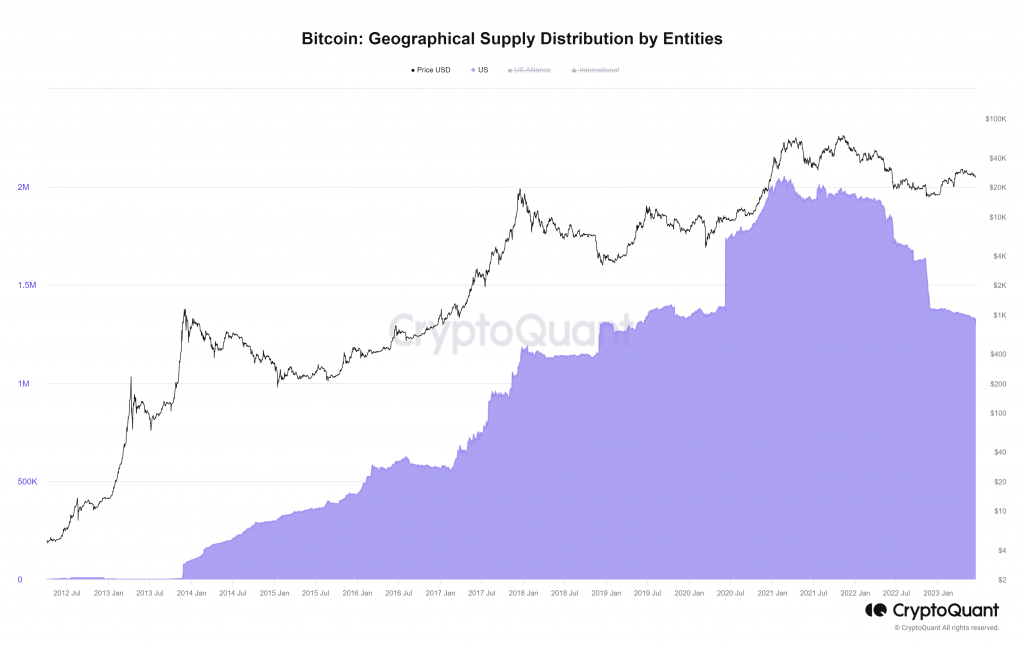
Furthermore, another metric, the Geographical Supply Distribution by Entities, sheds light on the holdings of Bitcoin by institutions in the United States.
Since April 2021, there has been a decline in BTC holdings among US institutions. Interestingly, this decrease persists despite the 100% rise in BTC prices this year, implying a lack of capital inflow from US institutions.
Bitcoin’s poor run continues
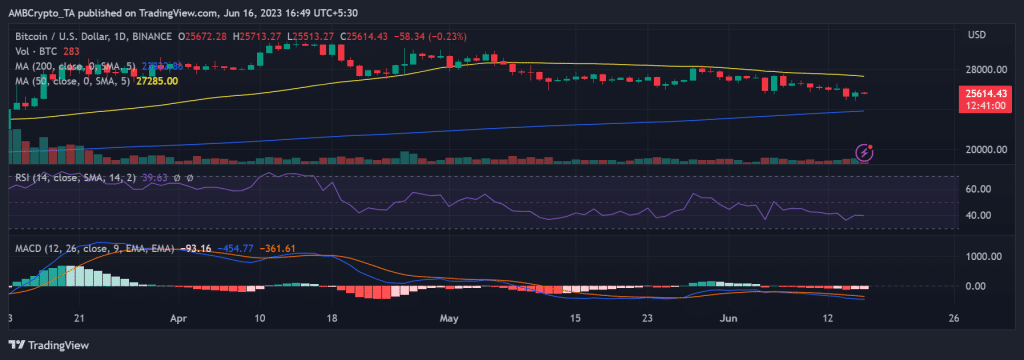
Examining the daily timeframe chart of Bitcoin indicated that the press time downtrend would continue. As of this writing, Bitcoin was trading at approximately $25,600, experiencing a marginal loss of less than 1%.
The price had descended below its short Moving Average (yellow line), which acted as a resistance level at around $27,000.
Additionally, the Relative Strength Index (RSI) indicated a persistent bearish trend. The RSI stood at 40, indicating a move away from the oversold zone but still maintaining a strong bearish momentum.
How much are 1,10,100 BTCs worth today?
MVRV presents mixed opportunities
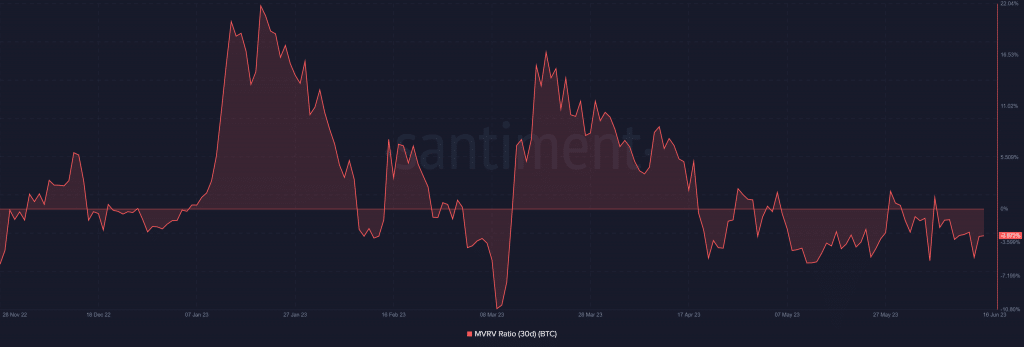
Following a period of profitability observed in March and April, Bitcoin holders have encountered a phase of undervaluation concerning their holdings. This is reflected in the 30-day BTC Market Value to Realized Value (MVRV) ratio, which indicated that the asset was undervalued.
As of this writing, the MVRV ratio stood at -2.87%, signifying the extent of loss experienced by BTC holders. However, this metric also suggested that there existed an opportunity for accumulation and the potential for a subsequent price increase.


