What Tron’s rising user base means for TRX prices

- Tron’s network activity remained high in the last 30 days.
- The token’s price dropped by 3% in the last seven days.
Tron [TRX] has once again reached a new milestone that reflects the rise in the blockchain’s adoption and popularity. However, while the blockchain’s popularity increased across the globe, its price action didn’t follow a similar trend.
Will TRX’s high network activity translate into a price hike in the coming days?
Tron’s adoption is rising
TRONSCAN, a popular X handle that posts updates related to the blockchain’s ecosystem, recently posted a tweet highlighting the blockchain’s latest achievement.
As per the tweet, Tron’s total addresses just exceeded 245 million. This massive figure represents the hike in adoption of the blockchain and its usage.
Since the blockchain reached a new milestone, AMBCrypto then checked Artemis’ data to find out more about Tron’s network activity.
As per our analysis, Tron’s network activity remained stable, which was evident from its relatively high daily active addresses throughout the month. Thanks to that, the blockchain’s daily transactions also remained high in the past 30 days.
A similar situation was also observed in terms of captured value. Both the blockchain’s fees and revenue were stable last month. Tron’s performance in the DeFi space was also optimistic, as its TVL gained upward momentum.
TRX remains bearish
While the blockchain’s network activity was robust, its native token’s price action remained under bears’ influence last week.
According to CoinMarketCap’s data, TRX was down by more than 3% in the last seven days. At the time of writing, TRX was trading at $0.1341 with a market capitalization of over $11.6 billion, making it the 11th largest crypto.
Despite the recent price drop, over 97% of TRX investors remained in profit, as per IntoTheBlock’s data.
Our analysis of Coinglass’s data revealed a bullish signal. Tron’s open interest declined in the last few days while its price plummeted. Whenever the metric drops, it hints that the chances of a trend reversal are high.
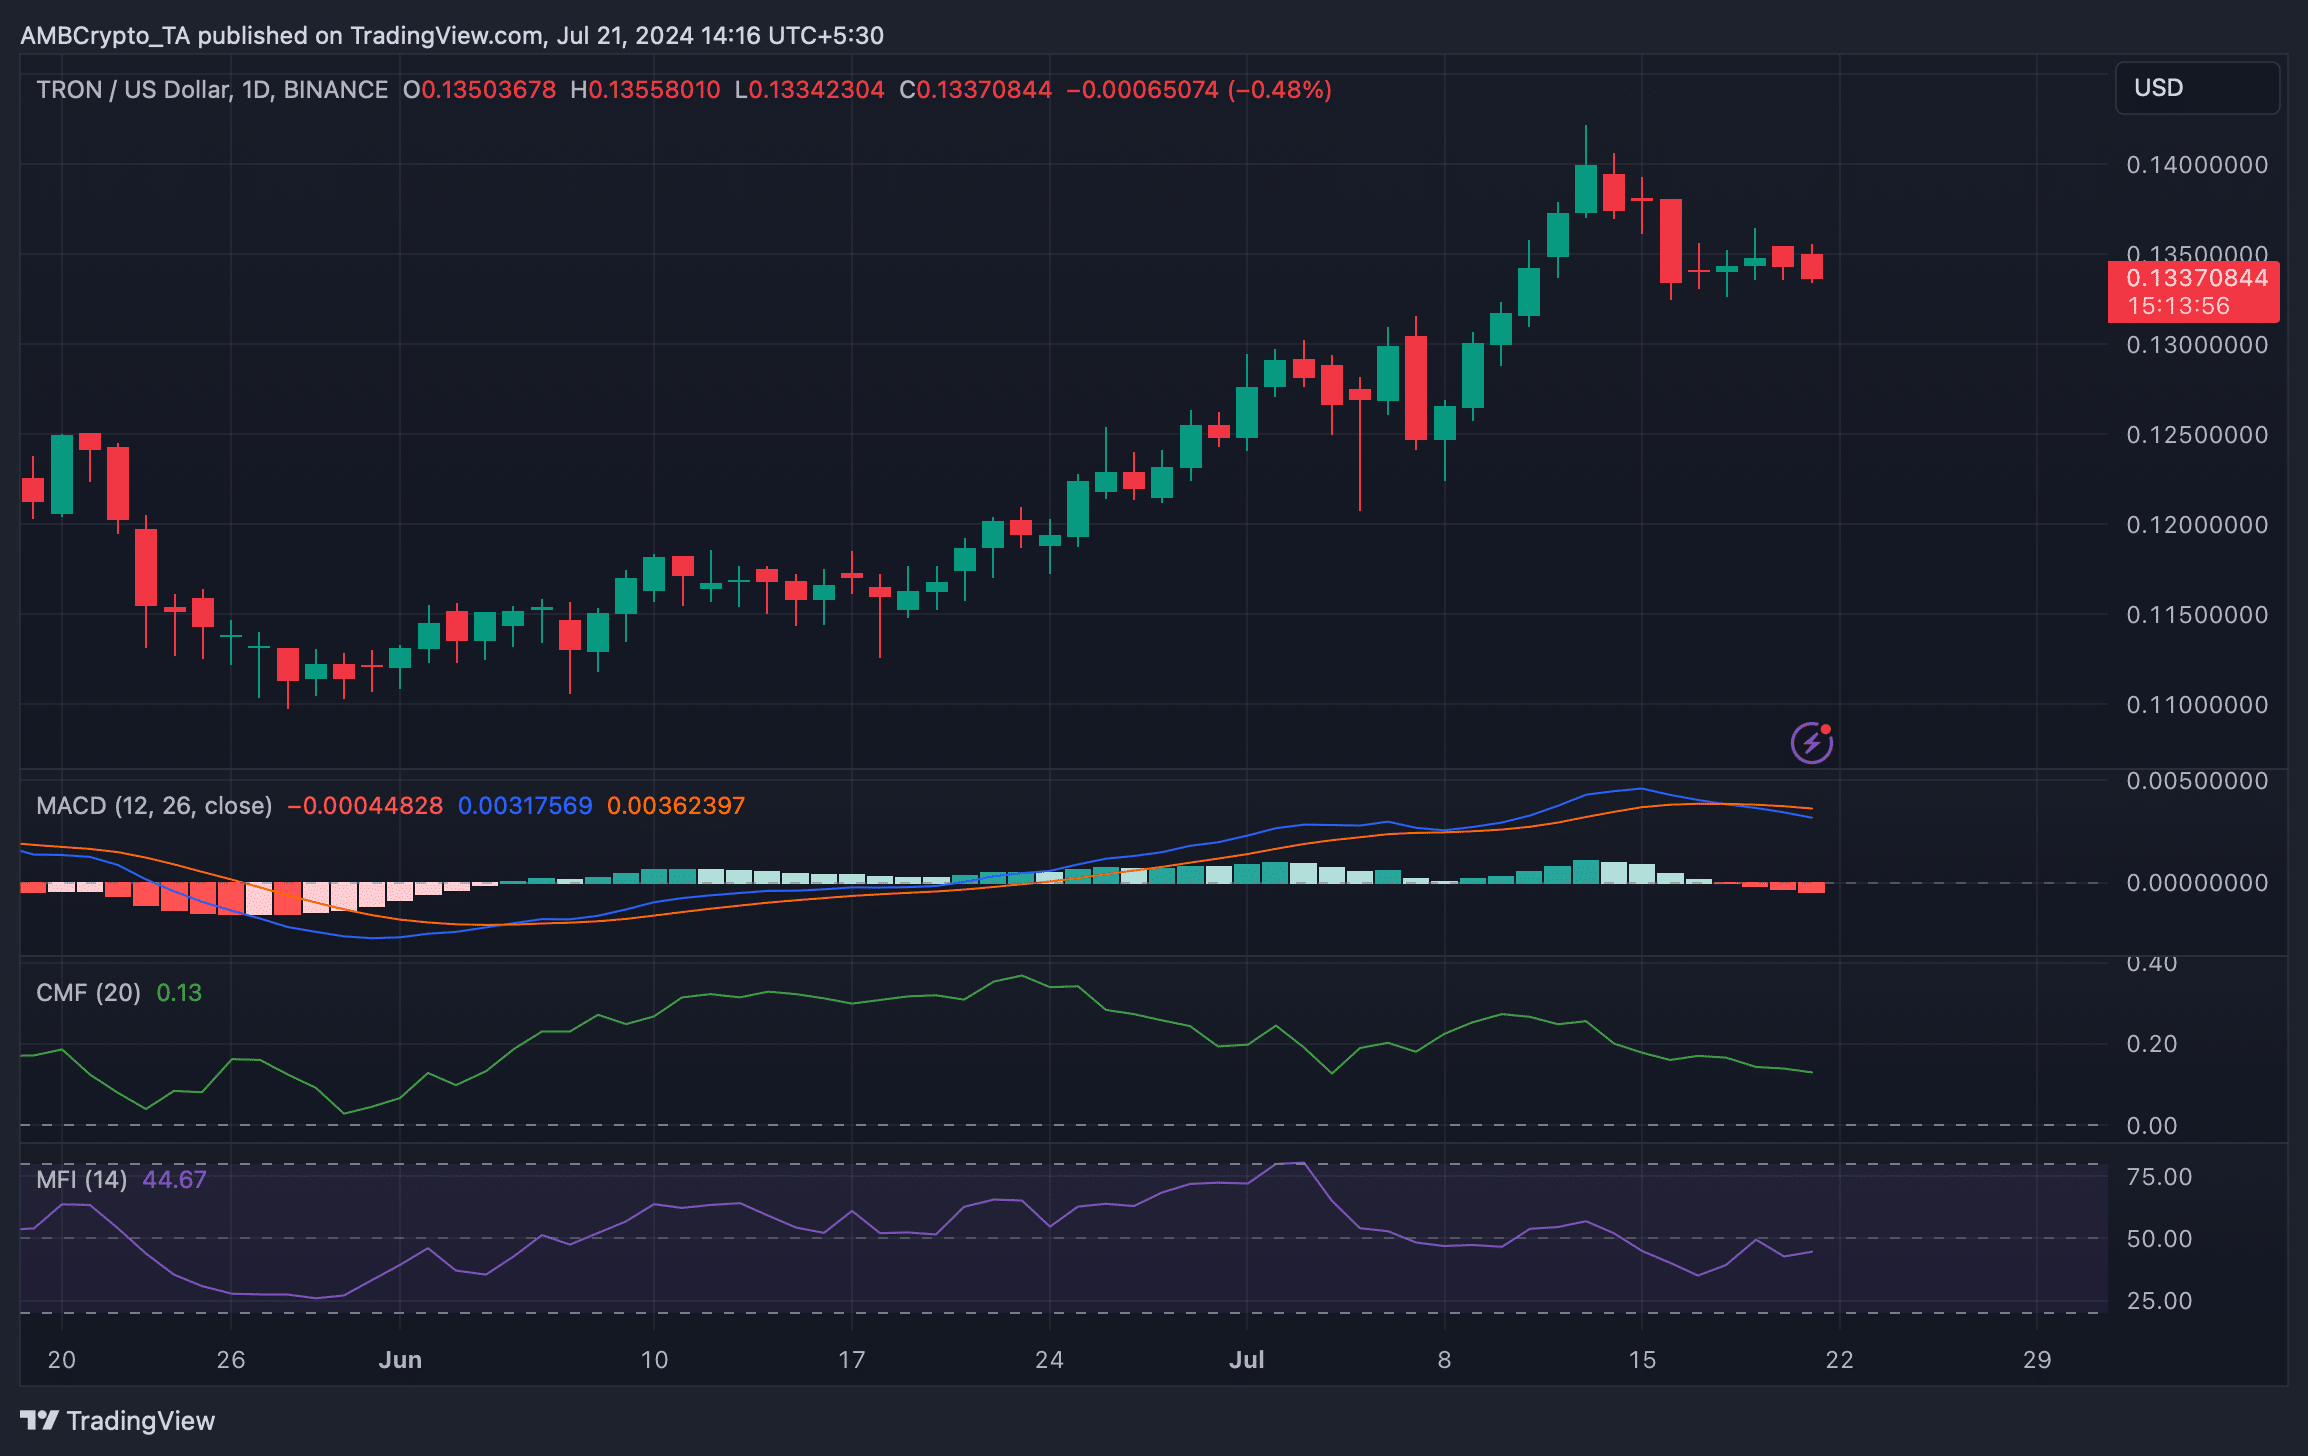
We then checked TRX’s daily chart to see whether indicators suggested a trend reversal. We found that the technical indicator MACD displayed a bearish crossover.
Tron’s Chaikin Money Flow (CMF) also registered a downtick, suggesting a continued price drop in the coming days. Nonetheless, the Money Flow Index (MFI) remained somewhat bullish as it moved slightly northward.
Realistic or not, here’s TRX market cap in BTC‘s terms
AMBCrypto’s look at Hyblock Capital’s data pointed out that if the bears continue to dominate, then the token’s price might plummet to $0.132.
However, in the event of a trend reversal, TRX might first touch $0.136 soon.


