What WAVES’s surfing through 0.702 Fibonacci level means for traders
Anyone who observed WAVES towards the end of March would have been impressed at its bullish performance. However, what goes up must come down and this is echoed in its April price crash.
WAVES price action registered a 50.52% rally from February lows near the $8.48 level to its 31 March high of $63.88. The latter happens to be the cryptocurrency’s new all-time high. However, its impressive run was bound to find resistance and yield a price correction that has prevailed since the start of April.
WAVES traded at $22.14 at the time of this press after a 65% drawdown from its ATH. Roughly $4.6 billion worth of cryptocurrency has been liquidated since its peak.
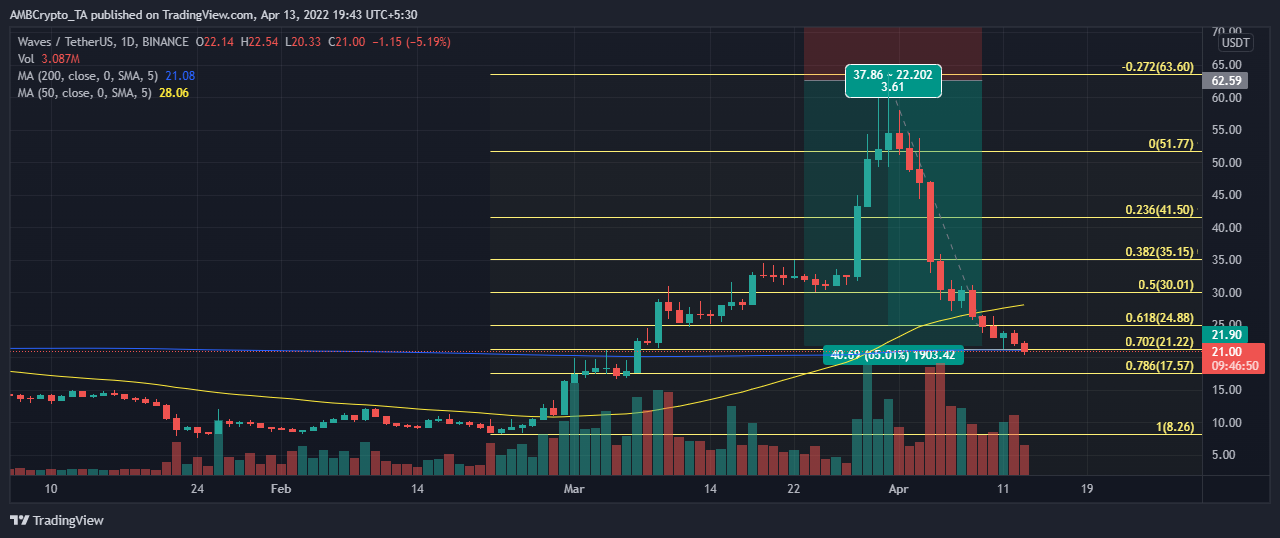
Overlaying the Fibonacci retracement lines from its February lows to March highs reveals that the price managed to break through the 0.72 Fibonacci level. This happened at the $21.22 price point as it continued to extend its pullback.
Why the next Fibonnaci level is important
The next critical level is $17.57 at the 0.786 Fibonacci retracement line where the probability of finding support is significantly high. WAVE’s historic performance reveals that the $17.57 price level previously acted as a price consolidation zone.
There is still a lot of uncertainty as to whether WAVES will extend to the next critical level. On-chain analysis has some insights. For example, it registered massive whale holdings, market cap, and volume increase towards its peak level. However, these have since tapered from ATH levels in line with the price drop.
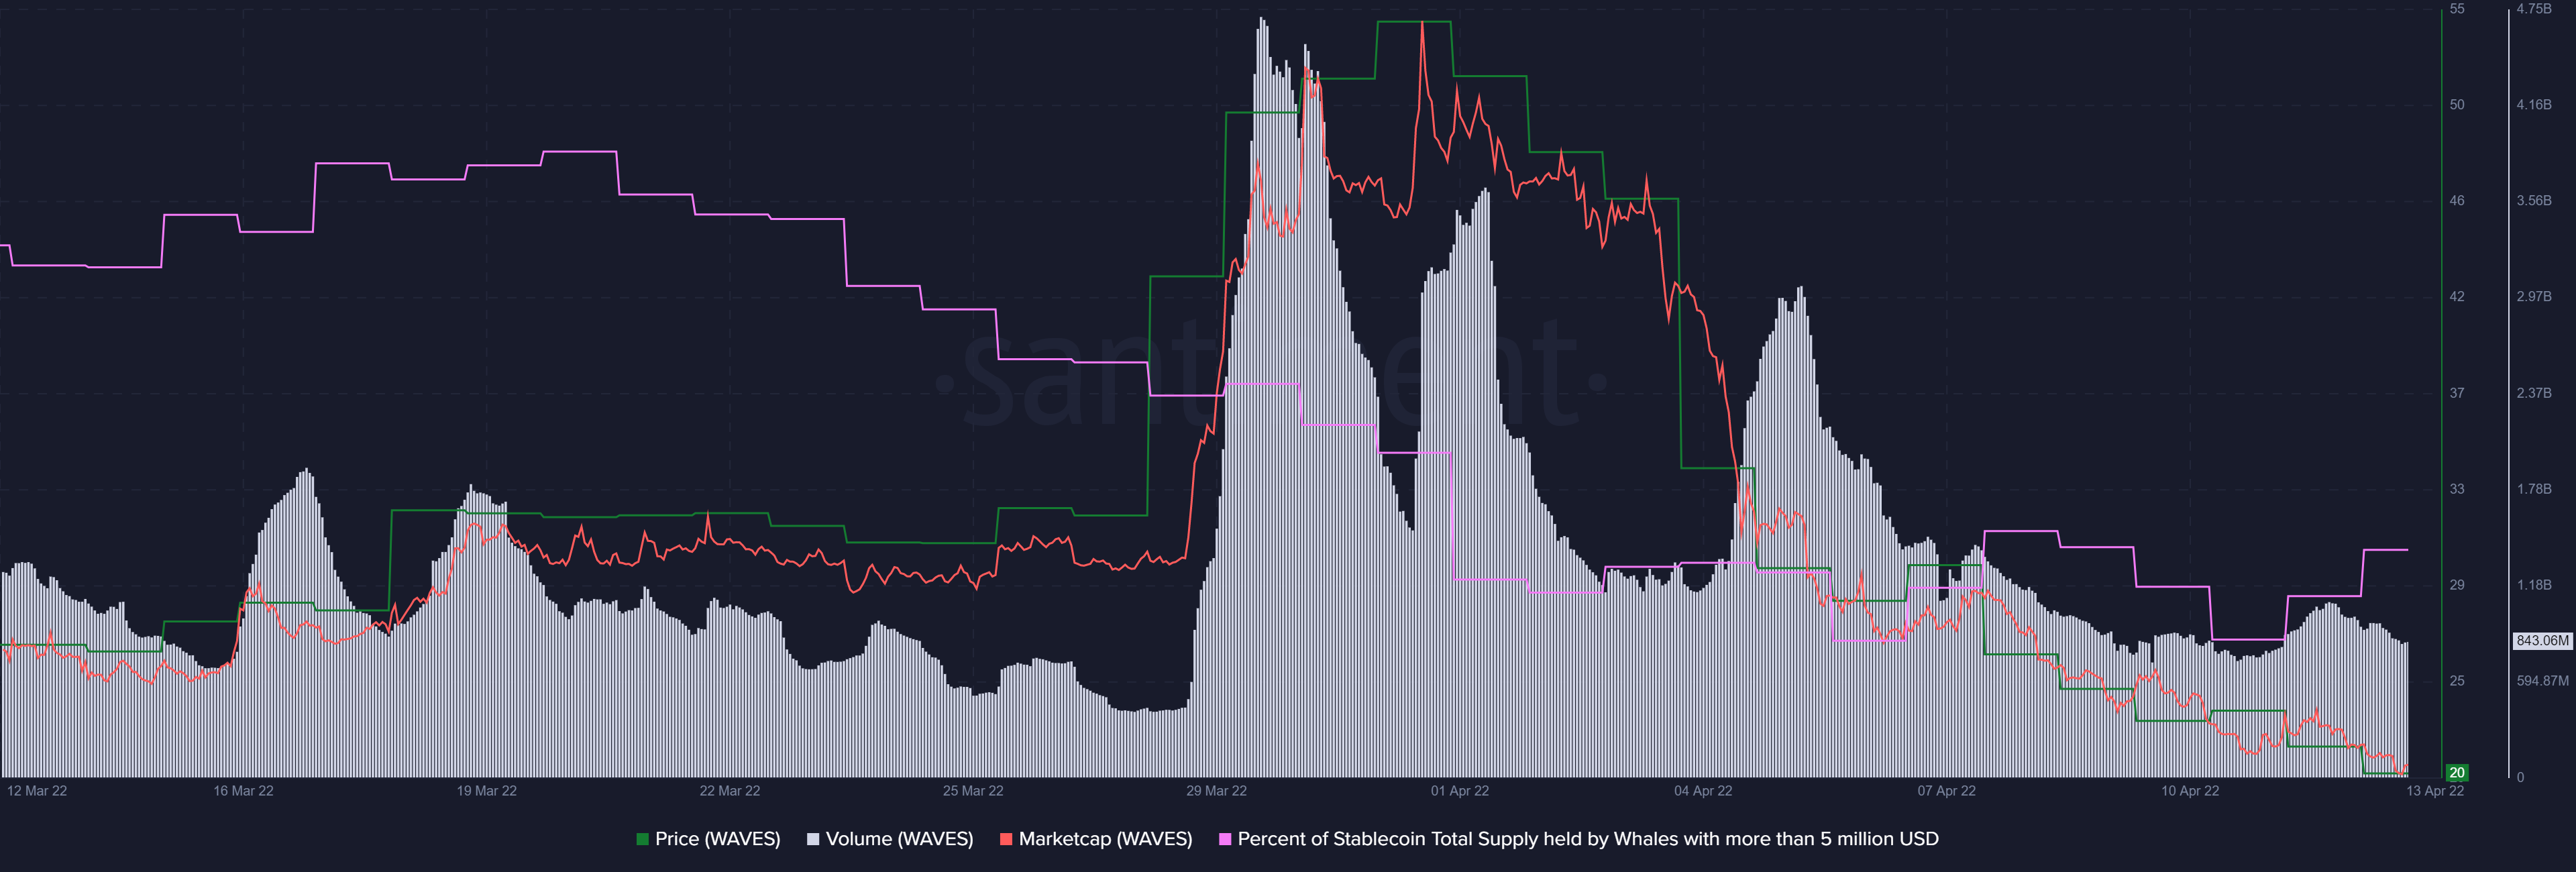
WAVES market cap is currently at its lowest level so far this month but its volume is still slightly higher than its end-of-March lows. It also registered a slight volume and market cap increase in the last 24 hours although the market cap did not register any uptick.
The supply in whale accounts metric highlights what the smart money is doing. If it shows accumulation at lower price levels, that might be a sign that a reversal is imminent.


