
- Ethereum’s daily active addresses have decreased to around 395,000.
- An address moved over 19,500 ETH to Binance in the last 48 hours.
Ethereum [ETH] has experienced significant growth in its daily active addresses over the year, indicating increased use and engagement within its network.
However, recent trends have showed a decline in these active addresses, suggesting a possible slowdown in activity.
Alongside this decrease, there has been a noticeable shift in market dynamics, with sellers beginning to dominate trading activities.
Ethereum’s volatile active addresses
According to data from Glassnode, Ethereum’s daily active address metric has experienced a remarkable increase throughout the year, surging by 127%.
This substantial growth has primarily been driven by heightened activity on Layer 2 (L2) platforms, per the report.
An in-depth analysis of the active addresses metric on Glassnode highlighted a peak in daily active addresses, reaching over 700,000 in June.
However, recent weeks have witnessed a downward trend in this metric. After a significant rise to over 510,000 in July, the number of active addresses began to taper off.
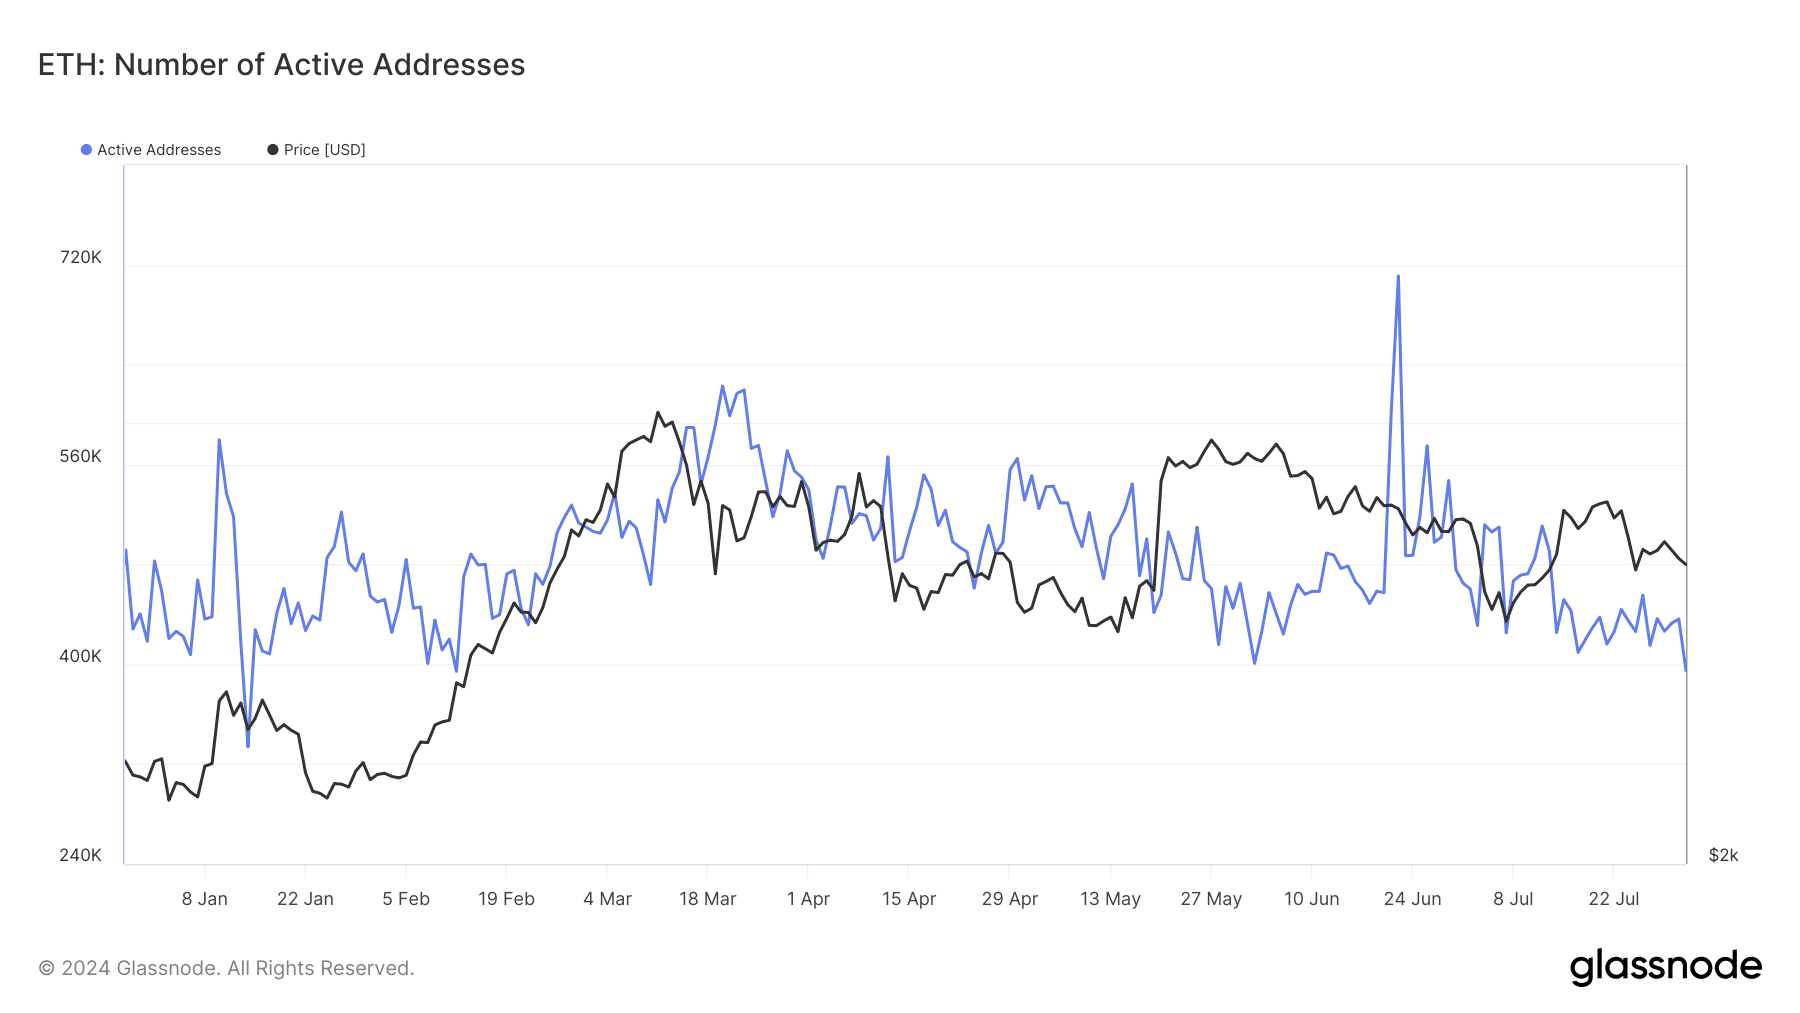
Source: Glassnode
By the end of July, this figure had reduced to approximately 436,000. As of the latest data, it has further decreased to around 395,000.
Ethereum sellers appear more active
The recent analysis of Ethereum’s netflow on Glassnode has highlighted a notable trend. It showed more ETH was being moved into exchanges than was being withdrawn.
The move suggested a predominance of selling activity among holders. Over the past month, this trend culminated with a significant influx of over 22,000 ETH into exchanges.
Further intensifying this trend, data from Lookonchain revealed that specific accounts have been particularly active in transferring ETH to exchanges.
In the last 48 hours alone, these accounts sent a total of 19,500 ETH, valued at nearly $64 million, to the Binance exchange.
Such large-scale movements to exchanges generally indicate a readiness to sell, contributing to increased supply on the market.
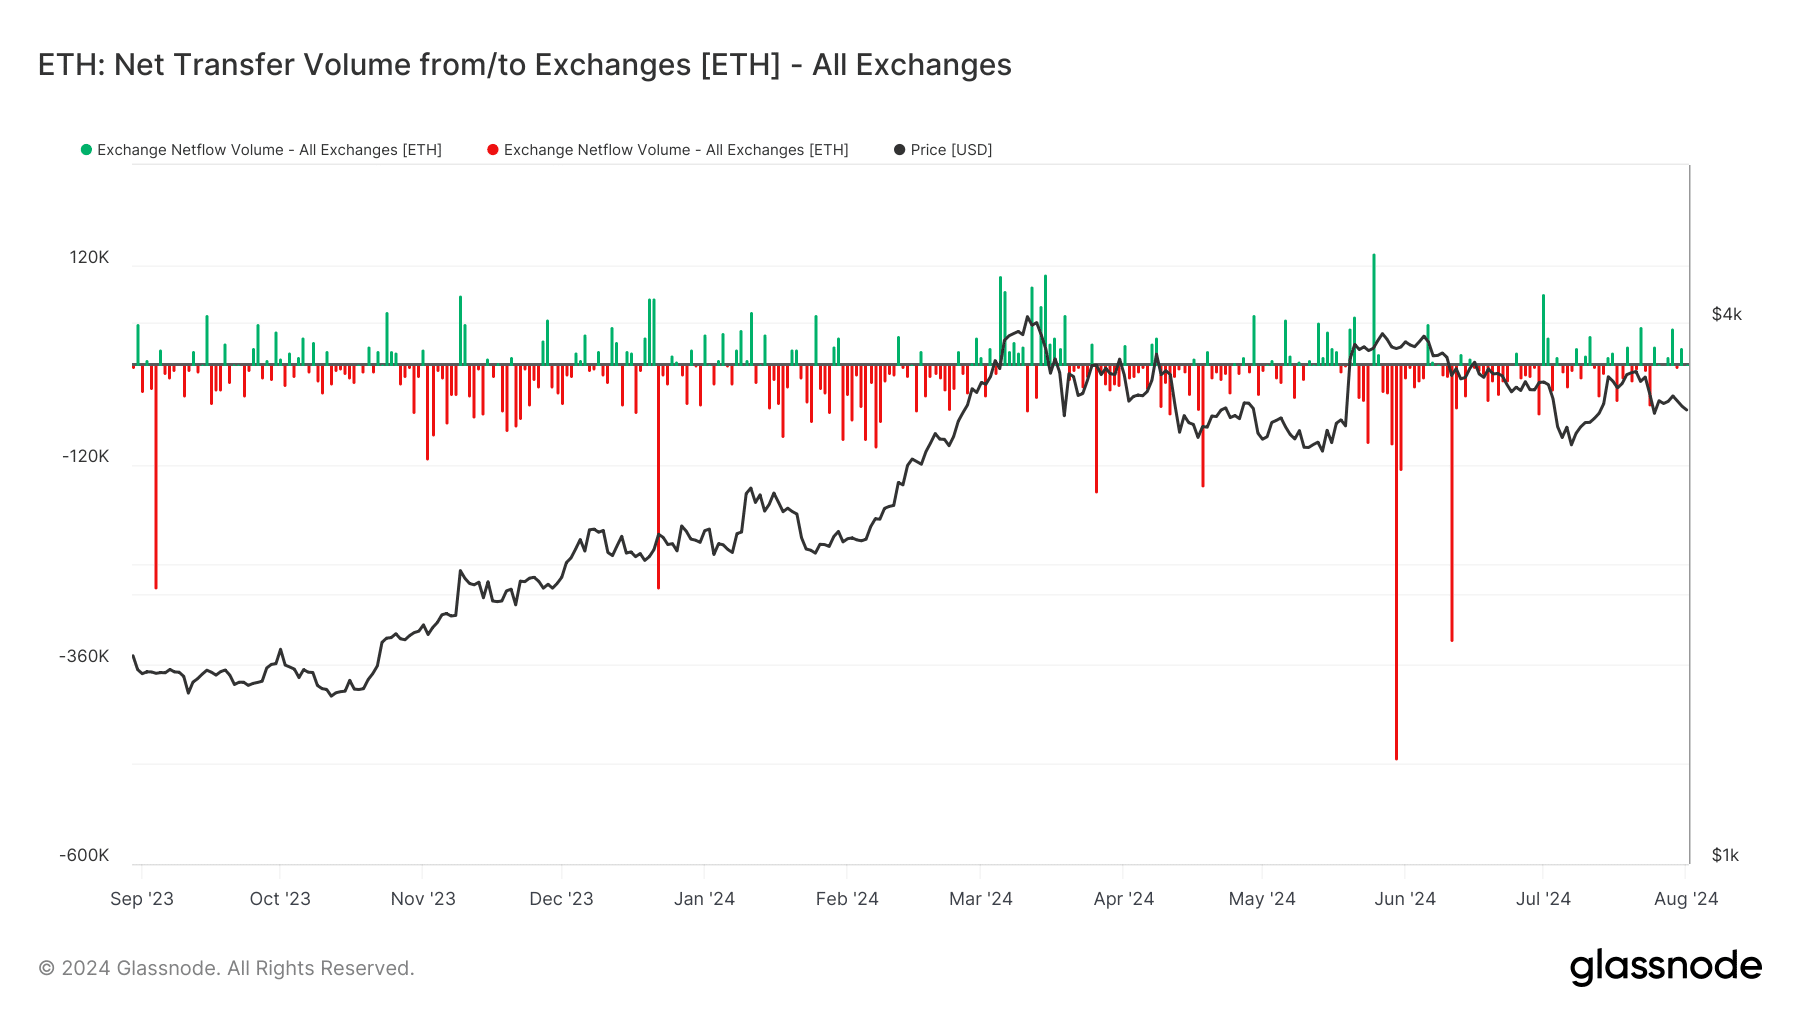
Source: Galssnode
This influx of ETH to exchanges has coincided with and likely contributed to the recent decline in Ethereum’s price.
As more ETH becomes available on the market through these exchanges, the increased selling pressure can lead to a downward trend in price, especially if demand does not keep pace with the new supply.
Is your portfolio green? Check out the ETH Profit Calculator
RSI shows increasing bear trend
An analysis of Ethereum’s daily price trend revealed a decline of over 1.4% at the time of writing. The price was approximately $3,154, marking the fourth consecutive day of decreases.
According to AMBCrypto, the decline began around the 30th of July, and Ethereum has been on a downward trend ever since. The Relative Strength Index (RSI) is about 41, indicating a strengthening bearish trend.
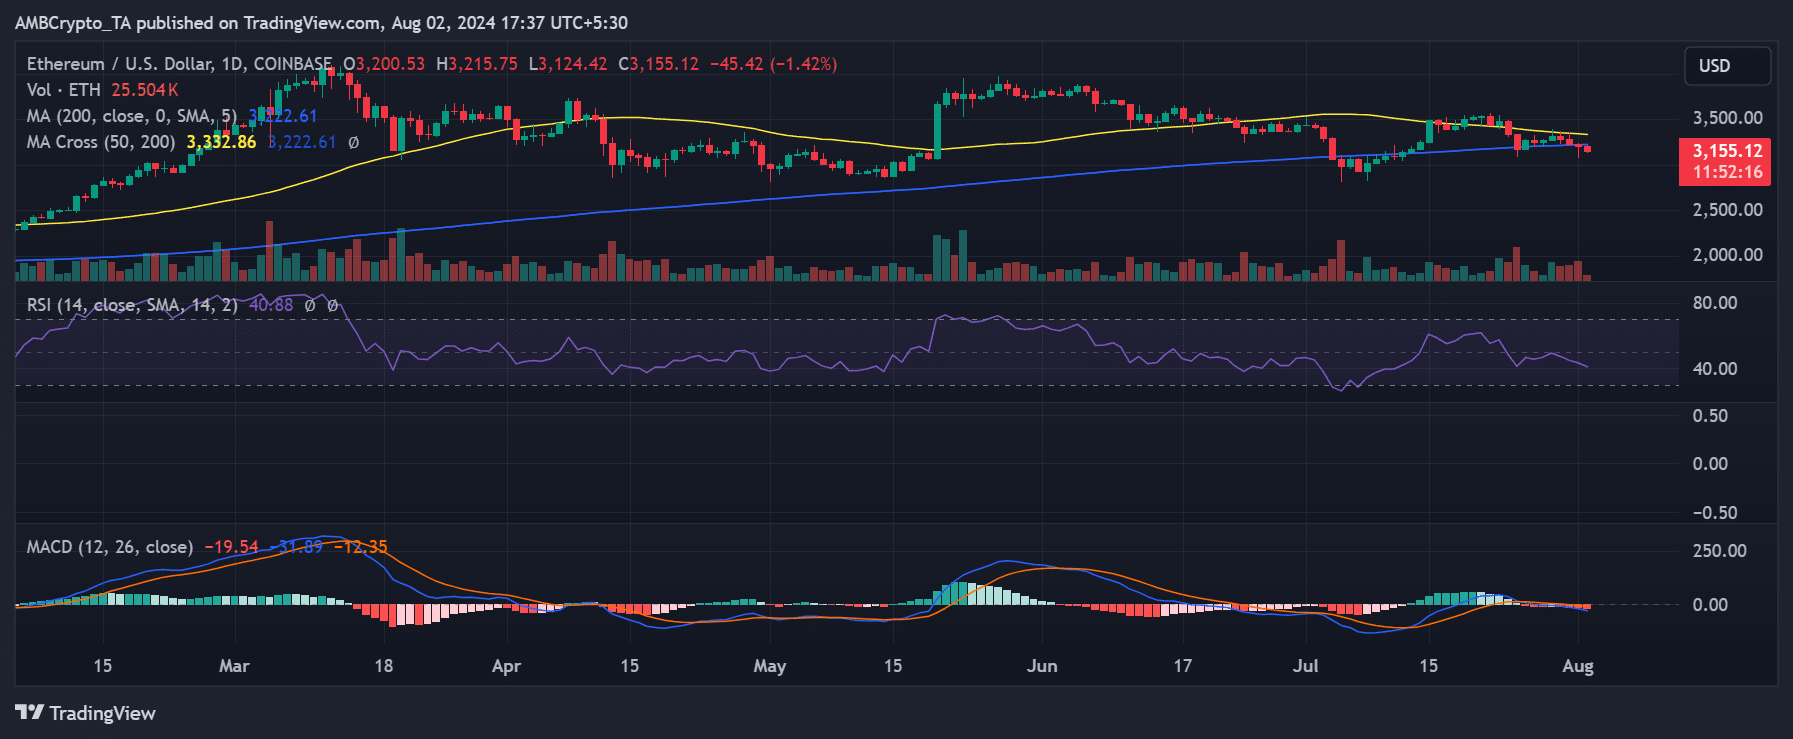
Source: TradingView


