What’s in store for BAT holders- Resistance zone or sell-pressure

Disclaimer: The findings of the following analysis are the sole opinions of the writer and should not be considered investment advice
Basic Attention Token has a myriad of developments on its price chart. A higher timeframe analysis showed the formation of a descending triangle pattern and a subsequent breakout. However, this breakout has not been able to push past $0.95. Moreover, in the past two months, it can also be argued that BAT has established a range between $0.65 and $0.95.
Here is a closer look at what is going on with Basic Attention Token and its price action on the charts.
BAT- 12 Hour Chart
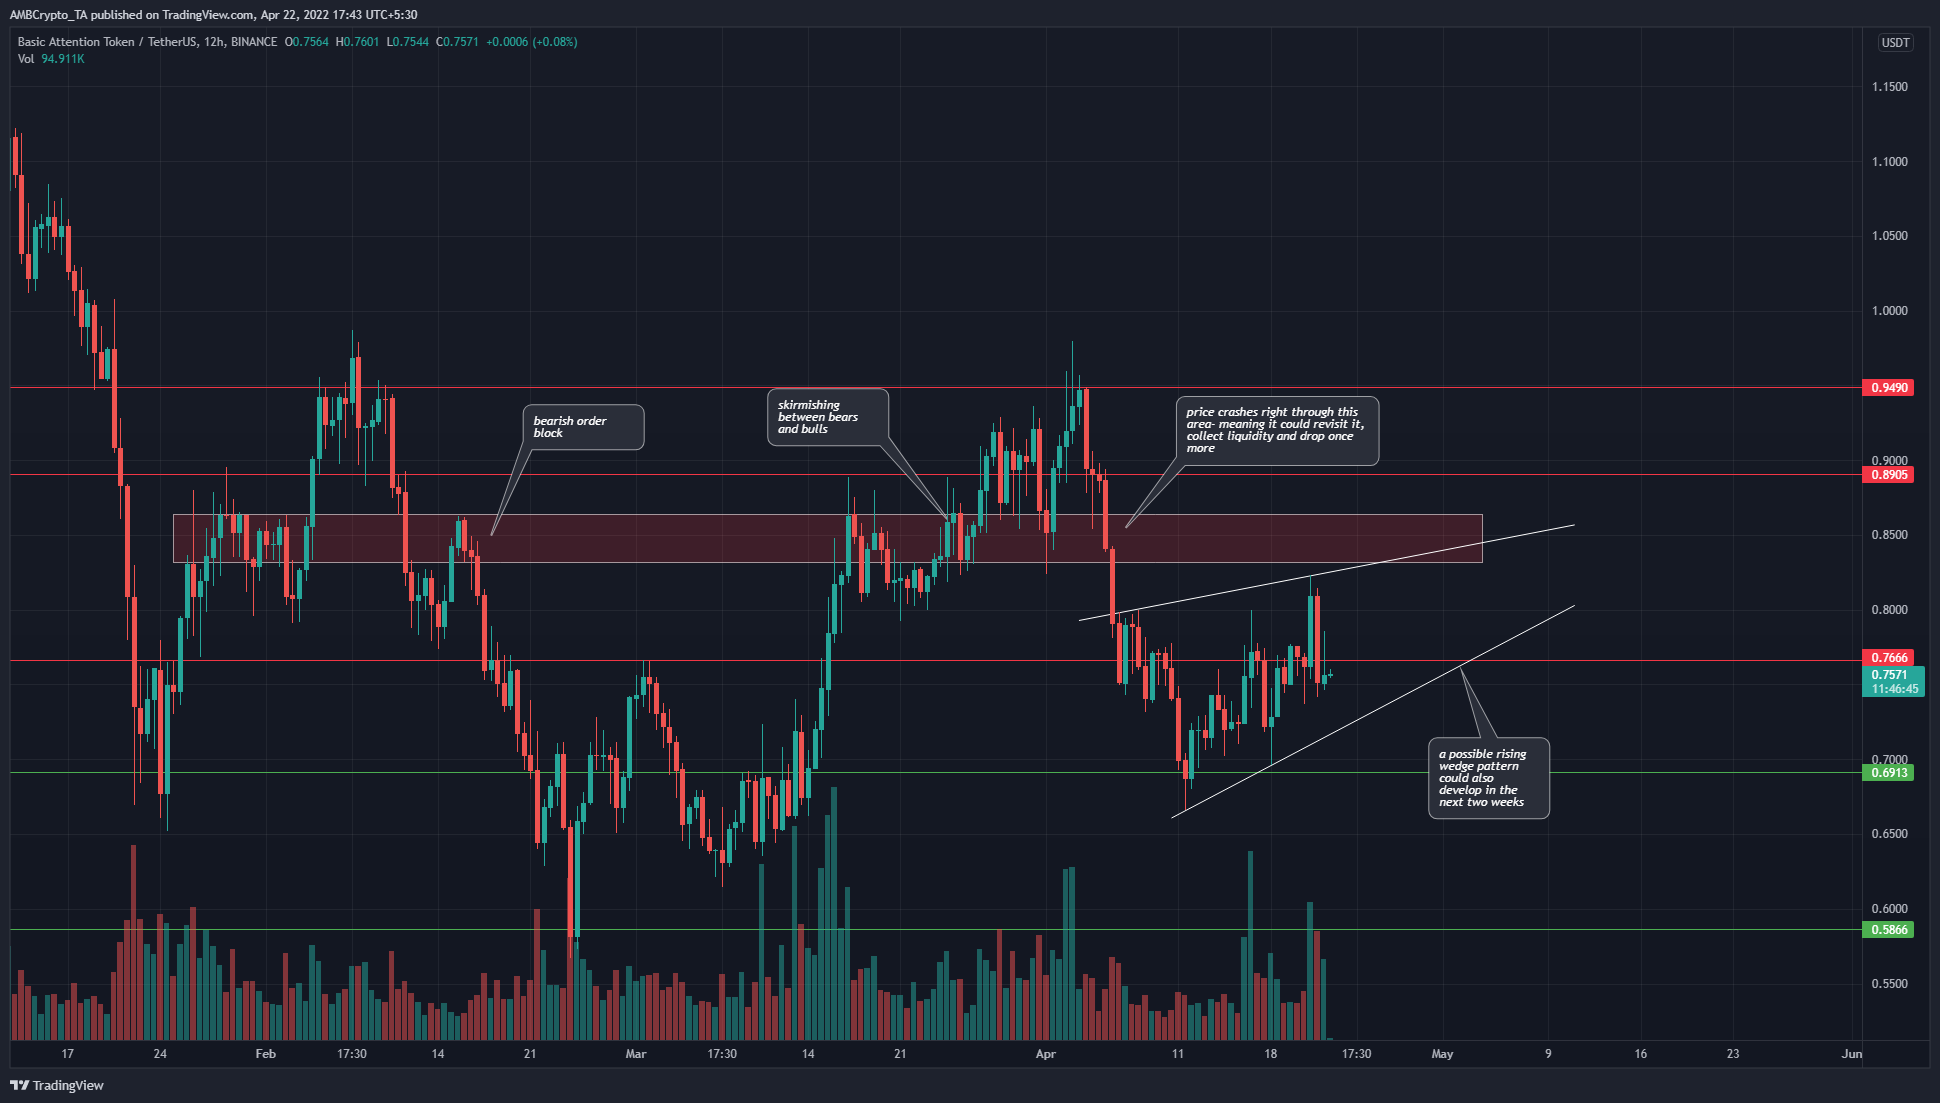
The $0.85 area (red box) has been marked as an area where the price has found both support and resistance in the past two months. It has been an area that rejected BAT, was broken and retested as the zone changed hands from bearish to bullish and back again.
At the time of writing, the $0.76 level and the $0.85 area are places where selling pressure could arise. A rising wedge pattern (white) was also being established. Throughout the month of April, this bearish reversal pattern has slowly been developing.
A likely scenario that could unfold for BAT in the next few weeks, therefore, is a continued push toward the $0.85 area. This could see the wedge pattern unbroken, until near the apex, where a rejection at the resistance zone.
Rationale
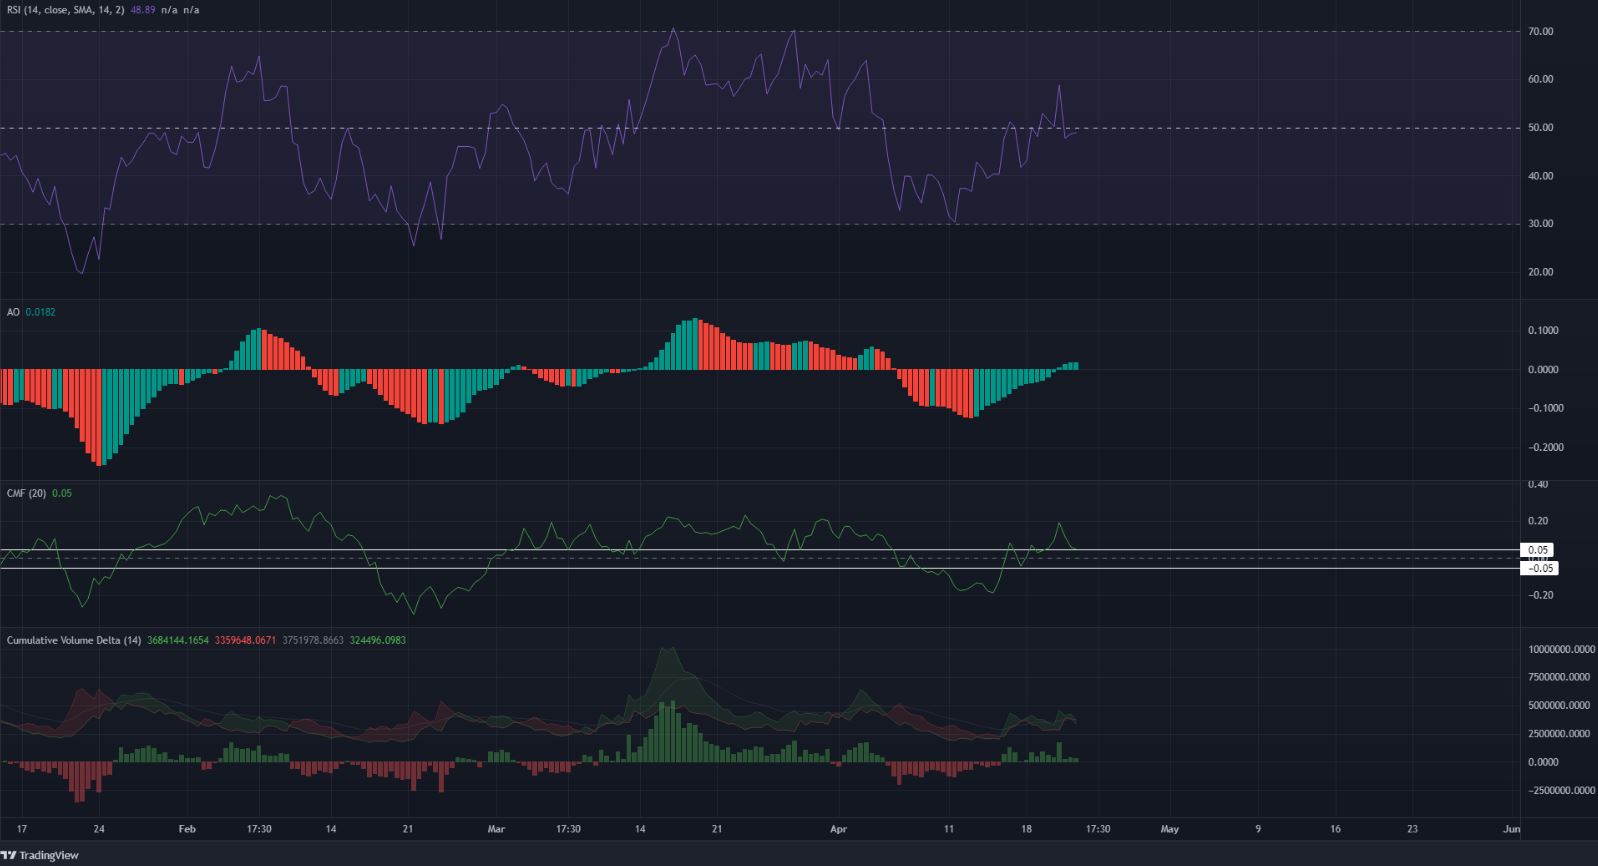
The indicators showed that the prior bearish momentum has shifted to more neutral territory. The RSI on the 12-hour chart climbed to neutral 50 in response to the bounce from the $0.67 level in the past ten days. The Awesome Oscillator formed a bullish crossover above the zero line. Hence, overall, there could be some upward momentum seen in the next week or two.
The CMF was at +0.05 to show buying pressure in the markets, while the CVD also showed that buying has been stronger than selling in the past week.
Conclusion
The indicators showed there has been some buying pressure in the past week and a half, and the bearish pressure also looked to have reversed on the 12-hour chart. The wedge pattern had confluence with a zone of resistance at $0.85, which was a place BAT could see a reversal in its bullish fortunes.


