When can traders go long on XRP?

Disclaimer: The findings of the following article are the sole opinions of the writer and should not be taken as investment advice
While the XRP market was building up towards a symmetrical breakout and a possible climb towards the $1 level, bulls were unable to contain selling pressure over the past few days. In fact, the asset’s price pierced below the lower trendline of the pattern and was heading towards the defensive line of $0.587 and chances of a sharper retracement loomed large.
At the time of writing, XRP was valued at $0.6224, up by 1.7% over the last 24 hours.
XRP Daily Chart
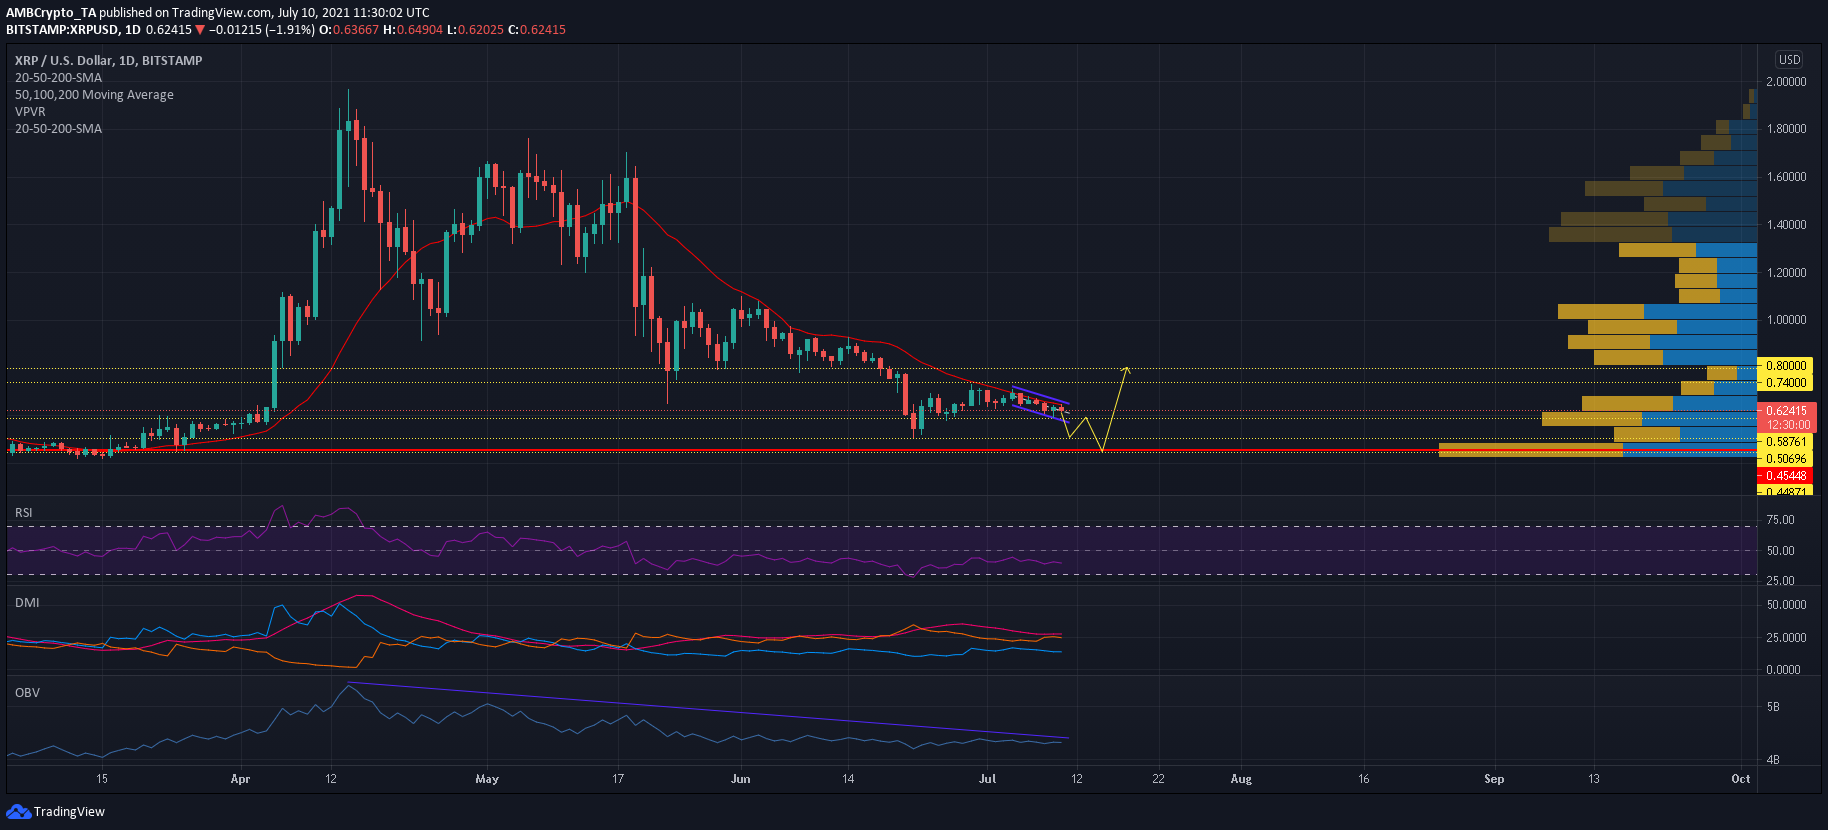
XRP’s 20 Simple Moving Average line has remained bearish since 19 May, restricting gains despite several breakout attempts. The SMA was once again in focus as the price was denied a break above the symmetrical triangle – An outcome that saw XRP register an immediate decline of 6.2%.
Since then, the asset’s price has moved within a down-channel, but losses were not steep due to low volatility. Once volatility picks up and bulls fail to contain losses above $0.587, XRP would be under the threat of a decline towards 22 June’s swing low of $0.50. Further below rested the Visible Range’s POC at $0.445 which could be called into action in case of an extended sell-off.
Overall, this would represent losses of 22% from XRP’s press time level.
Reasoning
The Directional Movement Index’s -DI line has maintained itself above the +DI line for nearly two months as a bearish trend has persisted in the market. A swift recovery is unlikely till the index witnesses a bullish crossover. The Relative Strength Index maintained itself in a bearish-neutral territory as some weakness persisted in the market. Concerningly, the On Balance Volume has been on a steady decline since 14 April as selling pressure has constantly outmatched buying pressure.
These factors suggested that the XRP market is not yet ready for recovery and the price could fall towards lower levels before reversing. Once buyers remerge, gains could be limited to the resistance zone of $0.74-0.80.
Conclusion
XRP’s indicators suggested that the market is open to a further decline in the coming days before reversing its trajectory. Traders can wait and enter long trades once XRP falls to the stronger support line of $0.445 and exit their positions between $0.74-$0.80.