


Disclaimer: The information presented does not constitute financial, investment, trading, or other types of advice and is solely the writer’s opinion.
- The daily timeframe structure and trend favored the sellers.
- A reversal was a possibility but another 12% drop appeared more likely.
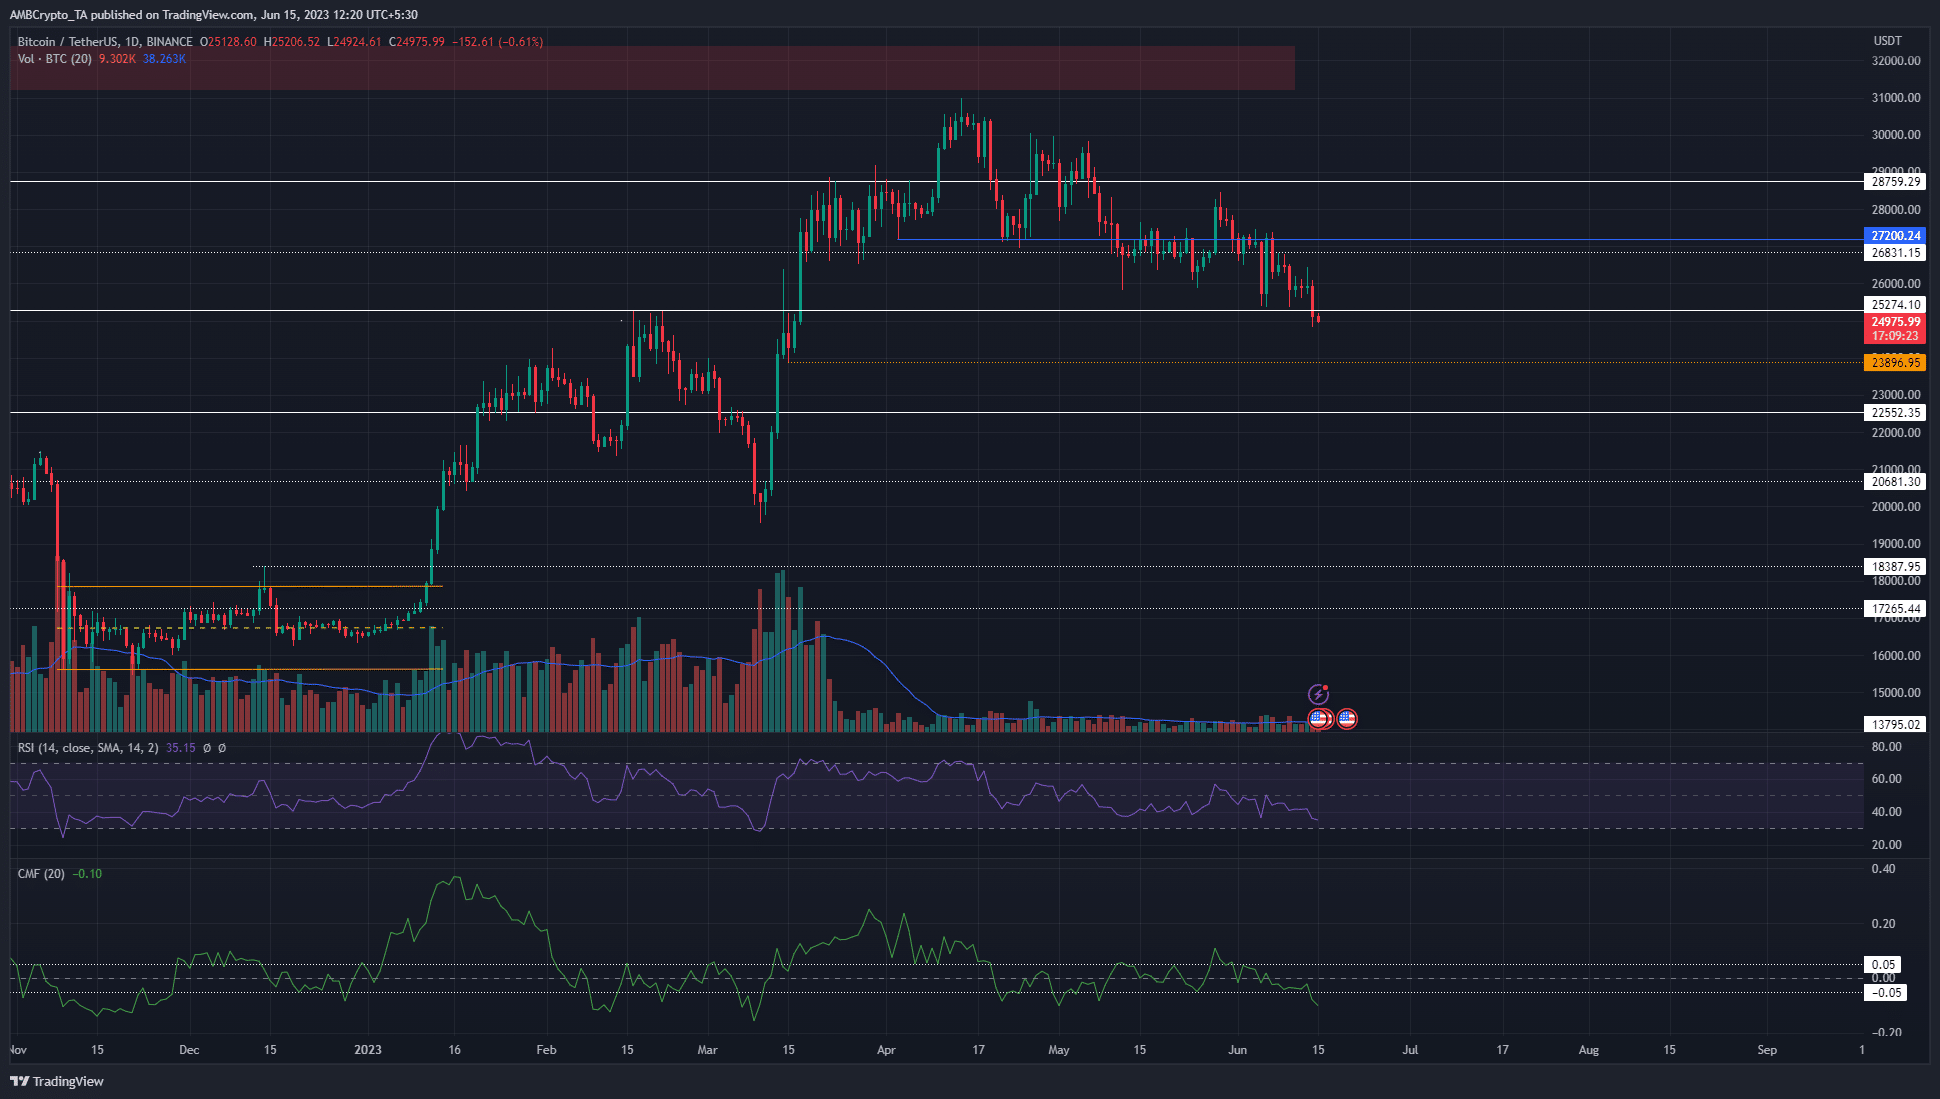
Bitcoin [BTC ] had a strong bearish outlook on the higher timeframe price charts. The $25.2k level was a critical support level- it had acted as resistance in February and March, but the bulls were exhausted by the relentless selling pressure in recent weeks.
Read Bitcoin’s [BTC] Price Prediction 2023-24
Investors fled toward self-custody and supply on exchanges was rapidly falling. This trend developed after the uncertainty around Binance and Coinbase following the SEC’s lawsuits. Hence, it likely does not represent accumulation, and further bearish pressure was possible for BTC.
We might be looking at below $20k prices once more in 2023
A drop below $20k sounds like an alarmist warning at first glance. The trend of Bitcoin has been upward in 2023. Consider the surge from $19.5k to $31k in March and April. Even if Bitcoin descends to the $22k mark, it might not be more than a correction from the impulse wave upward.
Having said that, the trend of Bitcoin was firmly bearish. The price has posted a series of lower highs and lower lows after breaching the $27.2k higher low on 24 April, breaking the formerly bullish market structure.
The RSI has been below neutral 50 for the most part since mid-April, showing bearish momentum. The CMF sank below -0.05 for the first time in a month to highlight a significant amount of capital flow out of the Bitcoin market.
To the south, the $23.9k-$24k area could offer some support. A bounce from this level to retest $25.2k could be followed by another move down. In such a scenario, the $22k and $19.5k levels are the ones to watch out for.
Exchange inflows spiked close to April highs
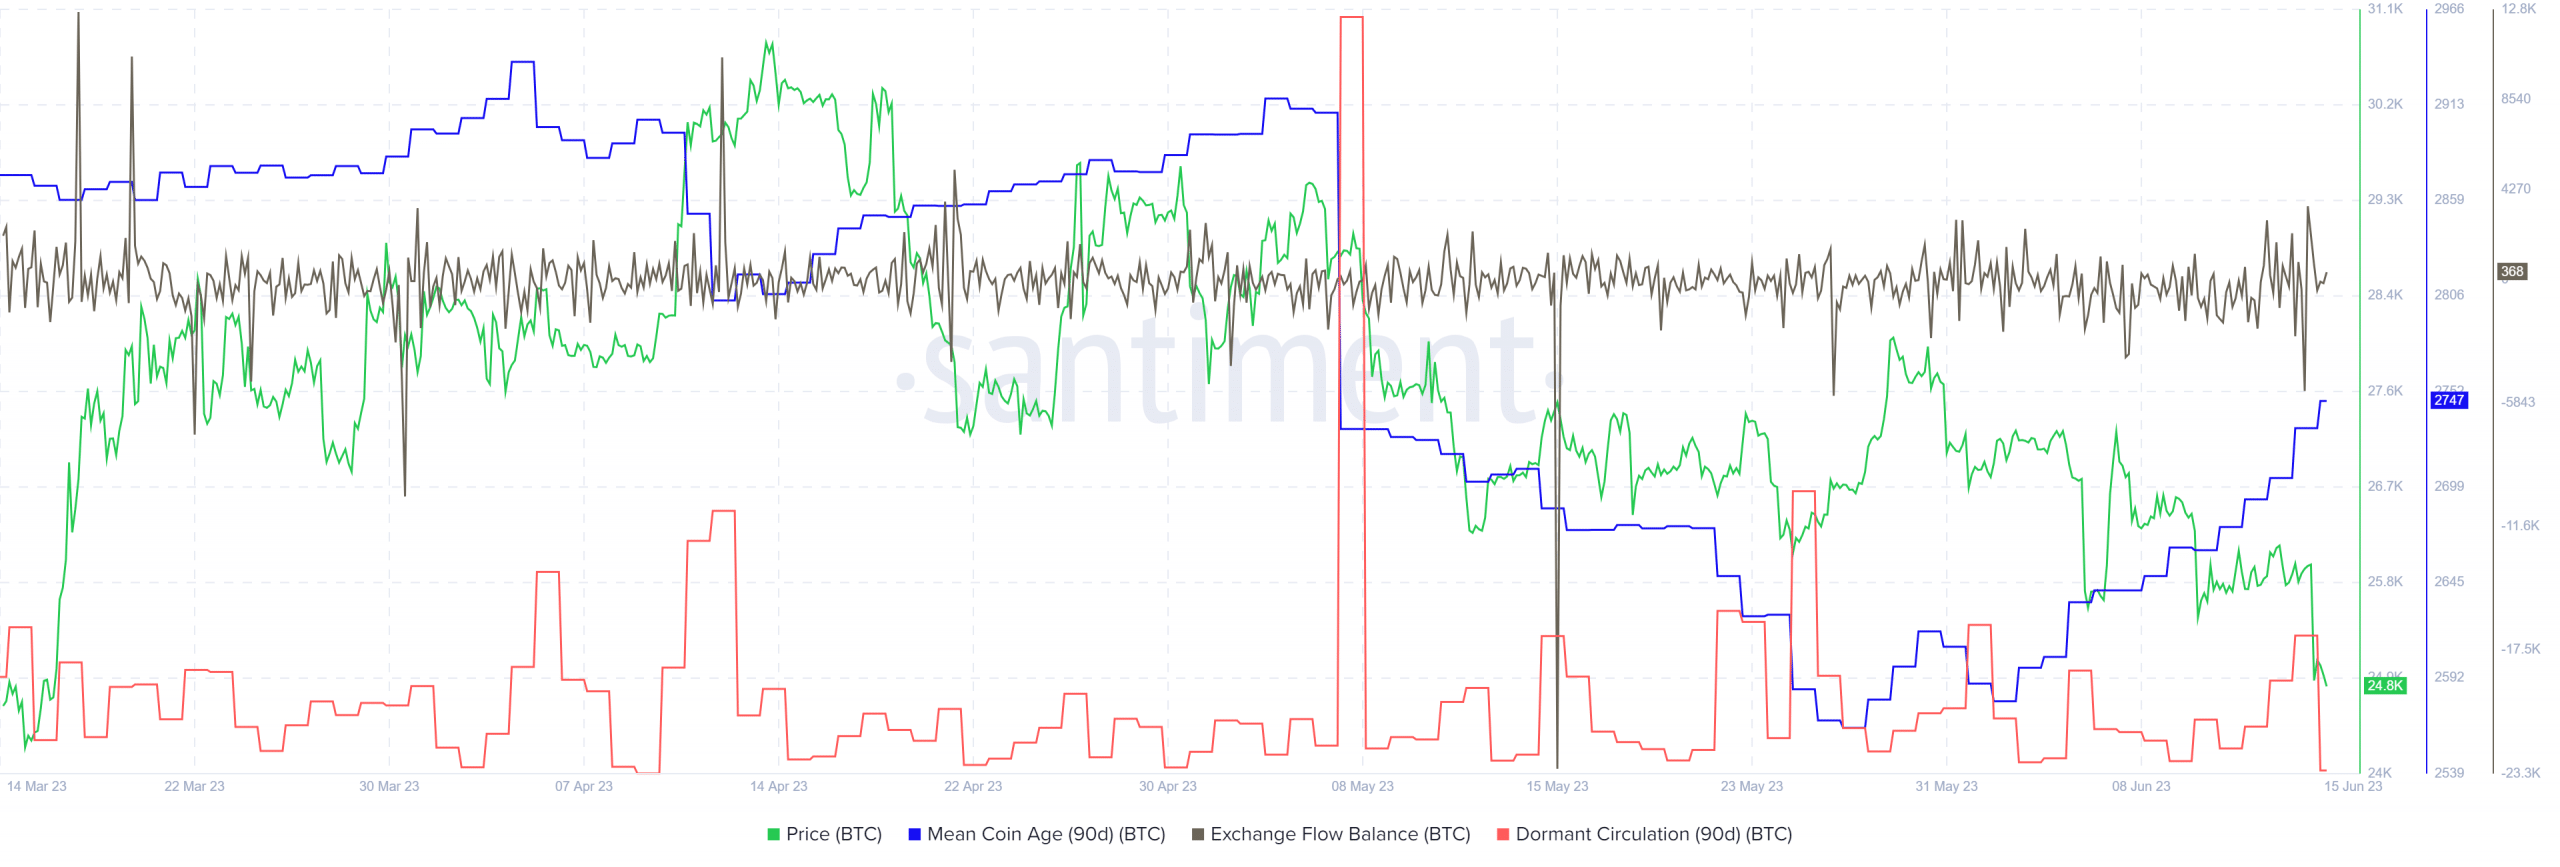
The BTC exchange netflow metric showed each day’s flows across exchanges. The metric suggested persistent inflows in the past four days. This indicated a rise in selling pressure was imminent. Yet, although there was a wave of selling that drove prices downward, the mean coin age was on the rise.
Is your portfolio green? Check the Bitcoin Profit Calculator
The dormant circulation metric saw a small spike on 14 June. Overall, the price action of Bitcoin and metrics highlighted a bearish bias. The rising mean coin age suggested that whales might not be part of the selling pressure.