Why Axie Infinity [AXS] could see a near-term setback before bouncing back
![Why Axie Infinity [AXS] could see a near-term setback before bouncing back](https://ambcrypto.com/wp-content/uploads/2022/07/Untitled-design-46.png)
Disclaimer: The findings of the following analysis are the sole opinions of the writer and should not be considered investment advice.
Soon after Axie Infinity [AXS] approached to test the $12-support, buyers provoked a week-long rally in an ascending channel (white).
Then, AXS witnessed double-digit gains to find itself sustaining above the basis line (green) of the Bollinger Bands (BB). While the sellers attempted to halt the bullish endeavors in the $17 region, AXS saw a patterned break.
The recent revival toward its three-week resistance may cause near-term setbacks in the coming sessions. At press time, AXS was trading at $17.132, up by 7.44% in the last 24 hours.
AXS 4-hour Chart
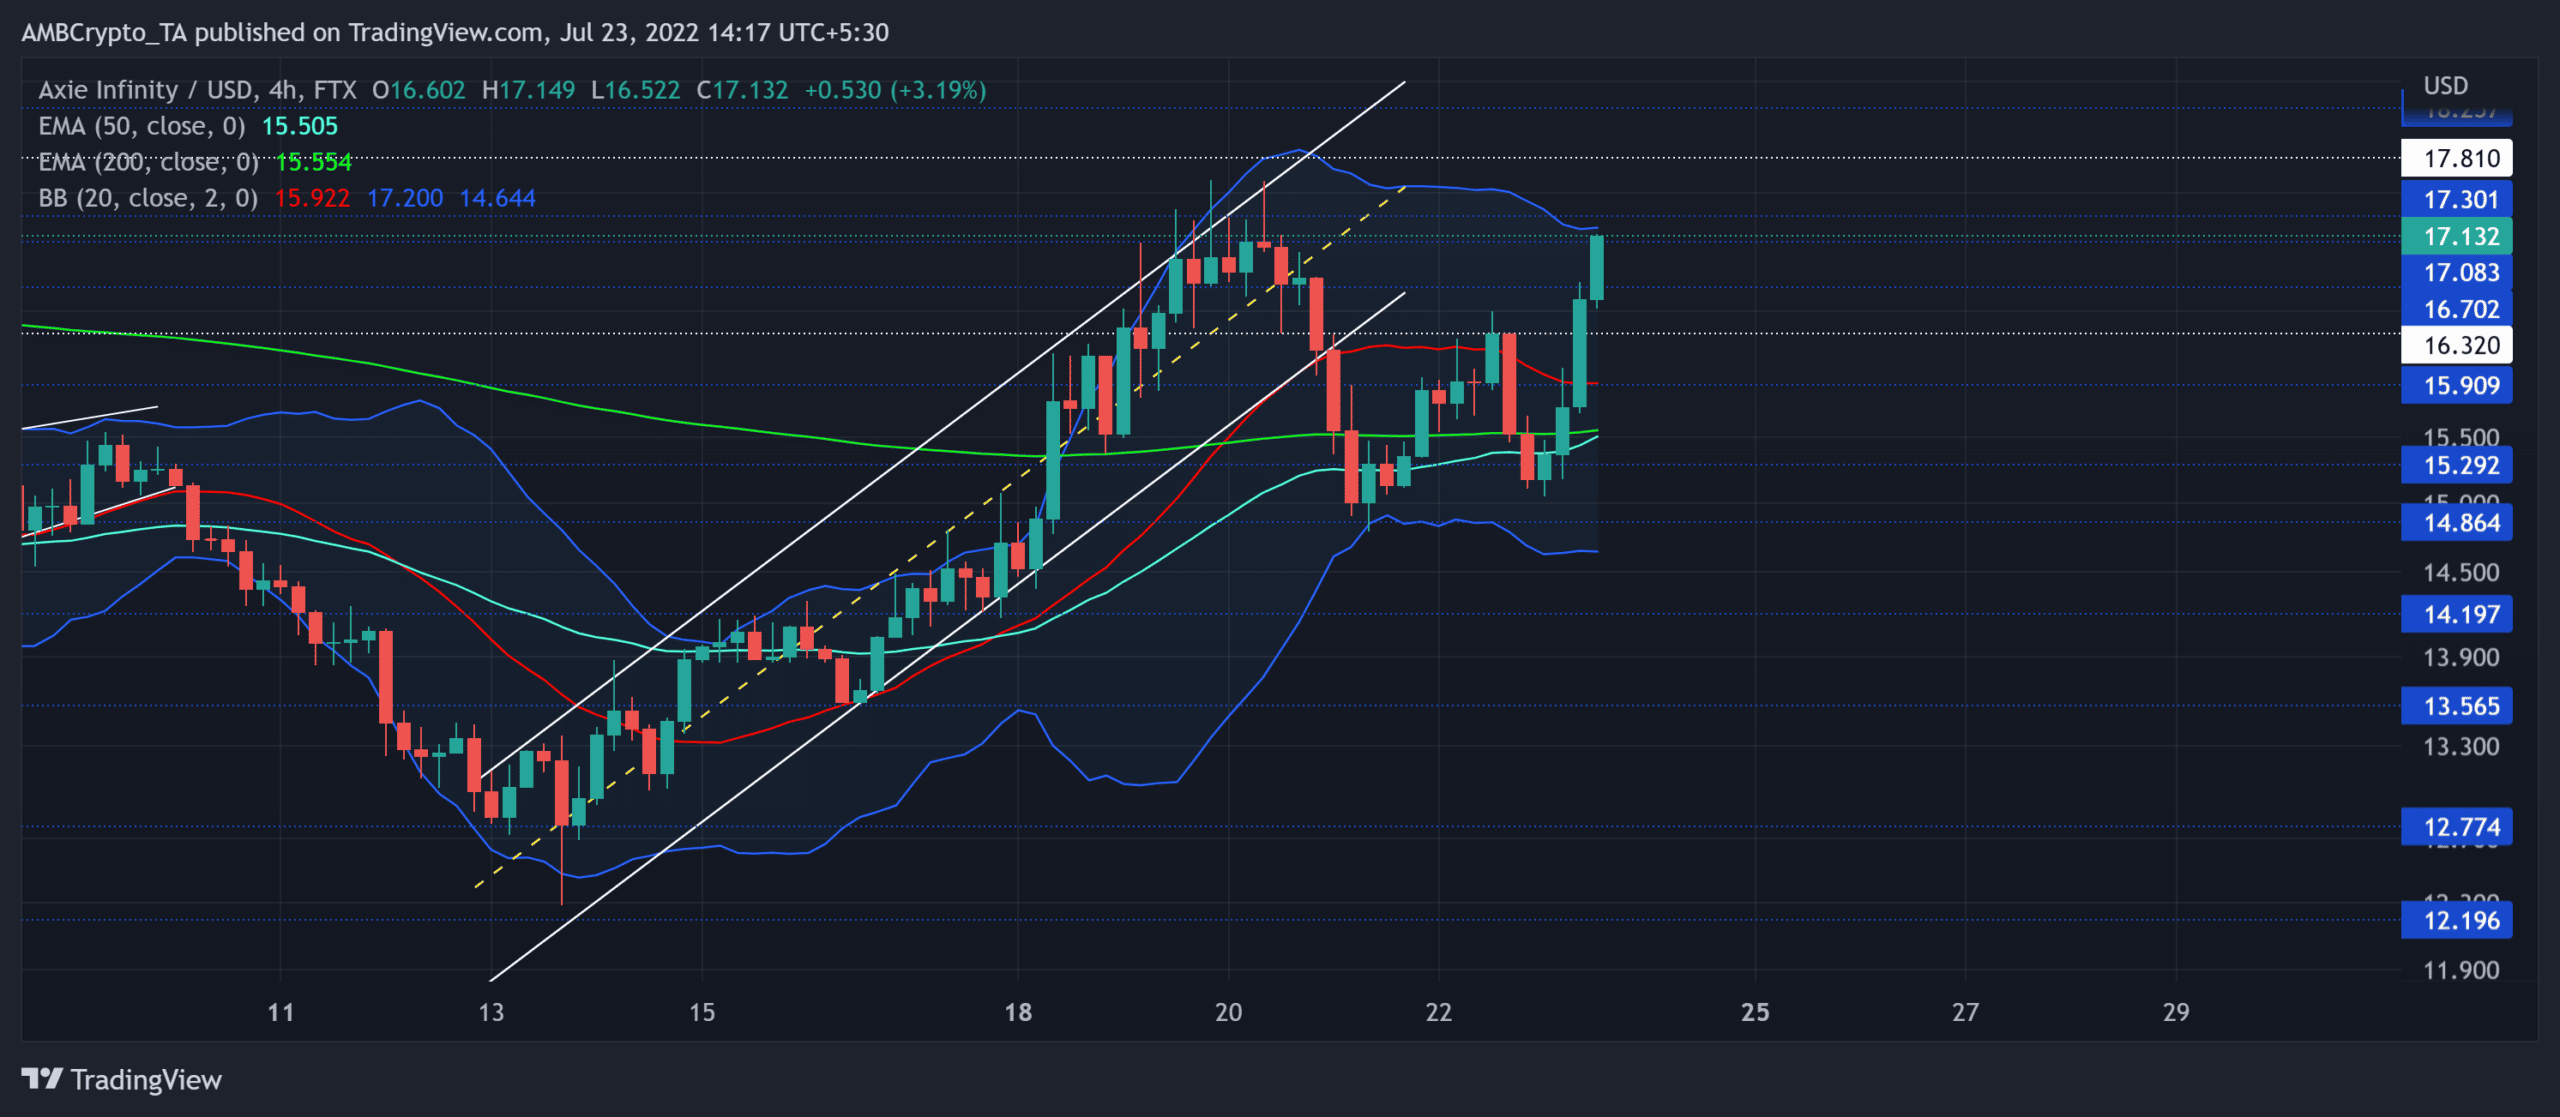
The alt’s reversal from the $18-level since late June propelled a bearish rising wedge setup in the four-hour timeframe. Post an expected breakdown from this structure, the buyers recouped their forces over the last week.
AXS saw an over 42% return on investment (ROI) from its monthly low on 13 July to poke the $17-mark on 20 July. As the buyers finally showed up, these gains aided AXS to find a spot above the basis line of Bollinger Bands (BB). With the upper band of the BB and the $15-mark creating a stiff barrier, the alt saw an expected drawdown.
The fall below the up-channel confirmed a breakdown. The sellers could now aim to constrict the buying efforts near the upper band of BB and the $17 resistance.
A sustained close below this level can pull AXS toward the basis line of BB. A close below this level can extend the downside toward the $14-$15 range. Contrarily, an immediate revival from the $17-mark would likely be short-lived by the $17.8-$18 range resistance.
Rationale
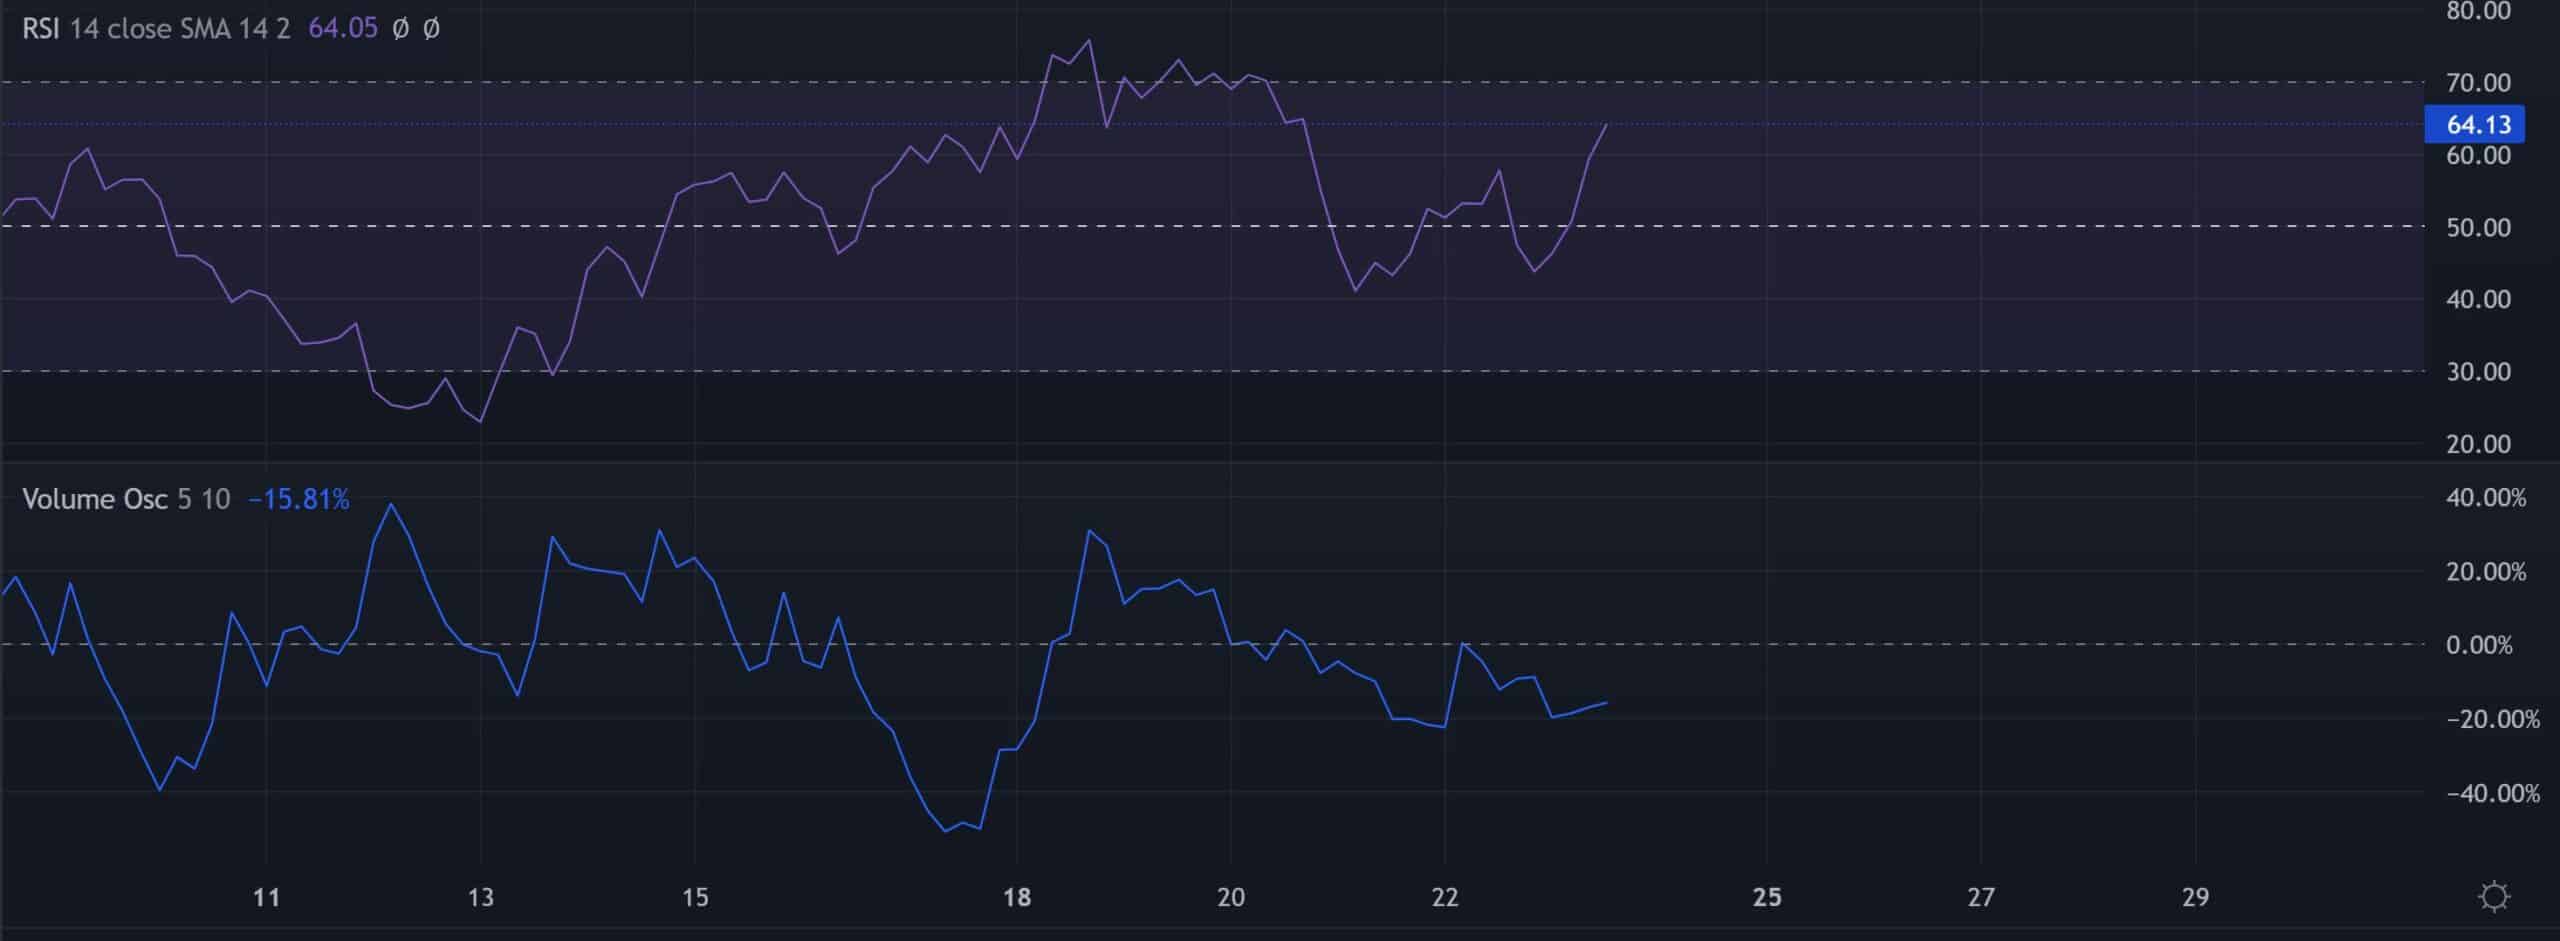
The Relative Strength Index (RSI)’s equilibrium has flipped into support after the buyers exhibited their edge over the last day. Any reversals from the 64-mark can hinder the near-term progress on the chart.
However, the on-Balance Volume (OBV)’s lower peaks over the last day have rather bearishly diverged with the price action. So a reversal in the coming sessions may not be unlikely.
Conclusion
Given the bearish divergence on the OBV alongside the resistances in the $17 region, AXS could see a near-term pullback. The take-profit levels would remain the same as above.
Further, a bullish crossover of the 50 EMA (cyan) and the 200 EMA (green) would affirm a golden cross and reignite the long-term bullish tendencies.
Also, it becomes vital to note that the altcoin shares an 68% 30-day correlation with Bitcoin. Thus, keeping an eye on Bitcoin’s movement would be essential for making a profitable move.