Why Bitcoin could come close to $80,000 by October-end

Bitcoin has sliced through some rigid price ceilings over the past week. Having touched $55K mark for the first time since in five months, the king coin was well and truly back within a bullish long-term bias. Moving forward, a decisive close above the 23.6% Fibonacci level would put BTC onwards to $60,000, leaving only a limited number of available options for sellers. At the time of writing, BTC traded at $55,525, up by 2.9% over the last 24 hours.
BTC Daily Chart
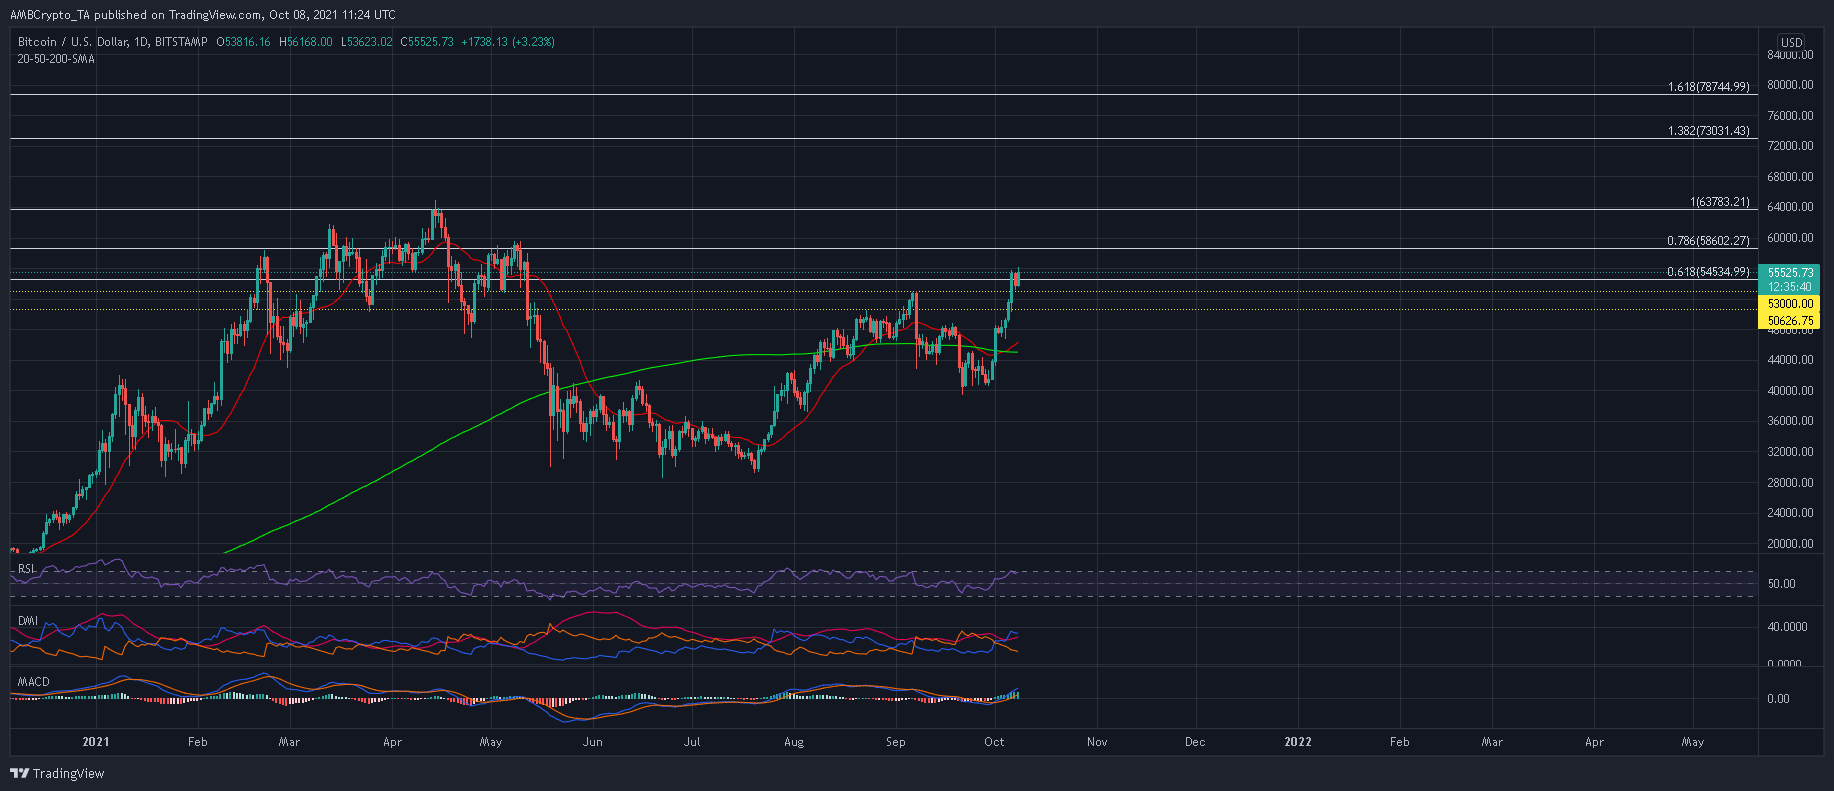
The first eight days of October have accounted for nearly 40% gains for the market leader. With a difficult month of September now done and dusted and a golden cross transpiring few days ago, BTC shifted back to a bullish bias. Getting past a few hurdles at the 78.6% Fibonacci Extension and $60,000 price ceiling would pave way for a fresh ATH. The 138.2% ($73,031) and 161.8% ($78,744) Fibonacci levels could be BTC’s next destinations if bulls are able to maintain their relentless pressure.
Now according to the Visible Range, BTC can experience some selling pressure between $58,600-$60,000 but not a lot of options were open to bears above this range. In many ways, this range seemed to be the final obstacle in BTC’s route to $70,000. If sellers do come out on top, expect a retest of near-term support levels of $53,000 and $50,000.
Reasoning
BTC’s indicators were expected to attract more buyers to the market. The Directional Movement Index’s +DI resumed movement above the -DI after a bullish crossover. The MACD also maintained its northbound trajectory and now traded above the half-line. This reading would dissuade short-sellers from placing their bets.
Now, historically, BTC has pushed its RSI into the overbought zone on multiple occasions during a single rally. Presently, the RSI had formed only one peak in the upper zone and had more room for growth before a reversing trajectory.
Conclusion
The next few days could see buyers and sellers tussle at the $58,600-$60,000 price range. From there, a close above $60,000 with conviction would put BTC onwards to a new ATH. By October end, BTC could even BTC extend up to its 138.2% and 161.8% Fibonacci Extension levels provided upwards pressure does not show any cracks.