


- Returning long-term holders and a decline in discussion suggest a higher value.
- The Open Interest indicated that buyers were more aggressive.
If you believe that Bitcoin’s [BTC] rise to $72,000 is the end, several on-chain metric are saying “no, it’s just the start.” For example, AMBCrypto’s analysis showed that a high number of dormant coins are moving into circulation.
A surge in dormant circulation implies that sidelined Long-term holders are interested in the market. Historically, this is a confirmation of the bull market. Furthermore, the Social Dominance signaled that BTC might rise much more than its press time value.
When comparing Bitcoin’s price and Social Dominance, we observed that the correlation was low. In past bull cycles, low discussion about BTC irrespective of the price jump was a sign that the coin has not reached the top.
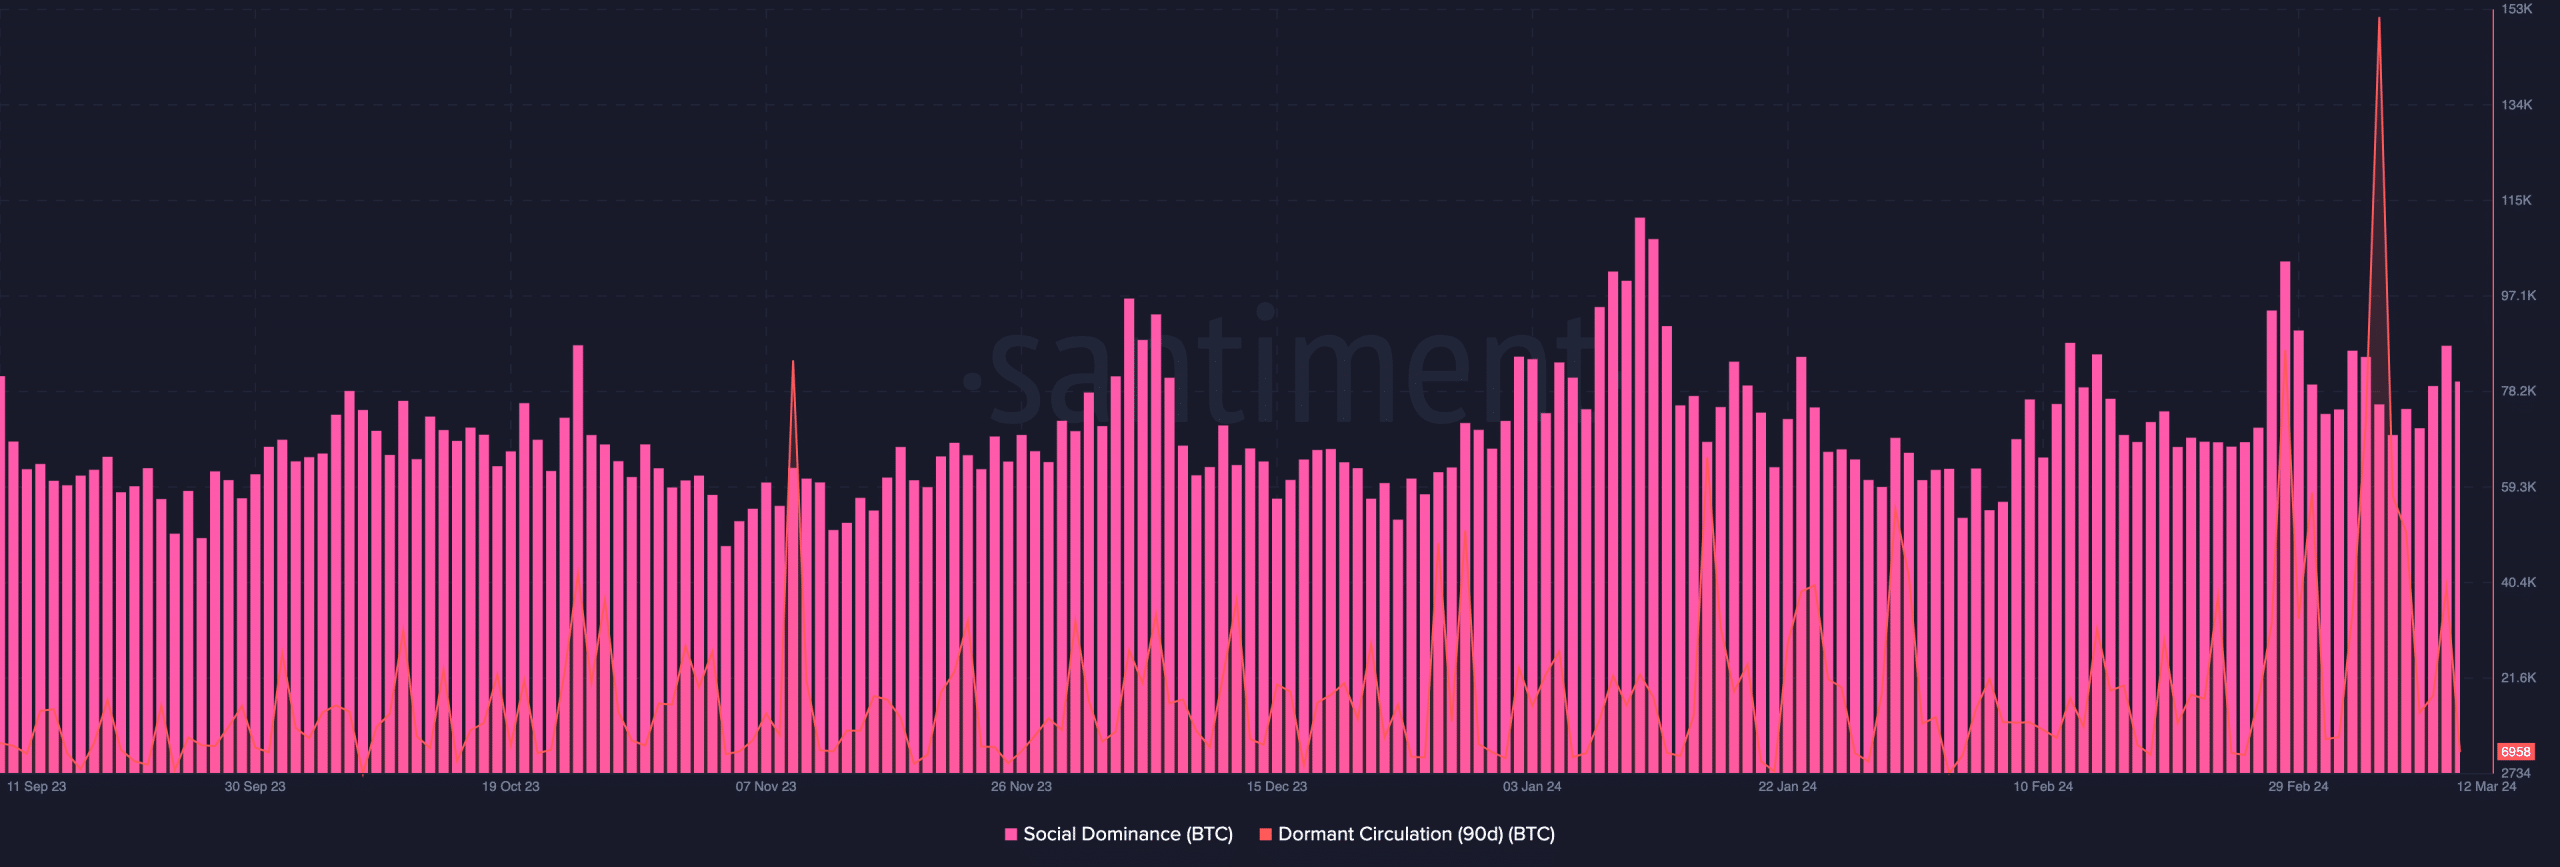
Bitcoin has not hit its peak
With these signs, it is not out of place to say that the $80,000 to $100,000 predictions might be feasible. But before you get too excited, it is necessary to assess other metrics.
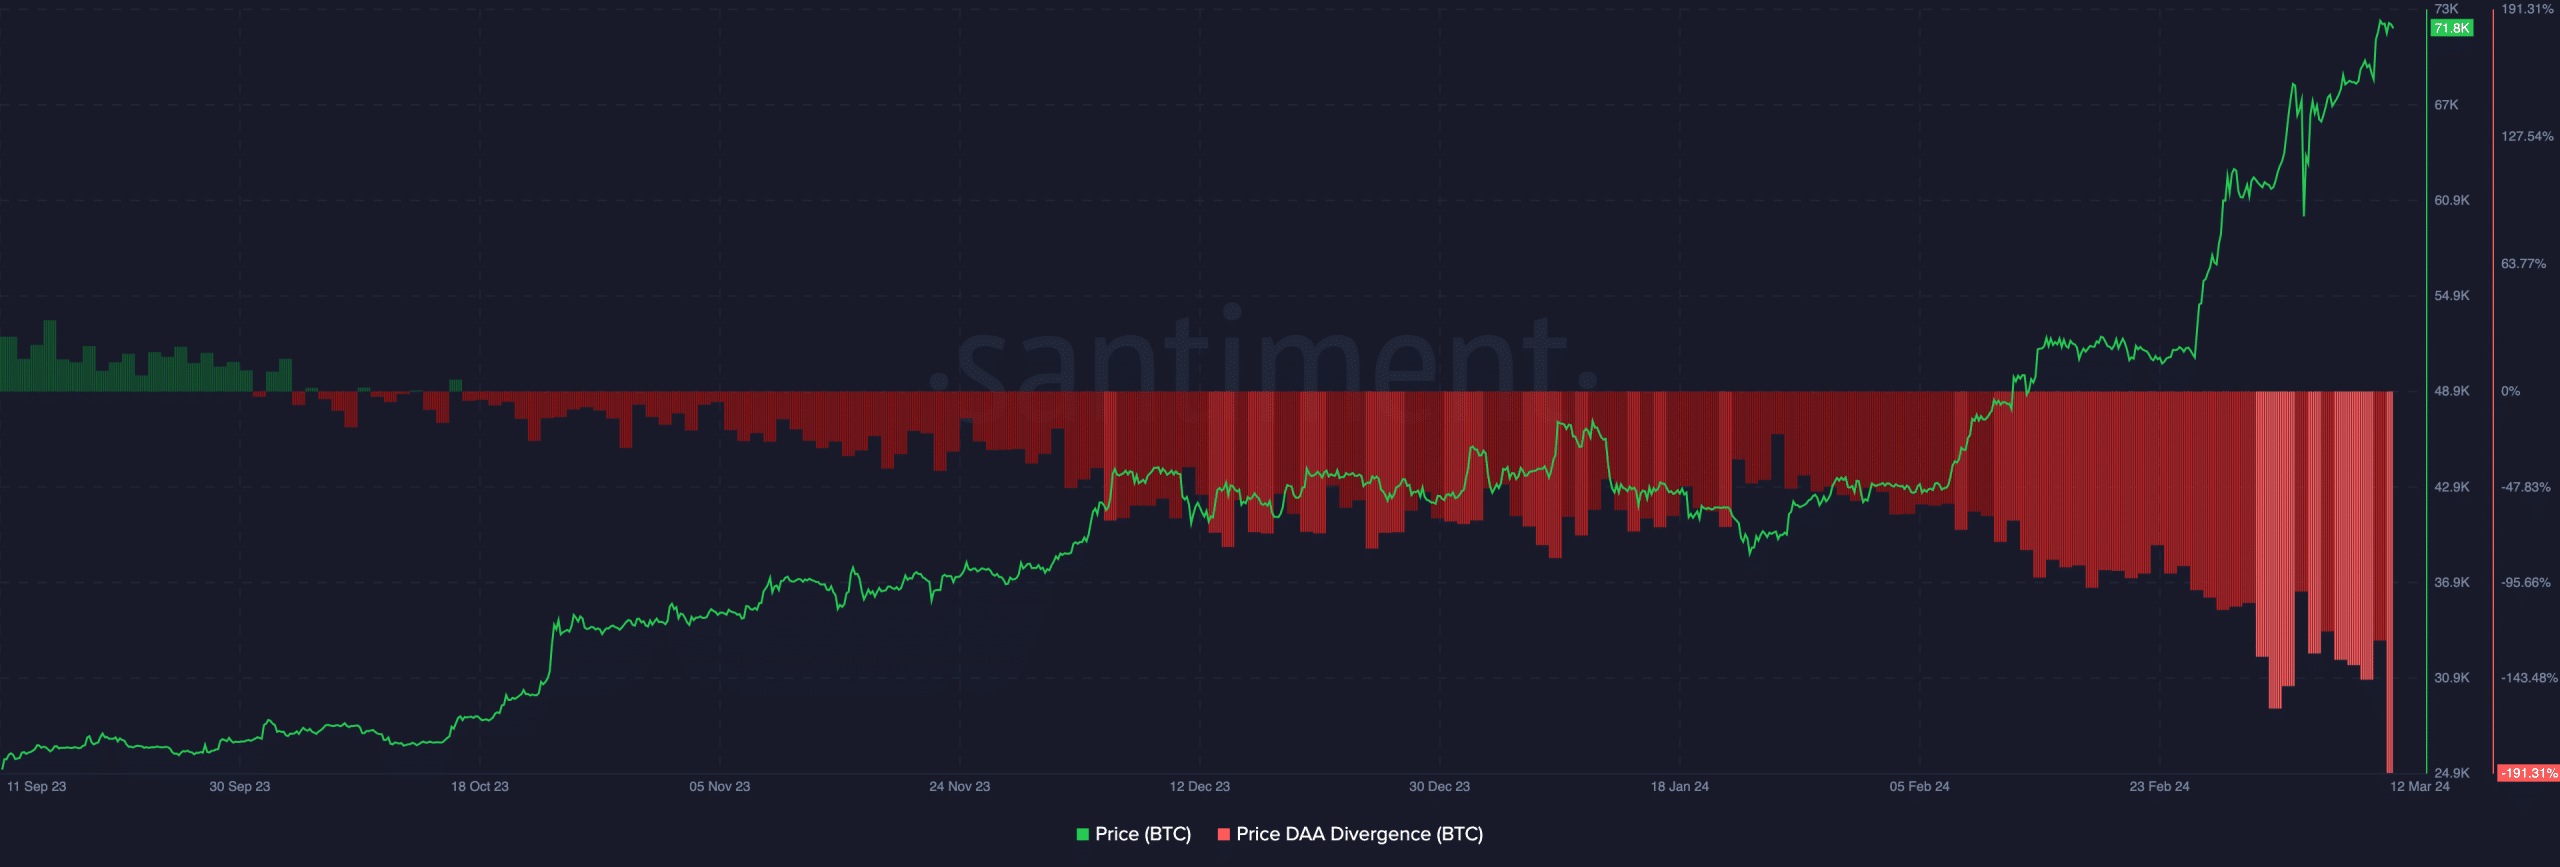
One metric we can always run to to give notable forecasts in a bull market is the price-DAA divergence. DAA stands for Daily Active Addresses. As such, the relationship between the price and Bitcoin’s DAA has been instrumental in highlighting market bottom and tops.
Thus, traders can use this to identify when to buy and the period to sell. At press time, on-chain data showed that the price-DAA was -191.31%. This means that the DAA had fallen much more than the price.
In simpler words, the threshold registered implied that despite BTC’s incredible surge, it has not been able to attract many new or retail investors.
From a trading point of view, this divergence could serve as a strong buy signal. Therefore, if activity on the Bitcoin network begins to reach impeccable heights, then the price might rise higher than $72,000.
However, it is important to note that this parameter might be best for short-term traders.
Another breakout seems close
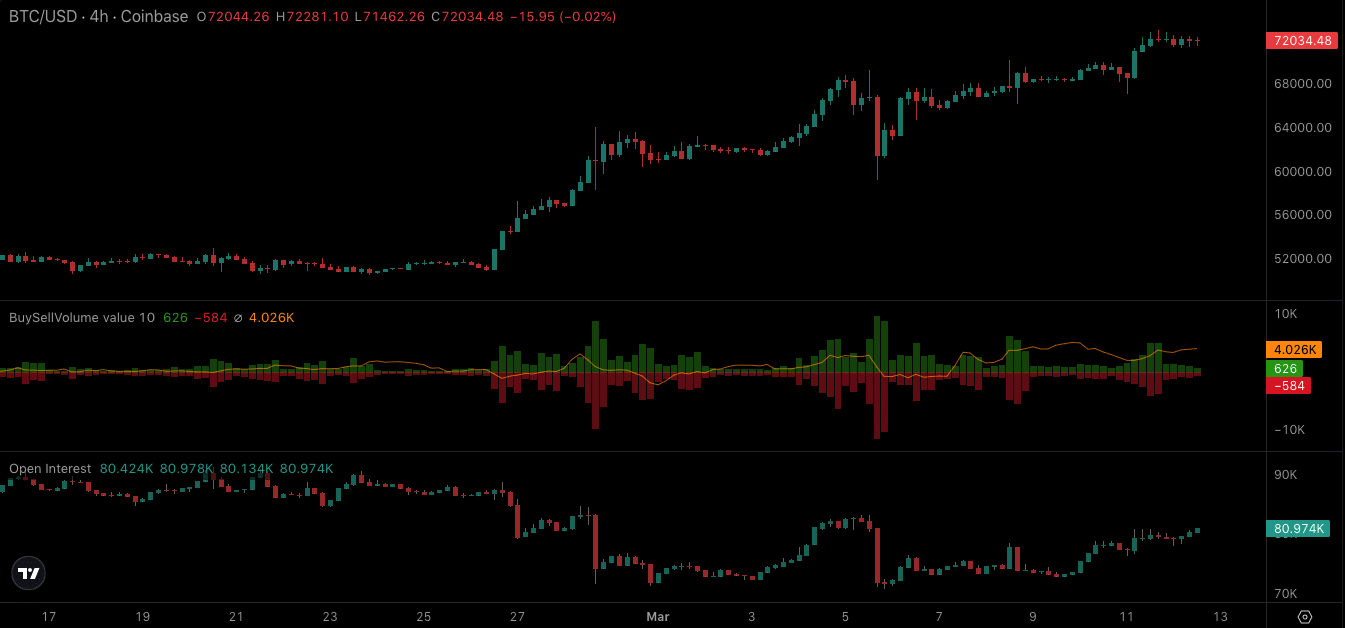
On the technical side, the buy BTC volume was much higher than the sell side. This indicates that the price might keep swinging towards $80,000 as sellers seem to be behind.
Besides that, the Open Interest (OI) has been increasing, indicating a surge in net positioning. Though the OI shows a 50-50 buyer-seller cohort, the increase implies that buyers were more aggressive.
Is your portfolio green? Check the BTC Profit Calculator
Price-wise, this rise in OI could be bullish for Bitcoin as the uptrend might gather more strength. If the OI continues to increase, a breakout candlestick might appear on the BTC/USD chart.
Should this be the case, shorts with high-leverage positions could face a wipeout. Though longs might profit from the potential rise, traders might need to watch out as volatility might be extreme.