Why BNB might be bound for a drop – And $461 could be the target!
BNB’s key indicator flagged a sell signal, which might push the coin’s price to $461.

- Market sentiment around BNB turned bearish in the last few days.
- Most metrics also looked bearish on the coin.
The bulls dominated the crypto market last week, allowing multiple cryptos to register price hikes.
However, things seemed to have been changing for BNB as a sell signal flashed on its chart. Let’s have a look at the coin’s state to better understand what to expect from it this week.
BNB’s price to plummet?
CoinMarketCap’s data revealed that the coin’s price had risen by more than 6% in the last seven days. But the last 24 hours were bearish as the coin’s chart turned red.
At the time of writing, BNB was trading at $577.01 with a market capitalization of over $84.2 billion, making it the 4th largest crypto. The recent price decline was not unforeseen.
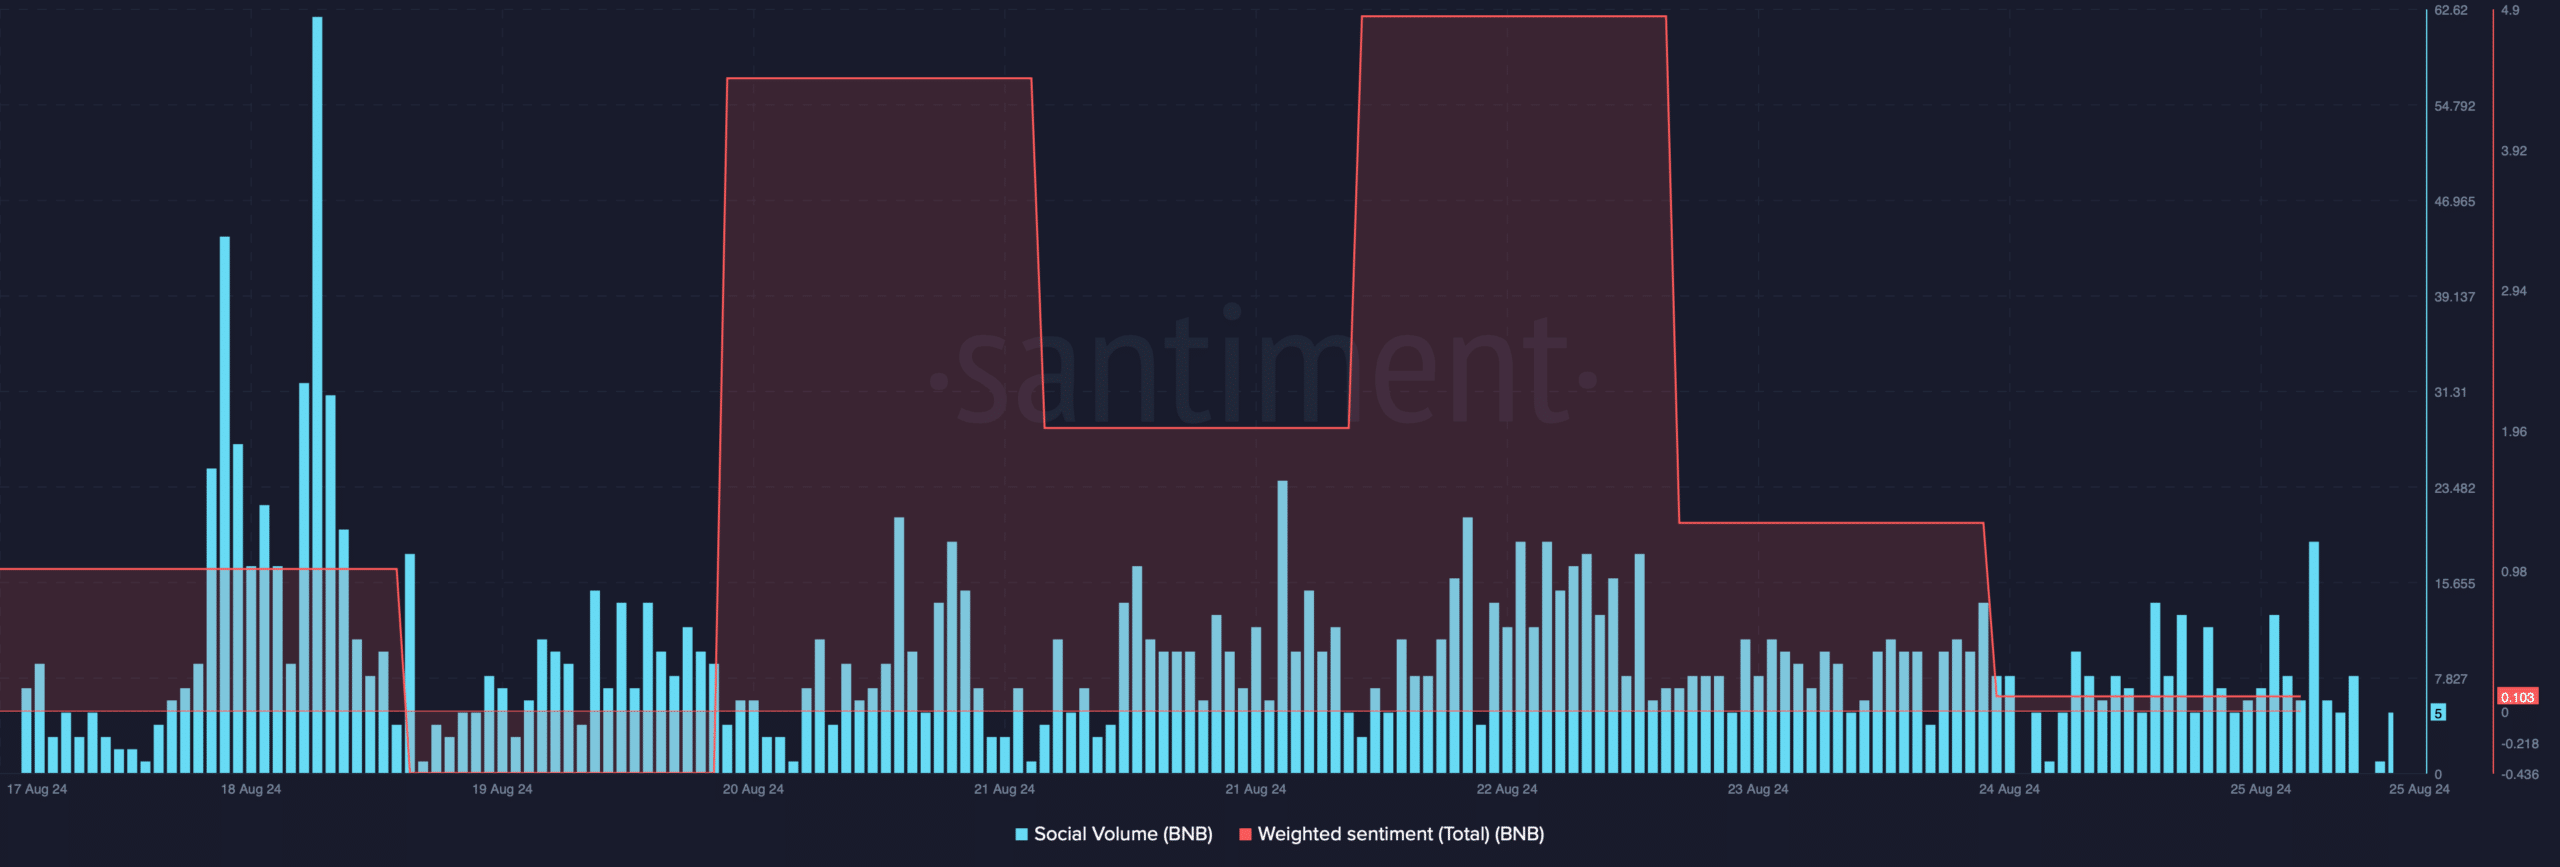
AMBCrypto’s look at Santiment’s data revealed that investors were losing confidence in BNB for the past few days, which was evident from the decline in its weighted sentiment. Its social volume also declined, reflecting a dip in its popularity.
In the meantime, Ali, a popular crypto analyst, posted a tweet hinting at a continued price decline. As per the tweet, BNB’s TD sequential flagged a sell signal.
Therefore, AMBCrypto dug deeper to find out where the coin’s price might drop in this fresh week.
A closer look at BNB’s state
AMBCrypto’s look at the coin’s fear and greed index revealed that the metric had a reading of 61% at press time, meaning that the market was in a “greed” phase.
Whenever the metric hits this level, it suggests that the chances of a price correction are high.
Apart from that, Coinglass’ data pointed out yet another bearish signal. As per our look, BNB’s long/short ratio registered a sharp downtick. This meant that there were more short positions in the market than long positions, indicating a rise in bearish sentiment around the coin.

Hyblock Capital’s data revealed that BB’s whale vs retail delta dropped from 61 to 19, suggesting that whales were having less exposure in the market.
For starters, this indicator ranges from -100 to 100, with 0 representing whales and retail positioned exactly the same.

Realistic or not, here BNB’s market cap in BTC’s terms
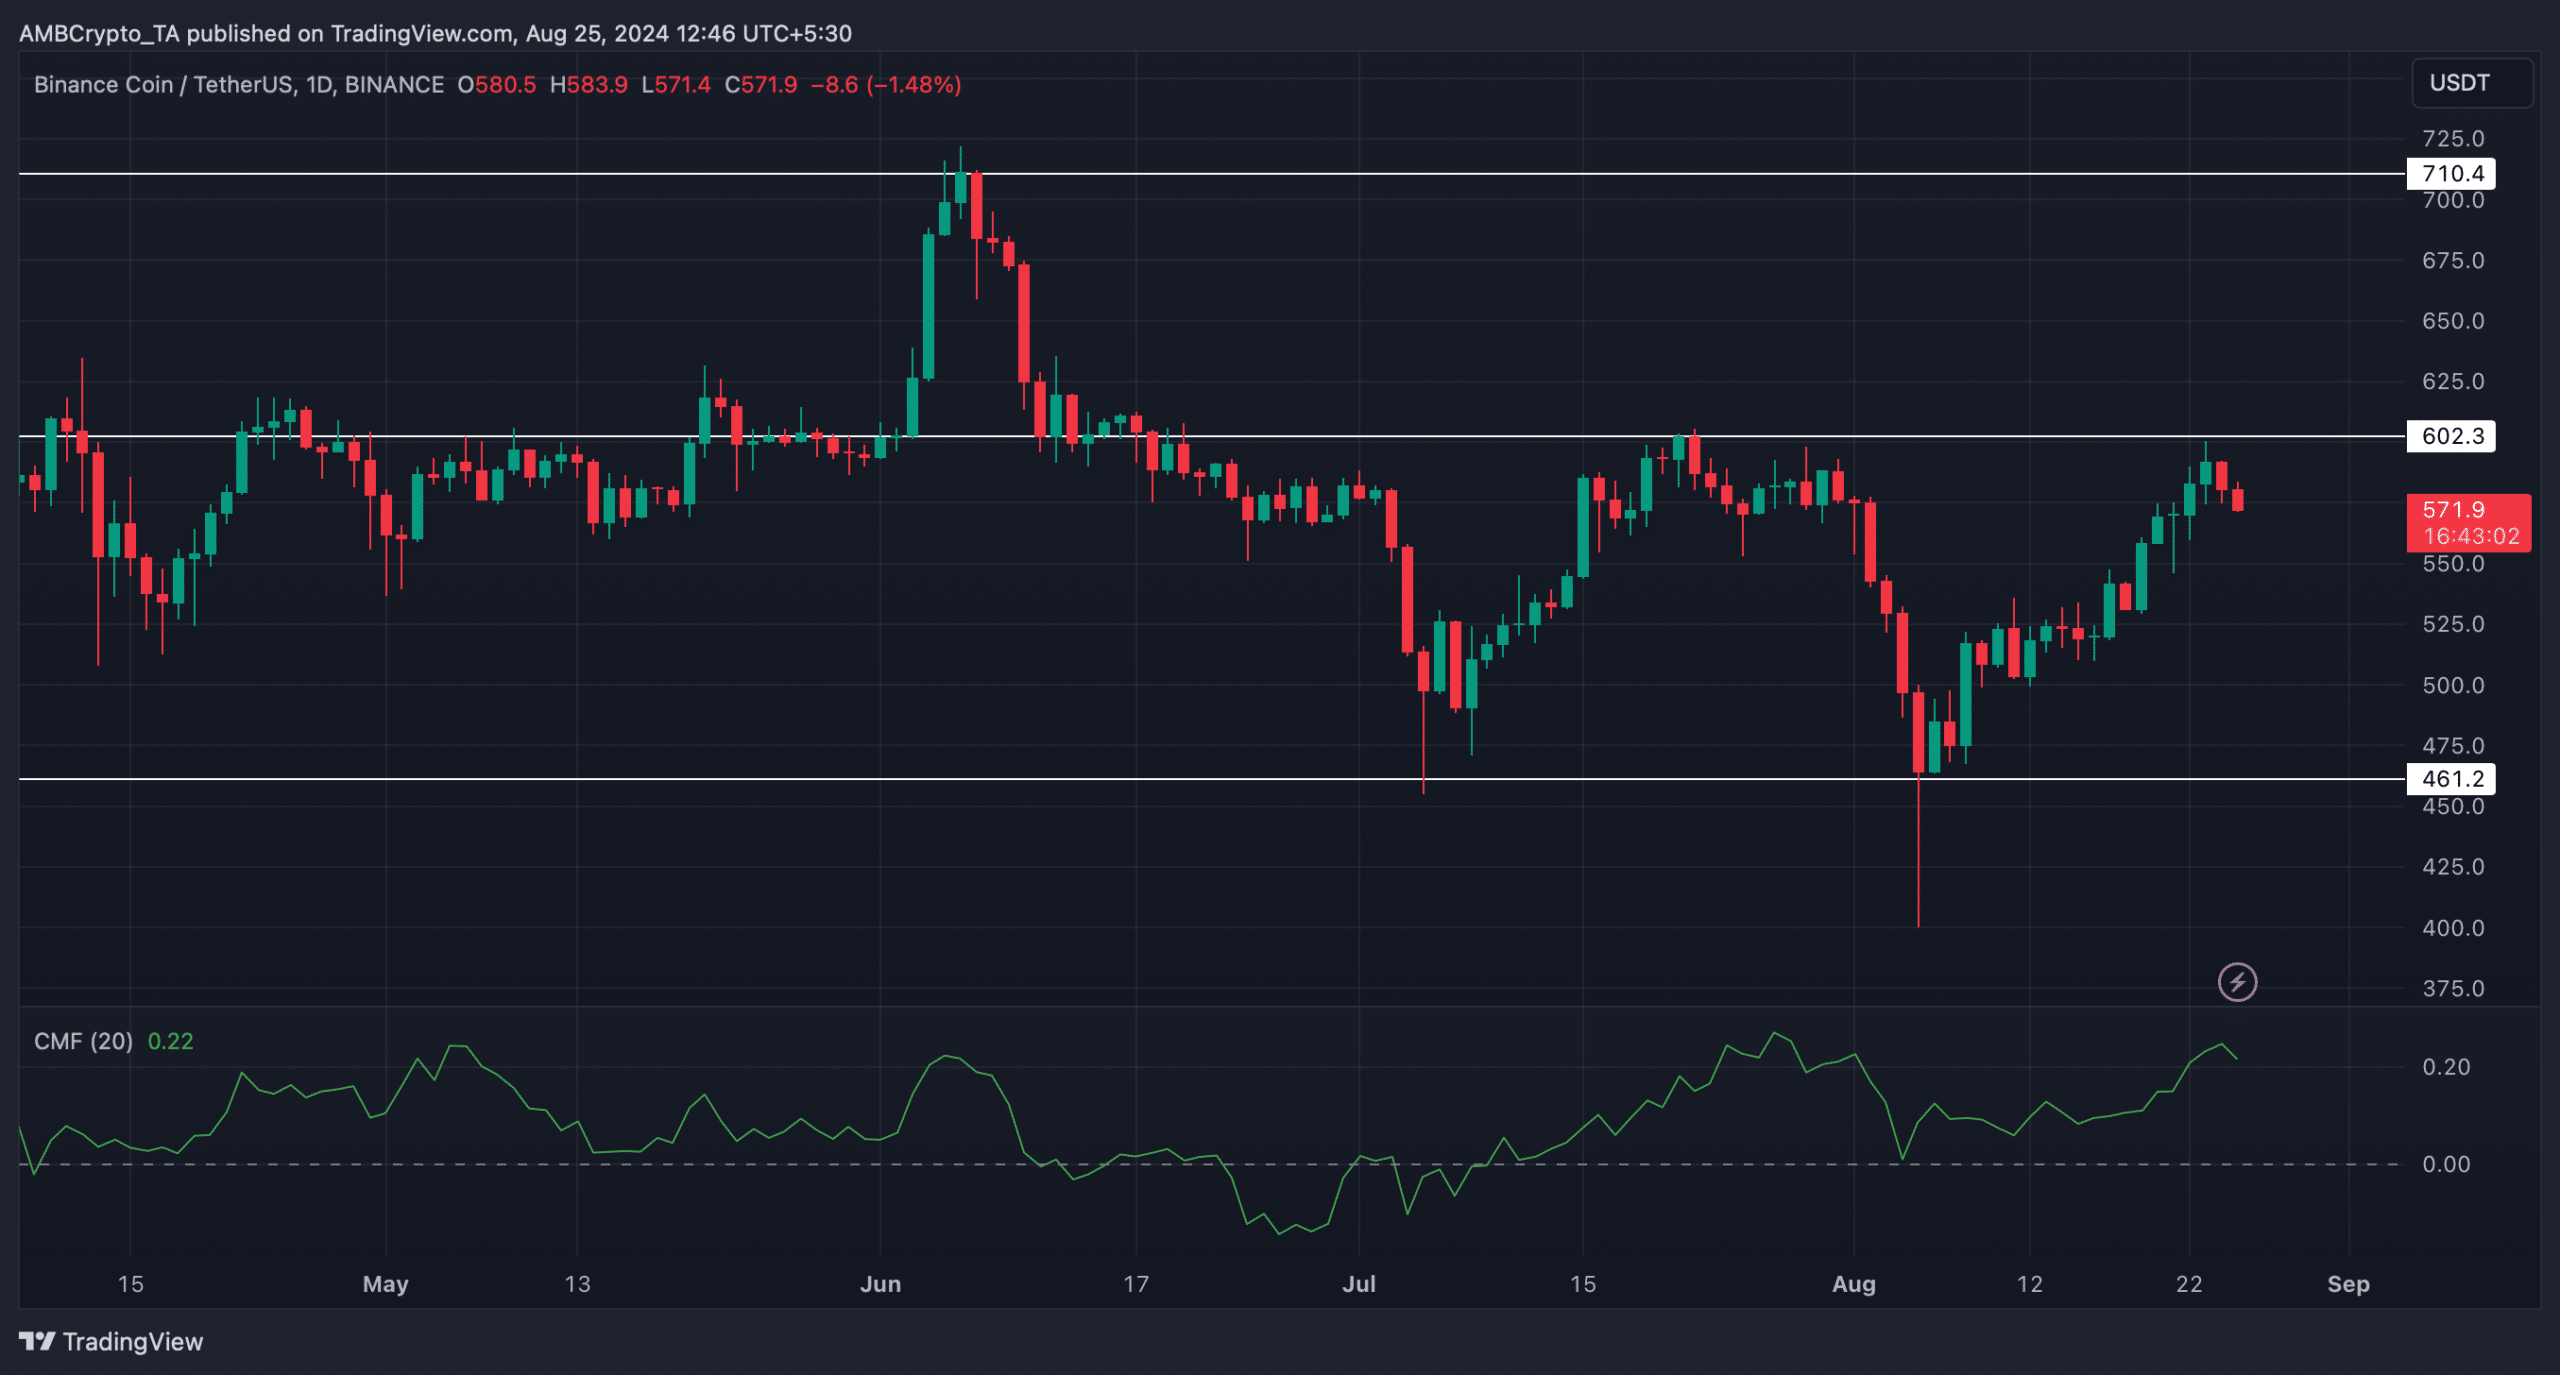
Therefore, we then assessed the coin’s daily chart. We found that BNB was rejected to go adobe its resistance at $602.3.
Its Chaikin Money Flow (CMF) registered a downtick, hinting at a continued price decline in the coming days. If that happens, then it won’t be surprising to watch the coin plummeting to $461.