Cardano: A close below this mark would bolster a further pullback

Cardano (ADA) has been on a near-term downtrend after recently breaking down from the ascending channel on its 4-hour chart. Meanwhile, it found a base at its vital $1.02-support.
If the 20 EMA (red) falls below the 200 EMA (green), ADA looked at a further downfall in the coming days. While the Bollinger Bands (BB) refrained from high volatility, the alt could see a bullish resurgence from the $0.9-$1 zone. At press time, ADA was trading at $1.033.
ADA 4-hour Chart
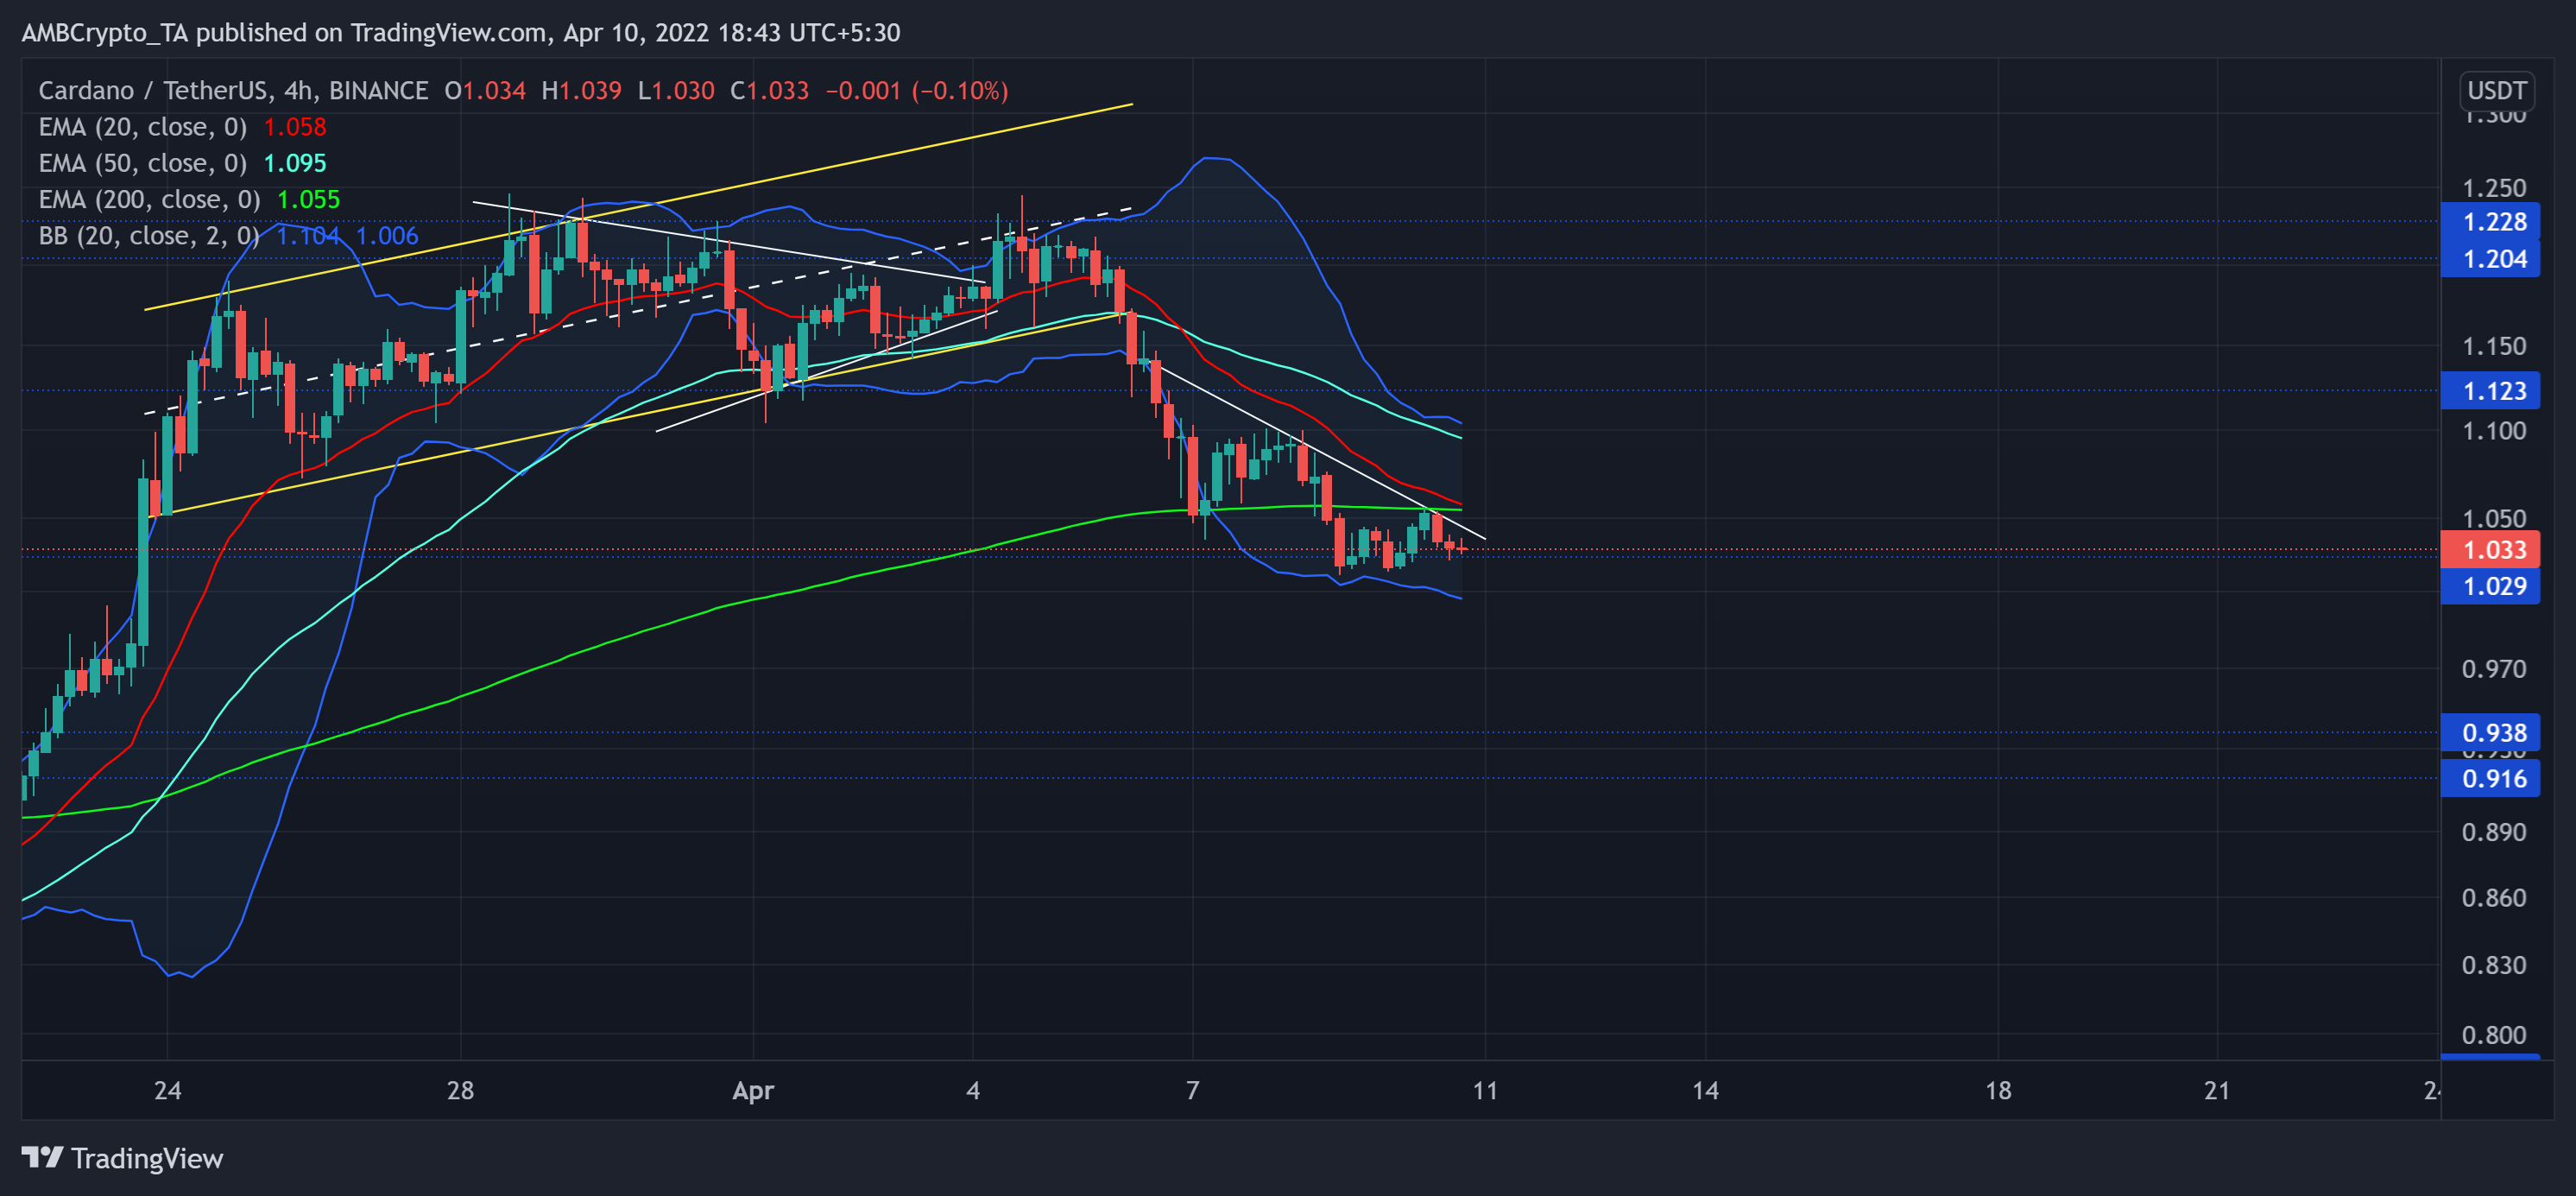
The latest bullish phase saw an unrestrained rally from its mid-March lows. It was up by over 58% from these lows until 31 march. During this phase, ADA tested the $1.2-resistance and formed an ascending channel (yellow) on its 4-hour chart. As a result, it broke down from the pattern while the buyers defended the $1.02-level.
The 6 April sell-off fueled its bearish inclinations as it recorded losses of 15% in the last five days. Thus, its price action fell below its 20/50/200 EMA and traded near the lower band of the Bollinger Bands (BB).
As the sellers flipped the 200 EMA from support to immediate resistance, the buyers needed to ensure the $1.02-level. A close below this mark would bolster a further pullback towards the $0.9-zone. For the bulls to reignite their hopes for a trend change, they needed to amplify the current trading volumes and reclaim the 200 EMA level.
Rationale
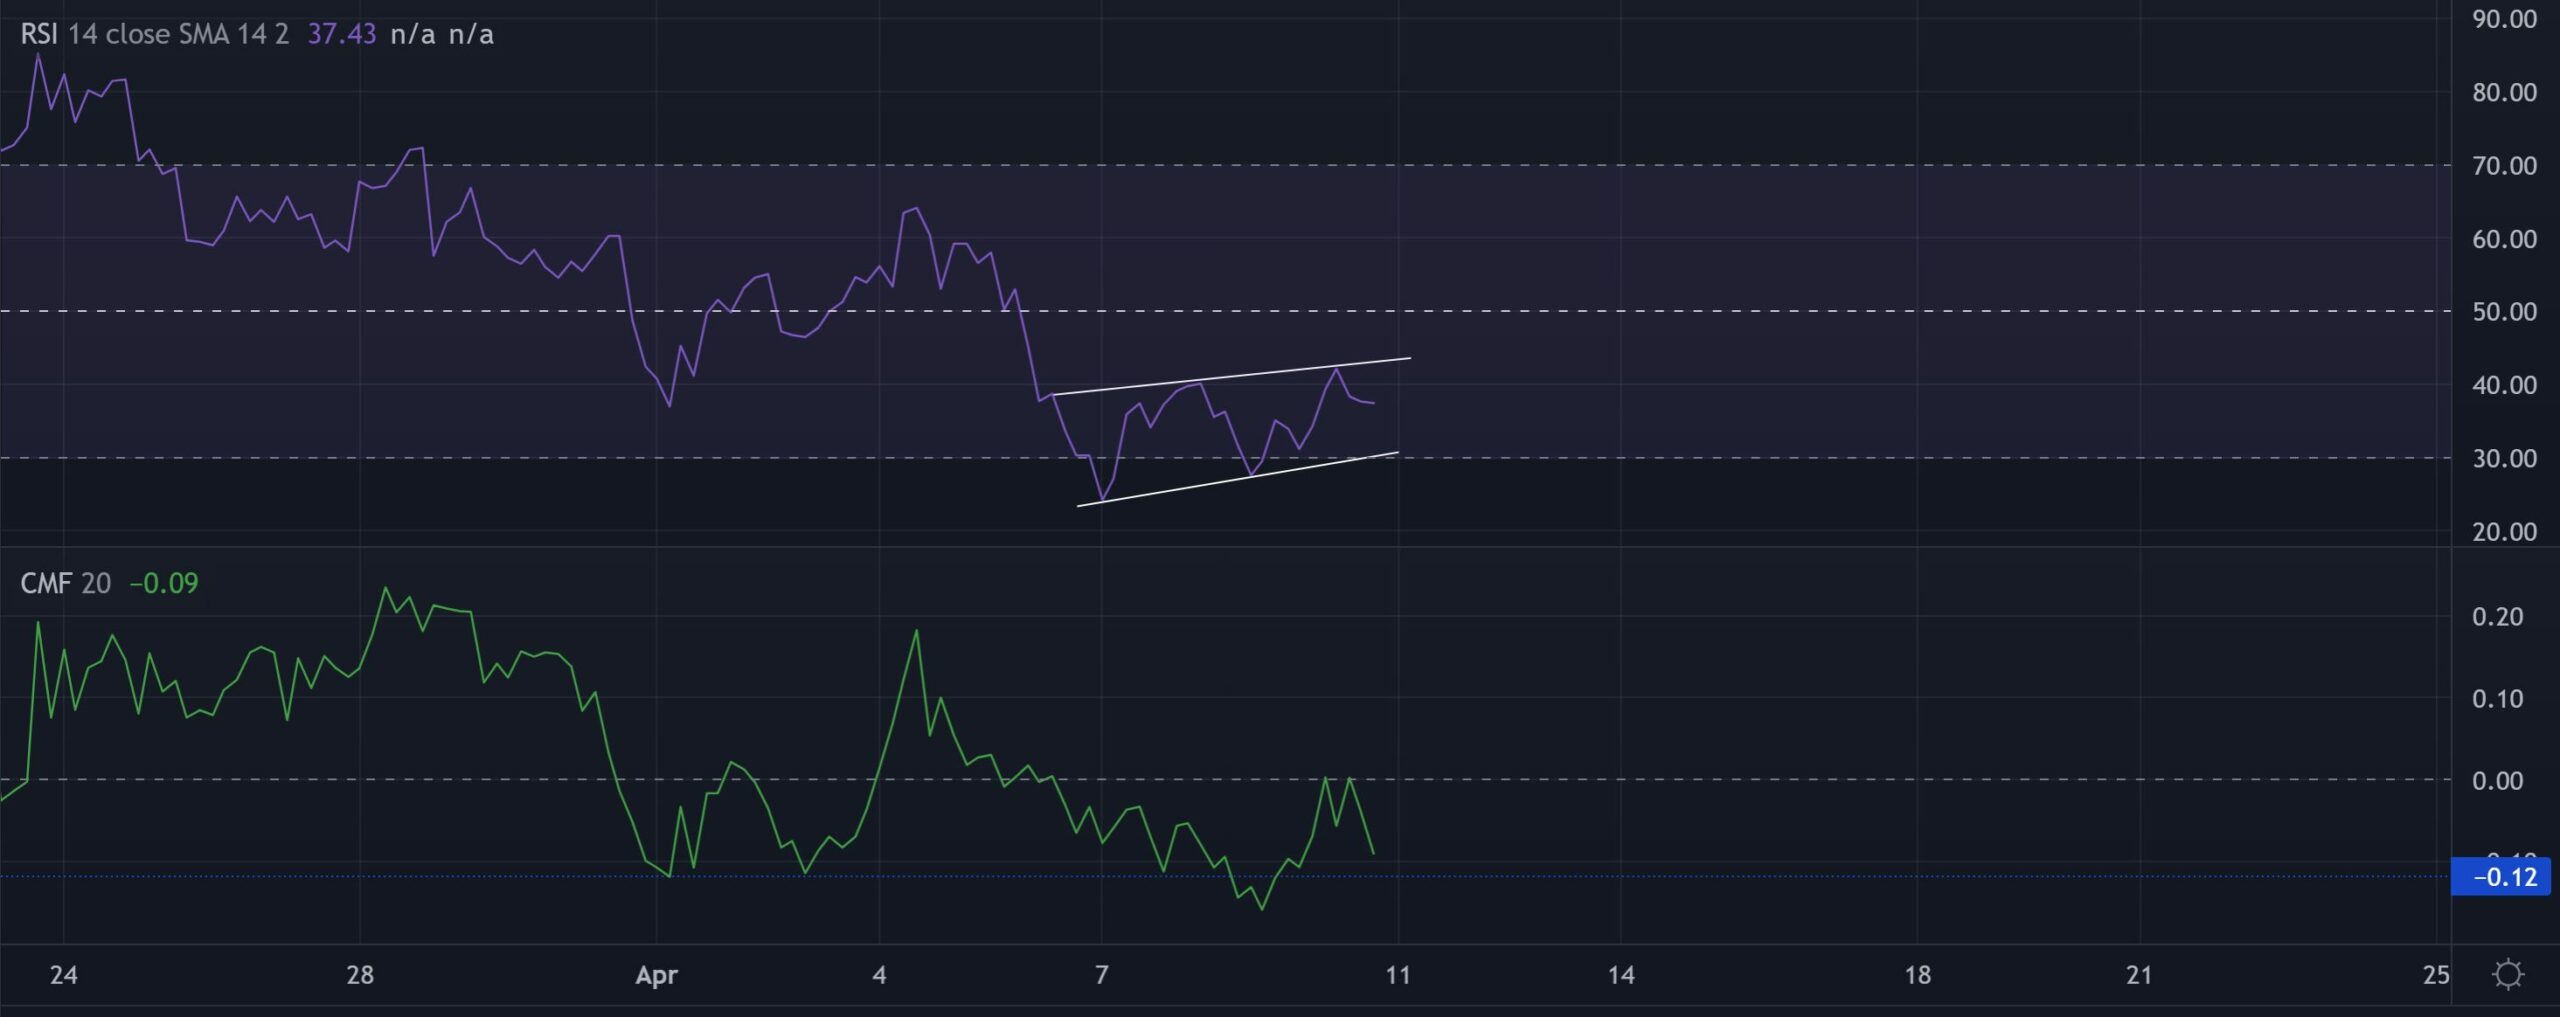
The RSI has been on a rather slow recovery from 7 April. Since then, however, the price has been on a downslide. Thus, revealing a possible hidden bearish divergence should the RSI fall from its immediate trendline resistance. At the very least, these readings exhibited a bearish inclination in the short term.
Also, the CMF looked south and affirmed the decreasing money volumes on the 4-hour timeframe. The 0.12-mark would be critical for the buyers to uphold to prevent a further fall.
Conclusion
Considering the potential of a hidden bearish divergence and weak readings on its BB, ADA could see a gradual pullback while continuing its squeeze phase. Should the 20 EMA refrain from jumping below the 200 EMA, the bulls could propel a revival.
Finally, investors/traders should watch out for Bitcoin’s movement as ADA shares a 96% 30-day correlation with the king coin.


