ChainLink
Why Chainlink’s OI approaching a 3-month high isn’t all good news
LINK’s rising OI seems like good news on paper, but you should read further to know more!


- Chainlink’s Open Interest rose to a three-month high of $206M
- A descending triangle pattern on the daily chart highlighted a prevailing bearish trend
Chainlink (LINK), at the time of writing, was showing signs of a weakening uptrend. LINK was trading at $11.38 after falling by 0.6%. This, despite a 4% rally over the last seven days. In fact, spot trading volumes also fell by around 9% – A sign of declining interest in the altcoin.
On the contrary, a look at the Futures market revealed that more traders have opened positions on LINK lately. Open Interest (OI) jumped to a 13-week high of $206M – A sign of heightened activity among derivative traders as they speculate on future price movements.
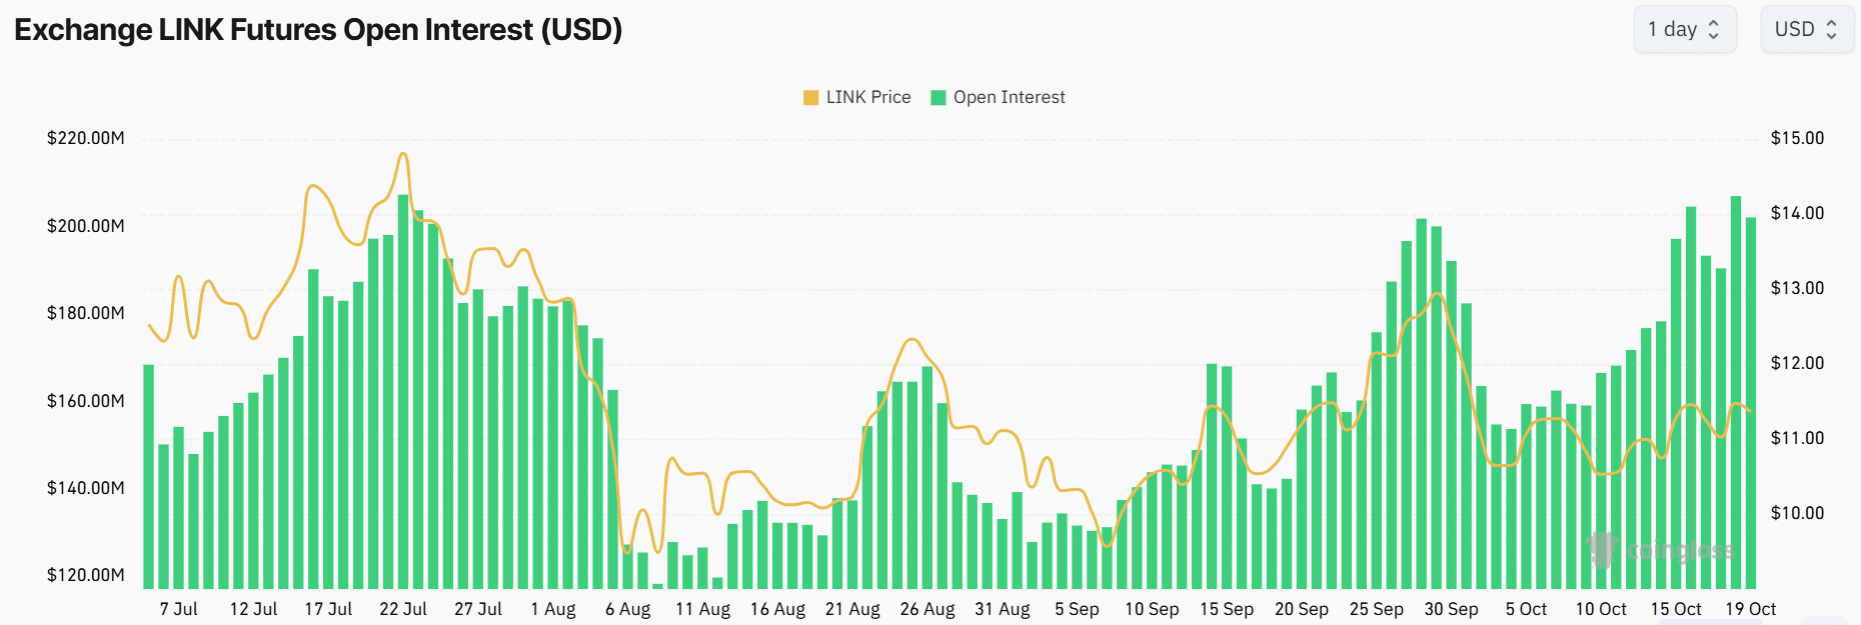
Source: Coinglass
Worth noting, however, that this spike in OI has often preceded a fall in LINK’s prices. For instance, the last time LINK’s OI was at this level on 22 July. The altcoin’s price dropped by 45% within just two weeks.
In late September, LINK’s OI shot up to a two-month high again, before the price dropped by nearly 20%.
Therefore, if Chainlink follows its historical trends, a bearish sentiment could soon come into play.
Chainlink flashes bullish signals
On the daily chart, LINK’s Relative Strength Index stood at 52 – A near-neutral level which suggested that buyers are slightly more than sellers. The RSI line was above the Signal line, suggesting that bullish momentum may be in play.
However, at press time, this line seemed to be tipping south – A sign that sellers have been entering the market.
This weak bullish sentiment was further evidenced by the Awesome Oscillator’s (AO) bars. While the bars were green, they remained negative – Highlighting a lack of enough buyers to support an uptrend.
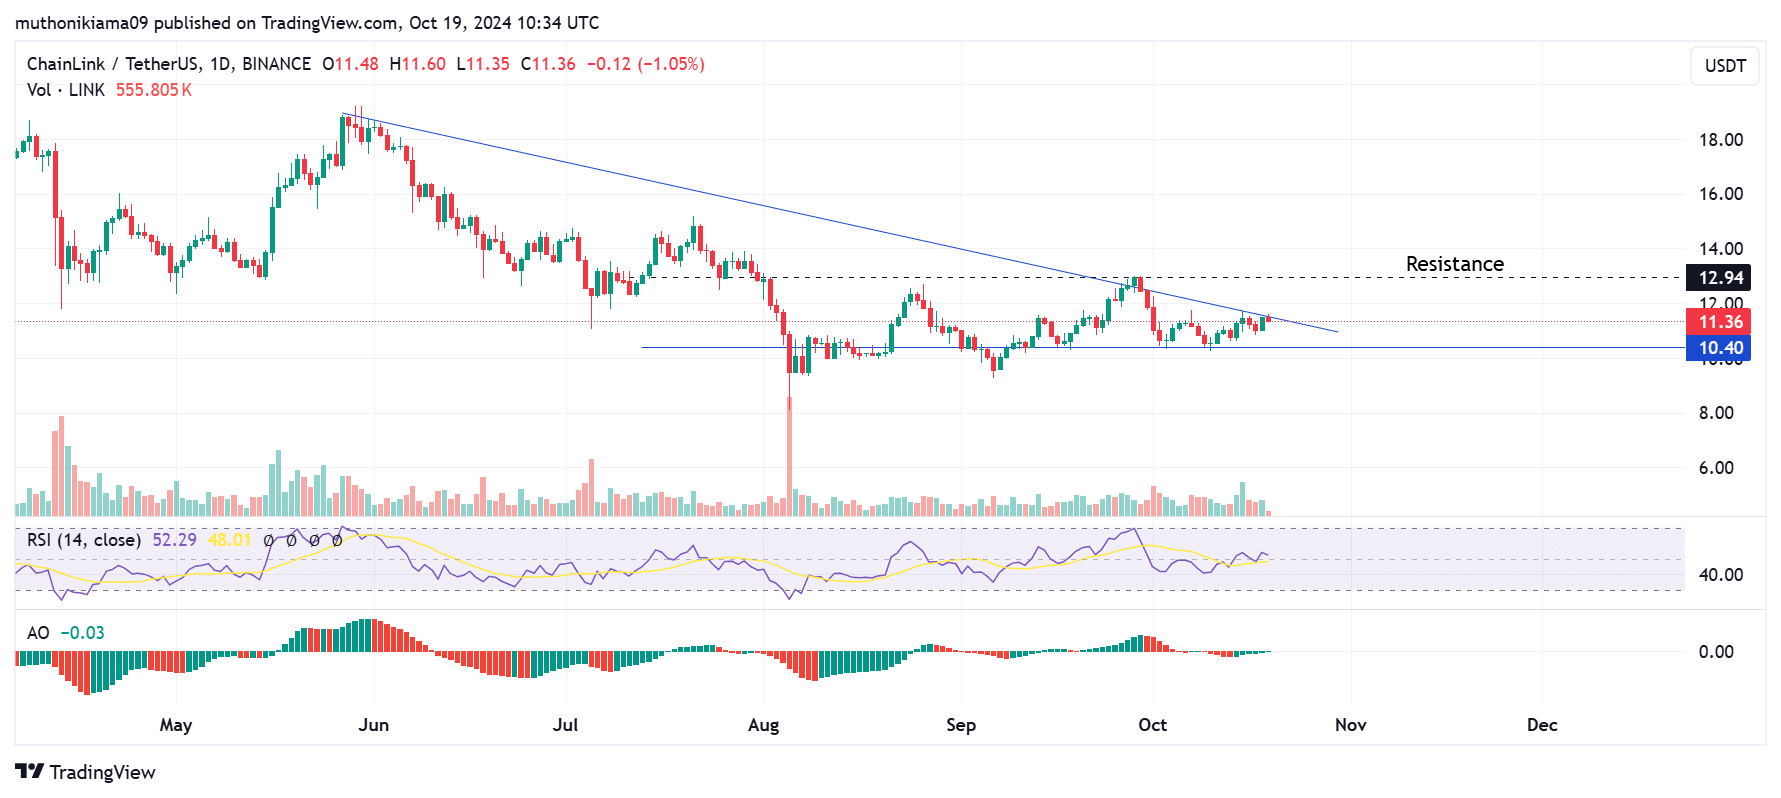
Source: Tradingview
LINK also formed a descending triangle pattern, which usually alluded to a bearish continuation. The altcoin, at press time, was trading at the upper boundary of this channel, showing that bulls have been attempting to take control.
However, a breakout is often accompanied by high buying volumes. In fact, the volume histogram bars revealed that buyers have been few, amid bouts of selling activity.
If buyers re-enter the market and LINK
invalidates this bearish thesis, the next resistance would lie at $12.94. Conversely, if the bearish trend persists, LINK will likely drop to test support at $10.40.One of the catalysts needed to support LINK’s uptrend is whale activity. Large transaction volumes spiked earlier this week to $100M. At press time, these volumes had dropped to $36M – A sign that whales are now inactive. This could soon result in suppressed price performance on the charts.
(Source: IntoTheBlock)