
- LINK’s price dropped by over 11% in the last seven days.
- A successful breakout might allow LINK to touch $22.
Chainlink [LINK], like most other cryptos, failed to earn investors profits last week as its charts remained red. But the scenario might change in this fresh week, as the token was on the verge of breaking out of a bullish pattern.
Chainlink’s possible breakout
CoinMarketCap’s data revealed that LINK’s price declined by more than 11% in the last seven days. In fact, in the last 24 hours alone, the token’s value dropped by over 3%.
At the time of writing, LINK was trading at $14.27 with a market capitalization of over $8 billion.
Separately, IntoTheBlock’s data revealed that only 45% of LINK investors were in profit, which can be somewhat attributed to the latest double-digit weekly price decline.
AMBCrypto’s analysis of Santiment’s data revealed that the bearish price action had a negative impact on the token’s social metrics. For instance, Chainlink’s weighted sentiment remained in the negative zone.
This meant that bearish sentiment around the token was dominant in the market. Additionally, its social volume also declined, reflecting a dip in LINK’s popularity.
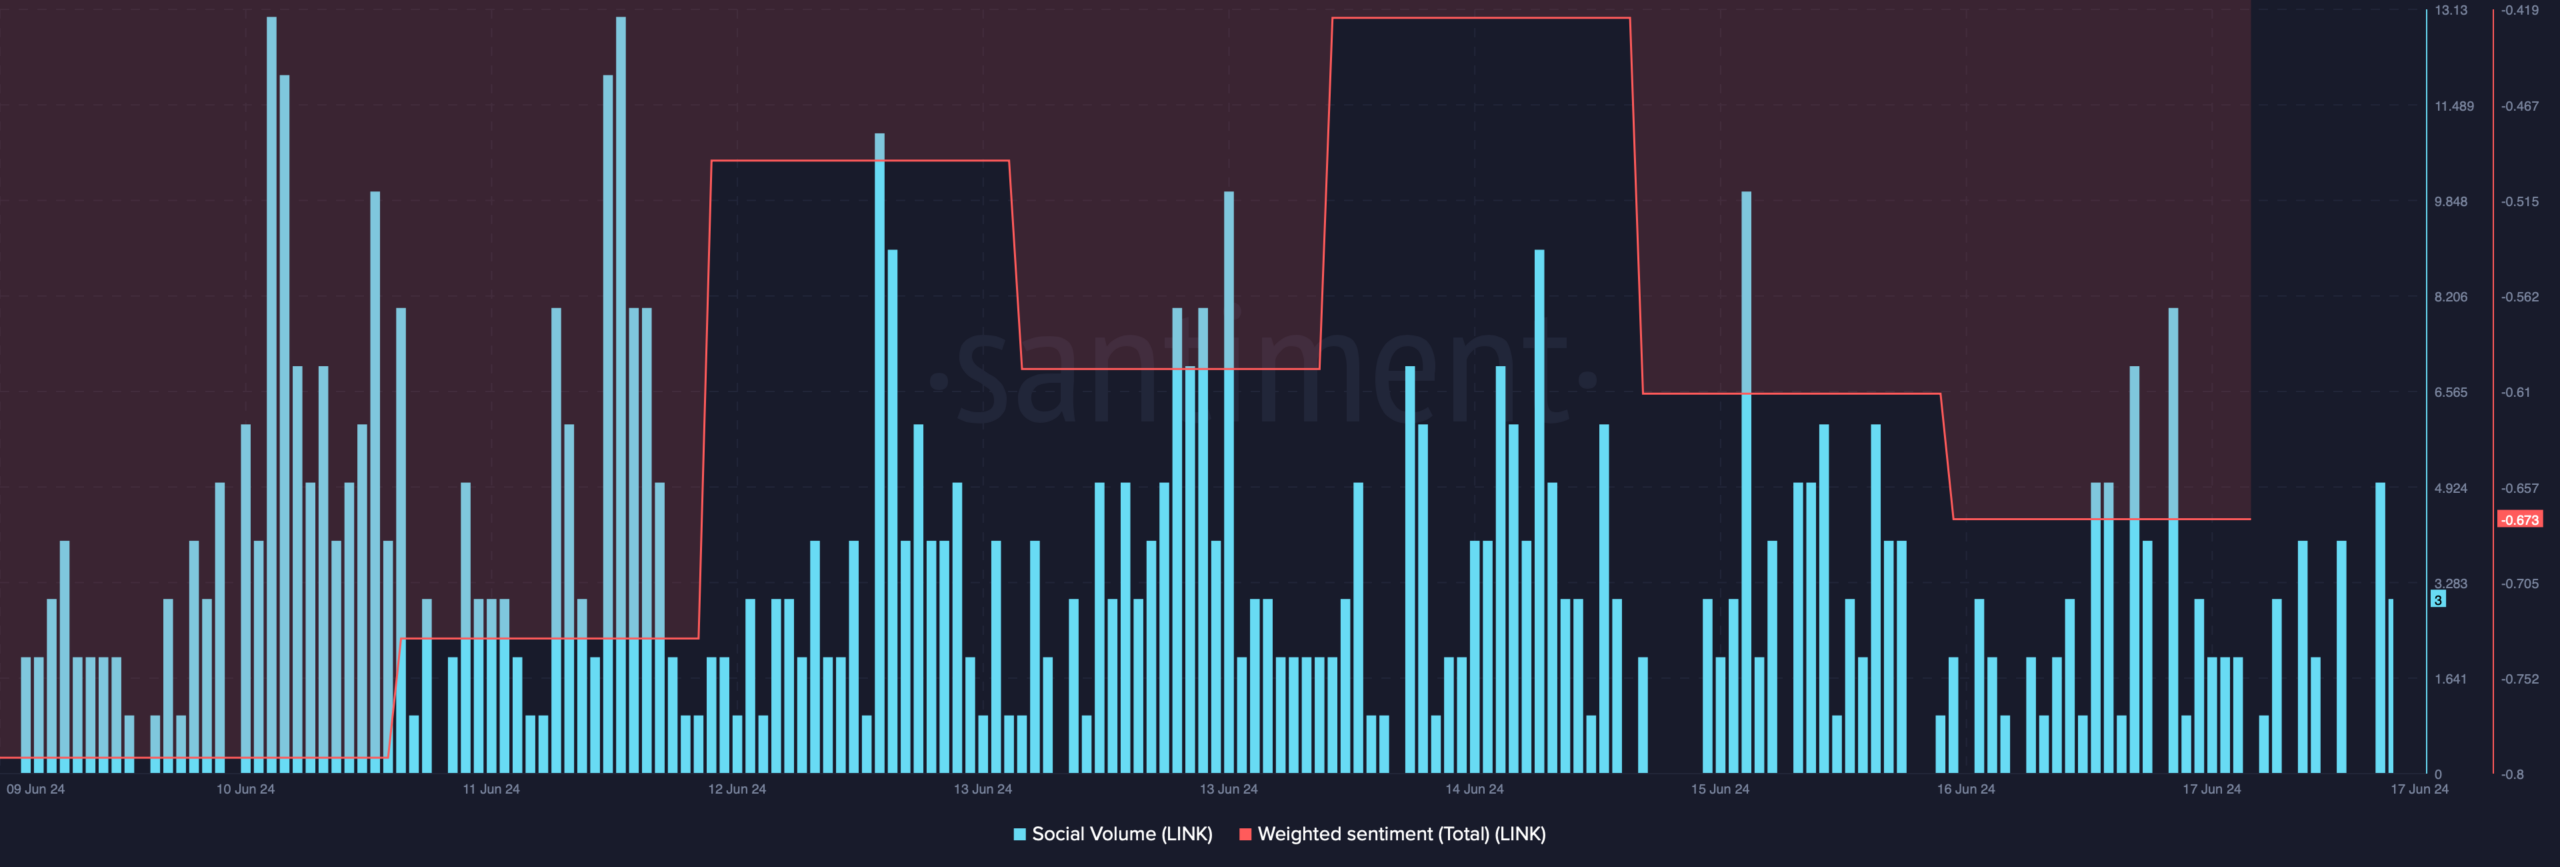
Source: Santiment
However, investors must not get disheartened, as there are chances for the trend to change.
World Of Charts, a popular cryptocurrency analyst, recently posted a tweet highlighting a bullish falling wedge pattern on LINK’s price chart.
As per the tweet, LINK is on the verge of breaking out of the pattern, which might result in a 32% price rise. If that happens, then investors might witness LINK touching $22 soon.
Is a bull rally possible?
AMBCrypto then analyzed the token’s on-chain data to see whether it supported the possibility of a bullish breakout.
We found that investors were not willing to sell or buy Link. Both LINK’s supply-on-exchanges and supply-outside-exchanges graphs remained closely knit, reflecting less activity.
The whales also didn’t make any big moves as the supply held by the top addresses graph remained flat.
Moreover, Chainlink’s network growth somewhat dropped. This meant that fewer addresses were created to transfer the token last week.
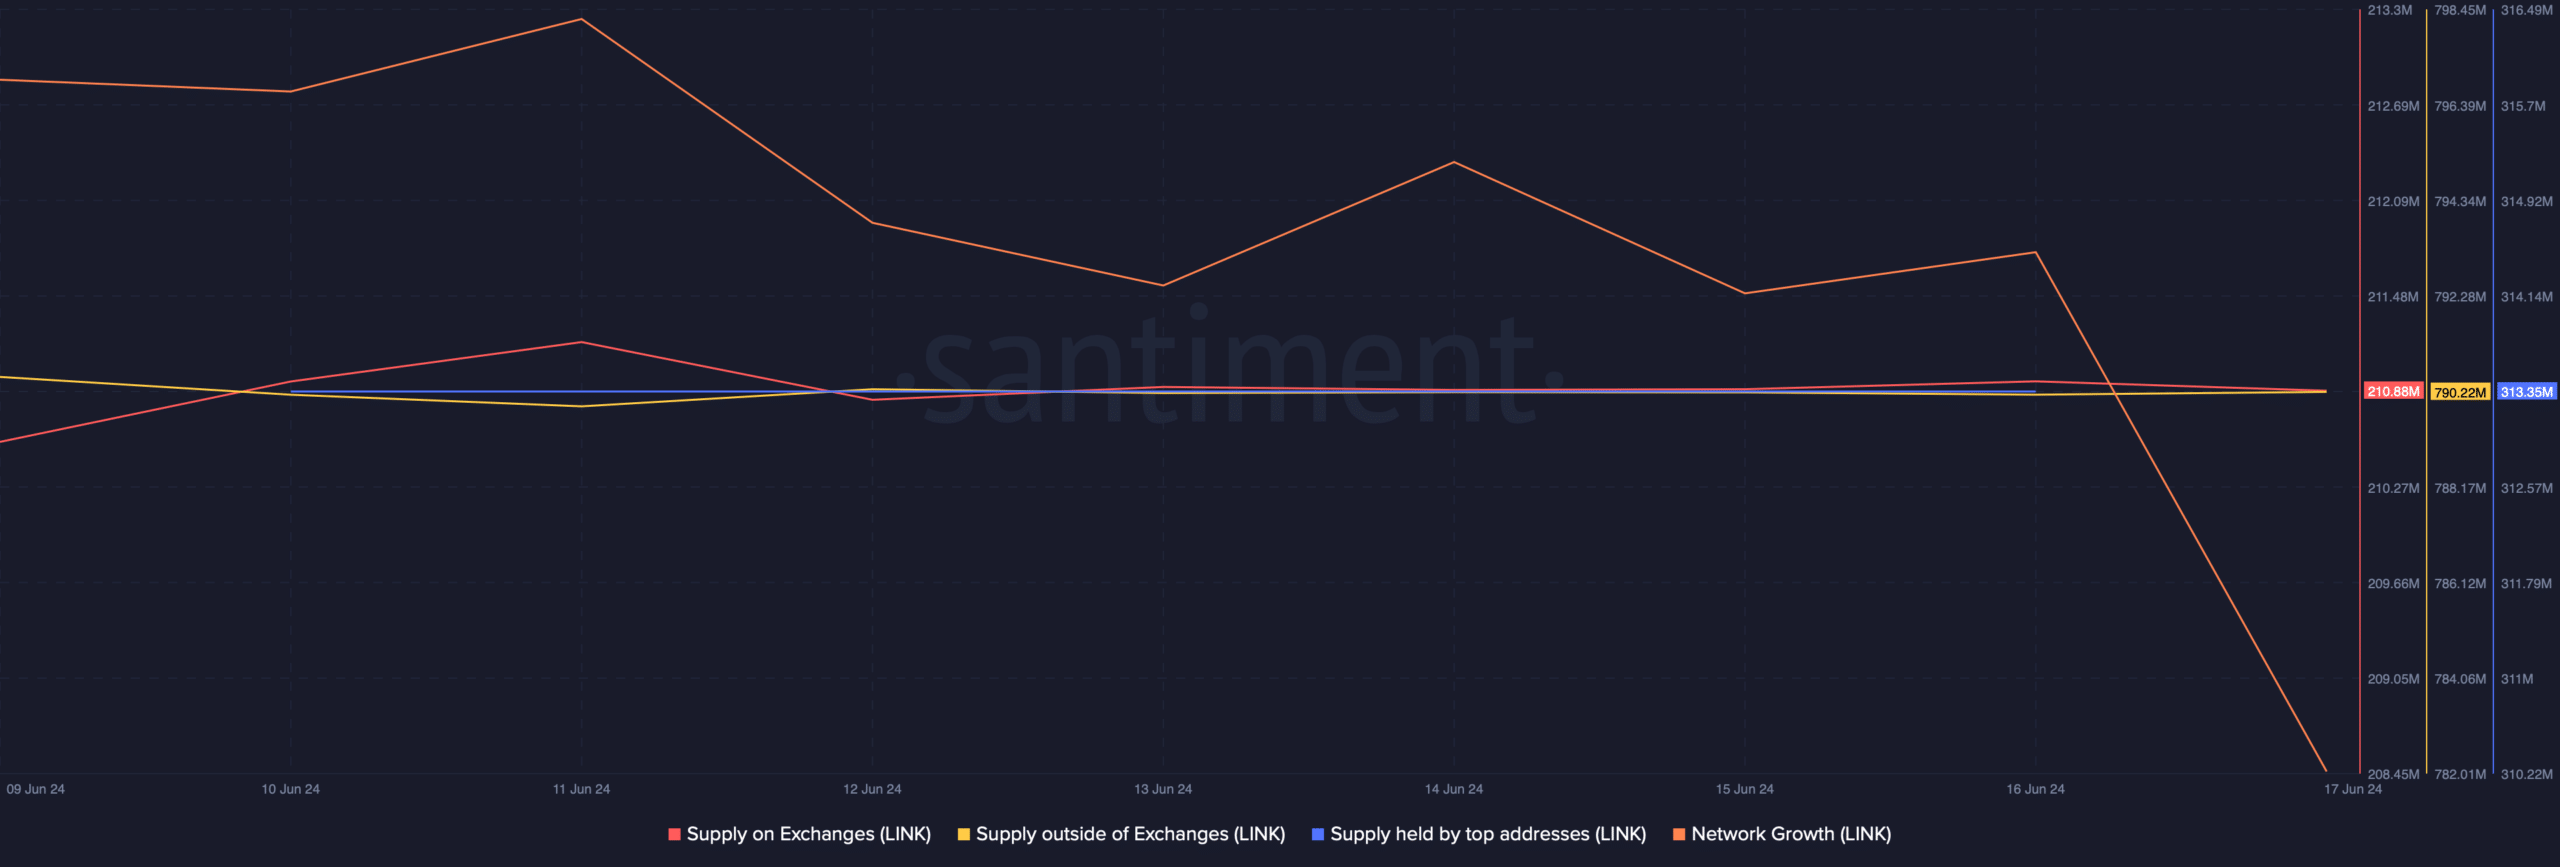
Source: Santiment
We then took a look at LINK’s daily chart to better understand whether a bull rally was possible.
As per our analysis, LINK’s Relative Strength Index (RSI) registered a downtick. The Chaikin Money Flow (CMF) also followed a similar declining trend, hinting at a further price drop in the coming days.
Realistic or not, here’s LINK market cap in BTC’s terms
If this bearish price trend continues, then LINK might soon plummet to its support level of $12.9.
Nonetheless, the Money Flow Index (MFI) was slightly bullish as it made a northward movement.
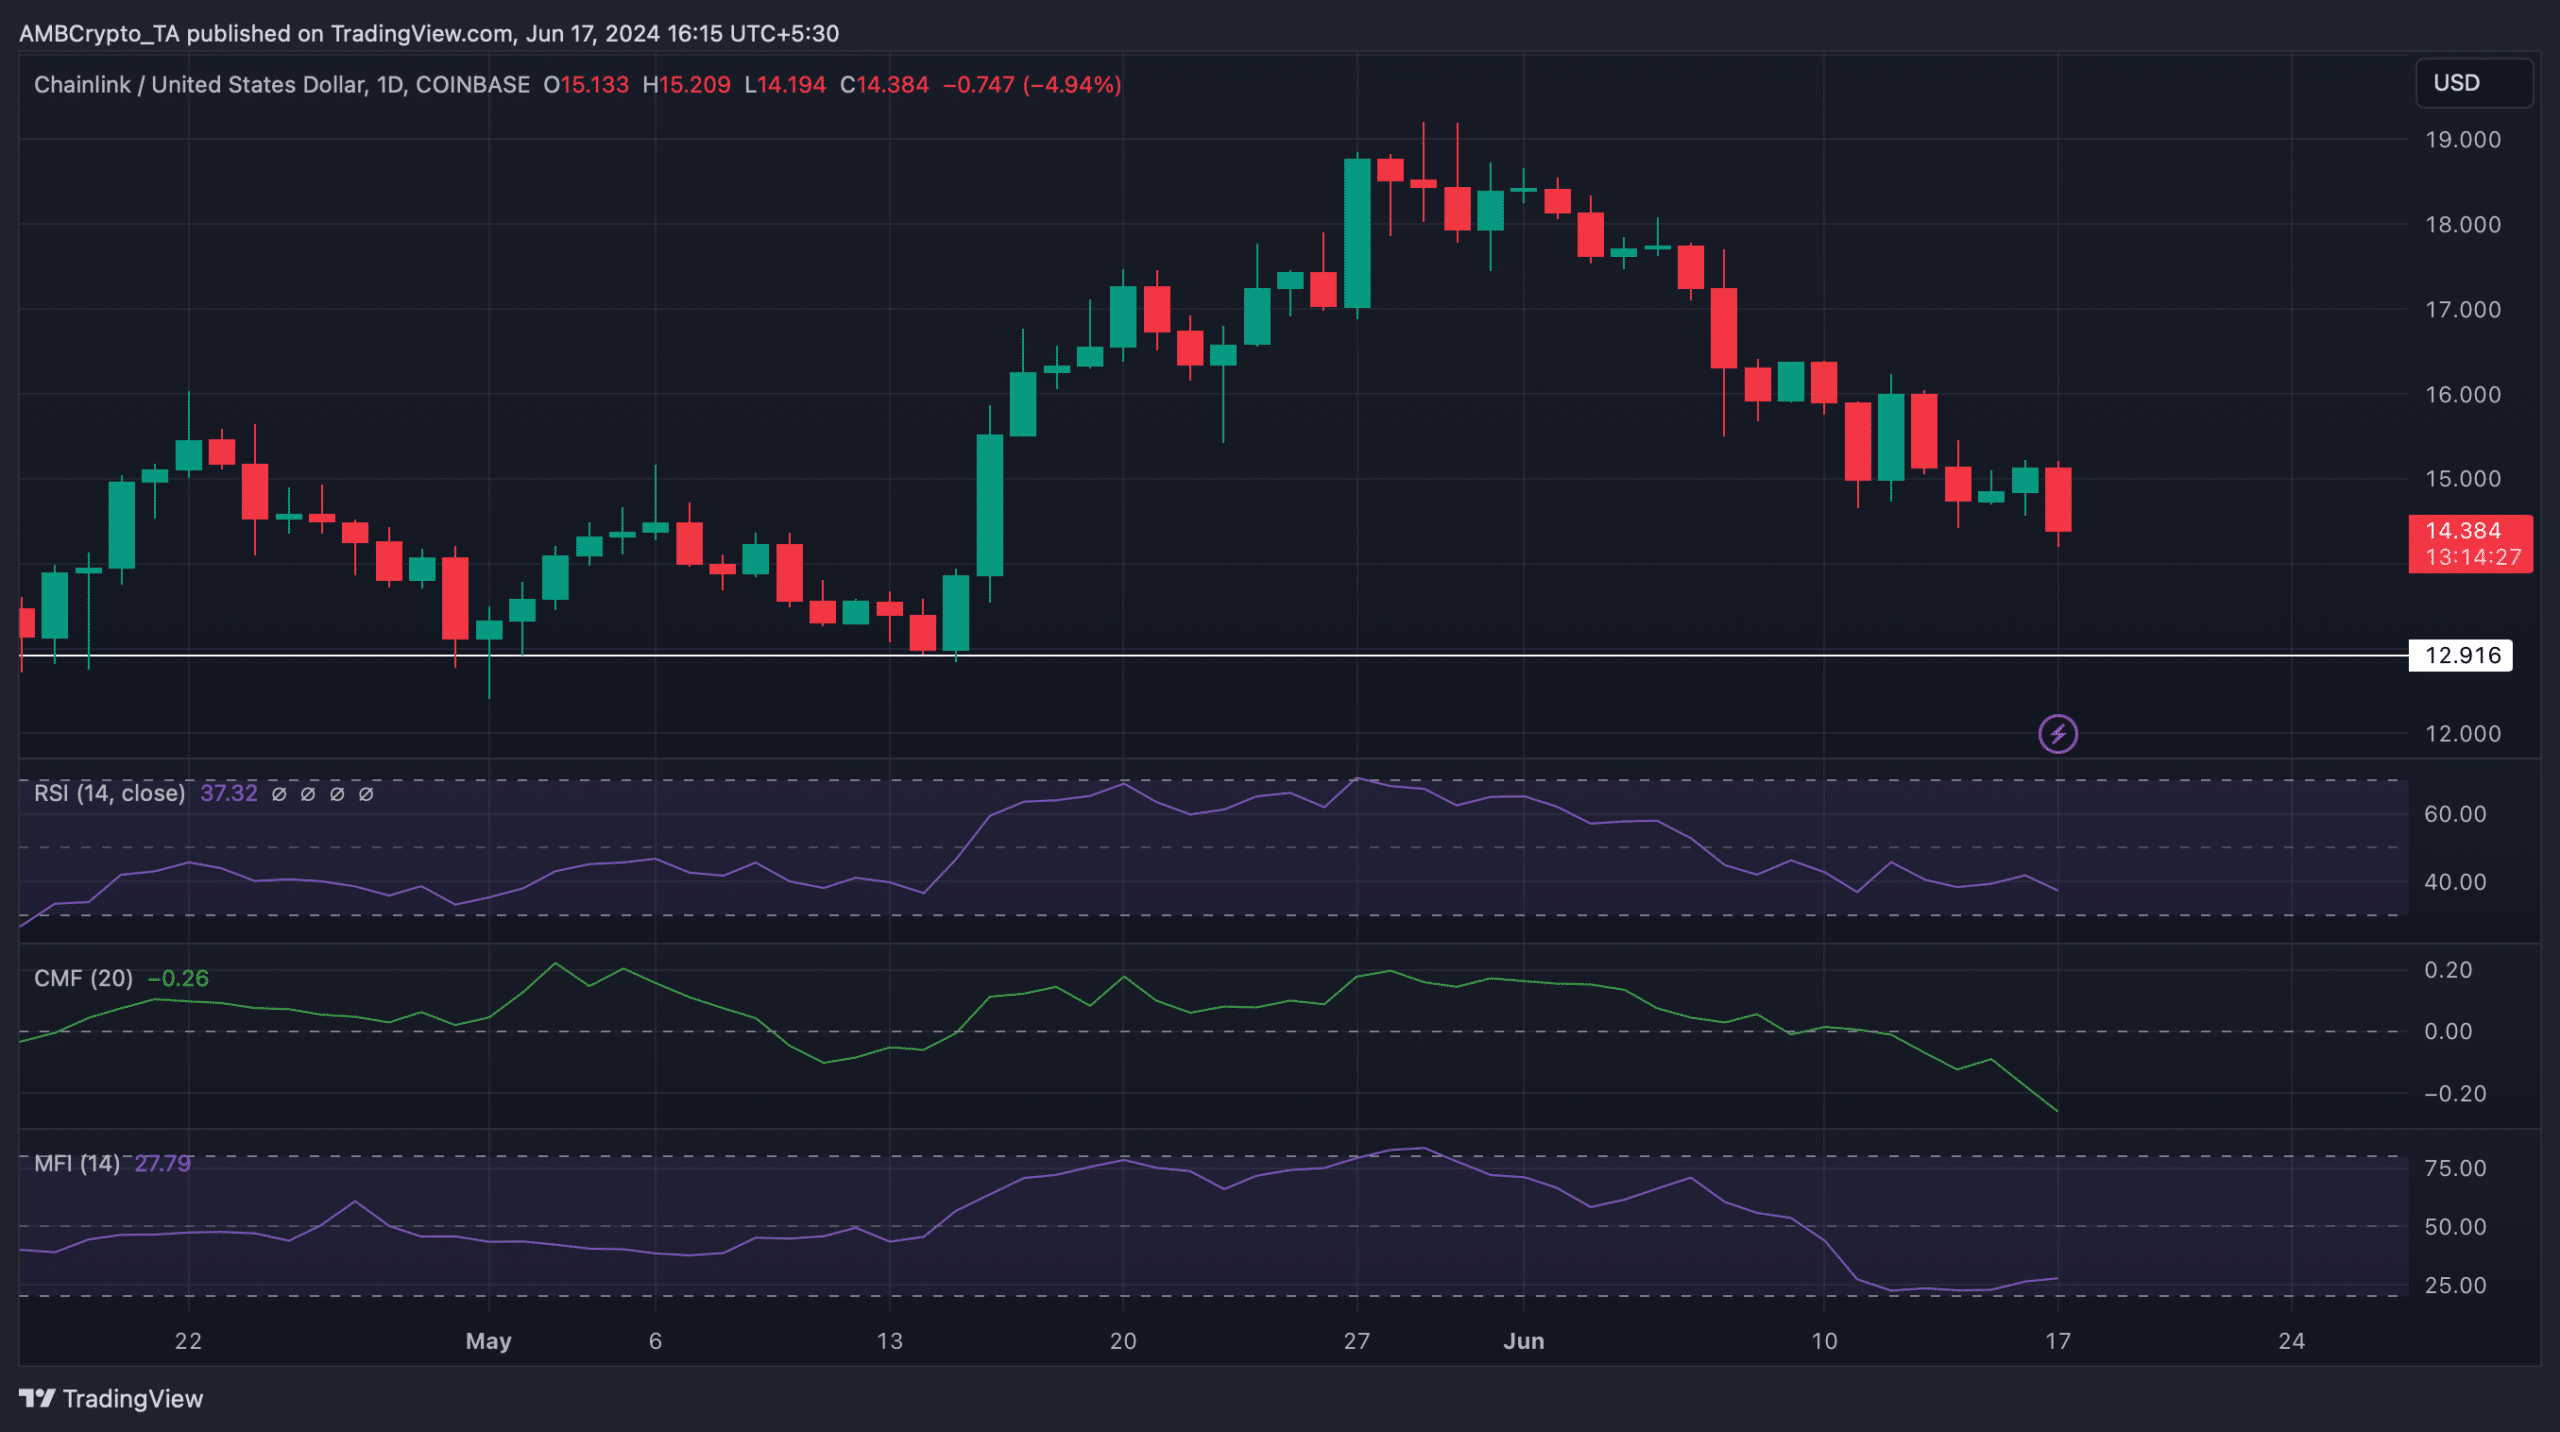
Source: TradingView