Why Ethereum Classic’s [ETC] post-merge ‘high’ is wearing off

The transition of the Ethereum network into a proof-of-stake consensus mechanism on 15 September caused some Ethereum-linked assets to record growth.
Following the merge, Ethereum Classic saw a boom in mining activity on its network as former miners on the Ethereum mainnet sought new homes.
According to data 2miners.com, the surge in mining activity on the network caused the chain to set a new hashrate all-time high.
The price of its native coin, ETC, also rallied by 11% following the merge.
However, coming down from its post-merge ‘high,’ Ethereum Classic and the ETC coin have seen a decline in the past few days.
In case you thought the rally was real
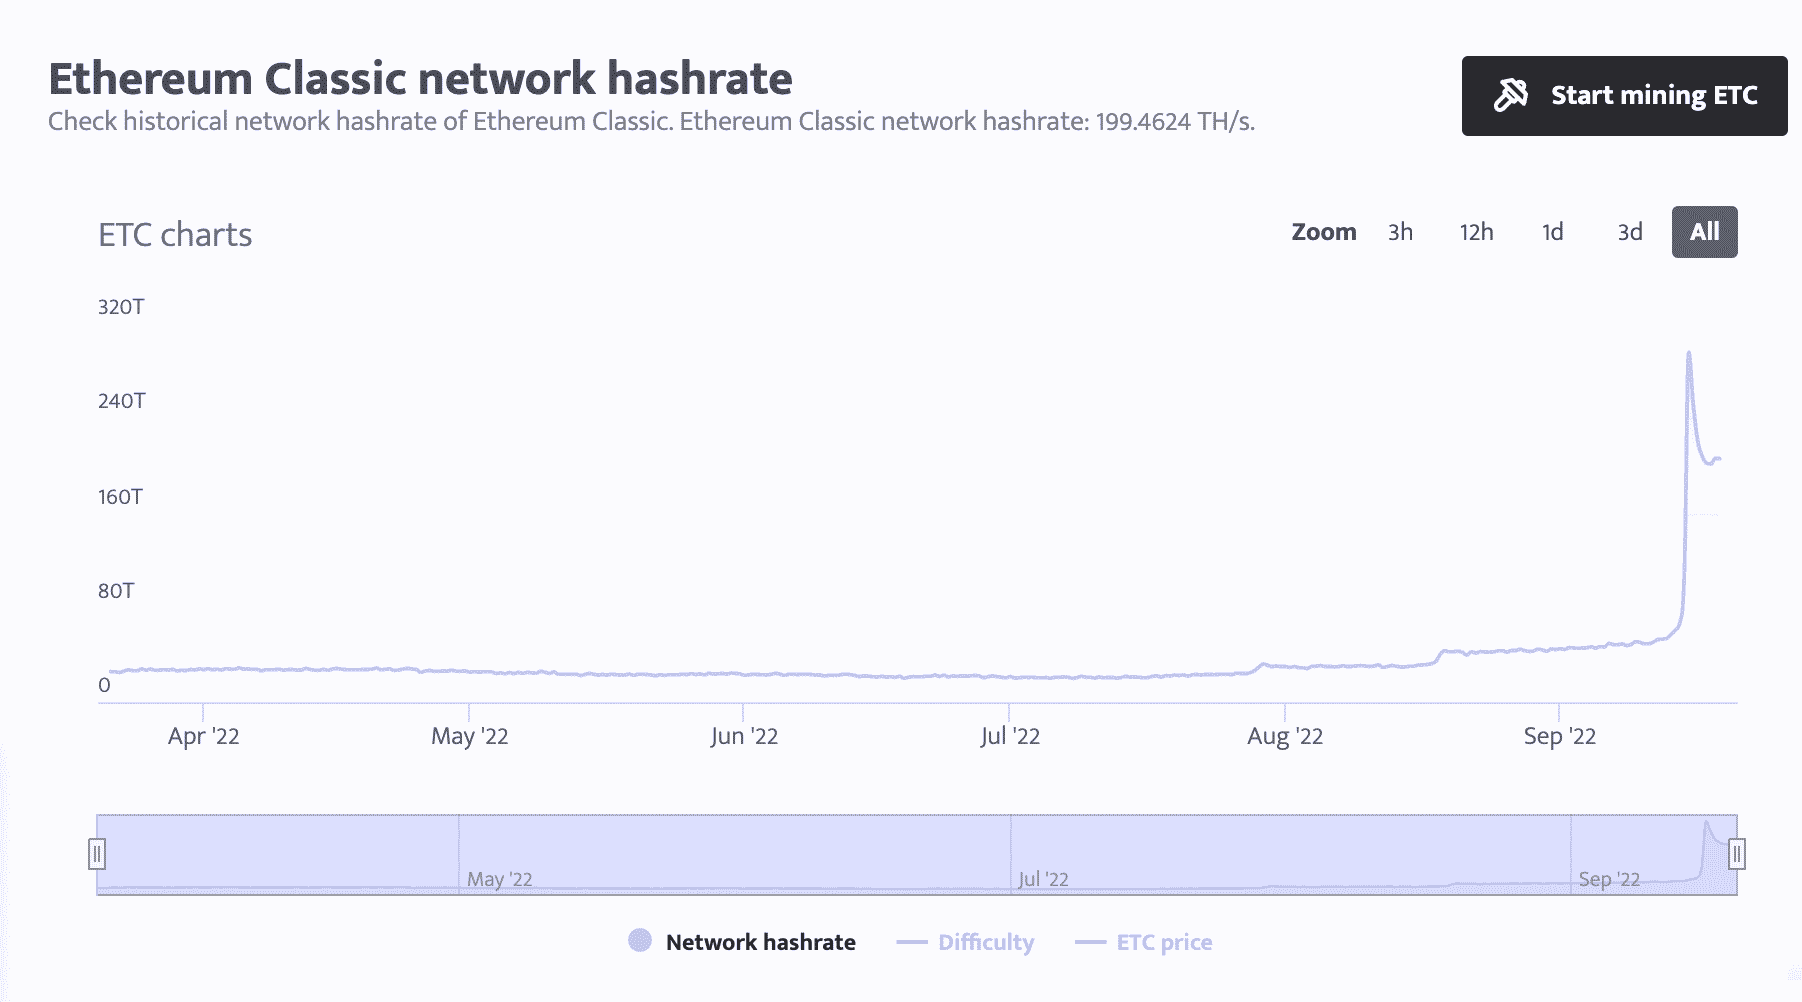
According to data from Minerstat, the Ethereum Classic hashrate stood at 199.4624 TH/s.
Following the merge, it rallied to an all-time high of 296.0848 TH/s. However, in just four days, the mining hashrate on the network declined by 48%.
This decline could be attributable to the further migration of the miners to the newly forked Ethereum proof-of-work network (ETH PoW).
According to data from OKLink, 1,716,444,102 transactions have been processed on the forked network since its launch on 15 September.
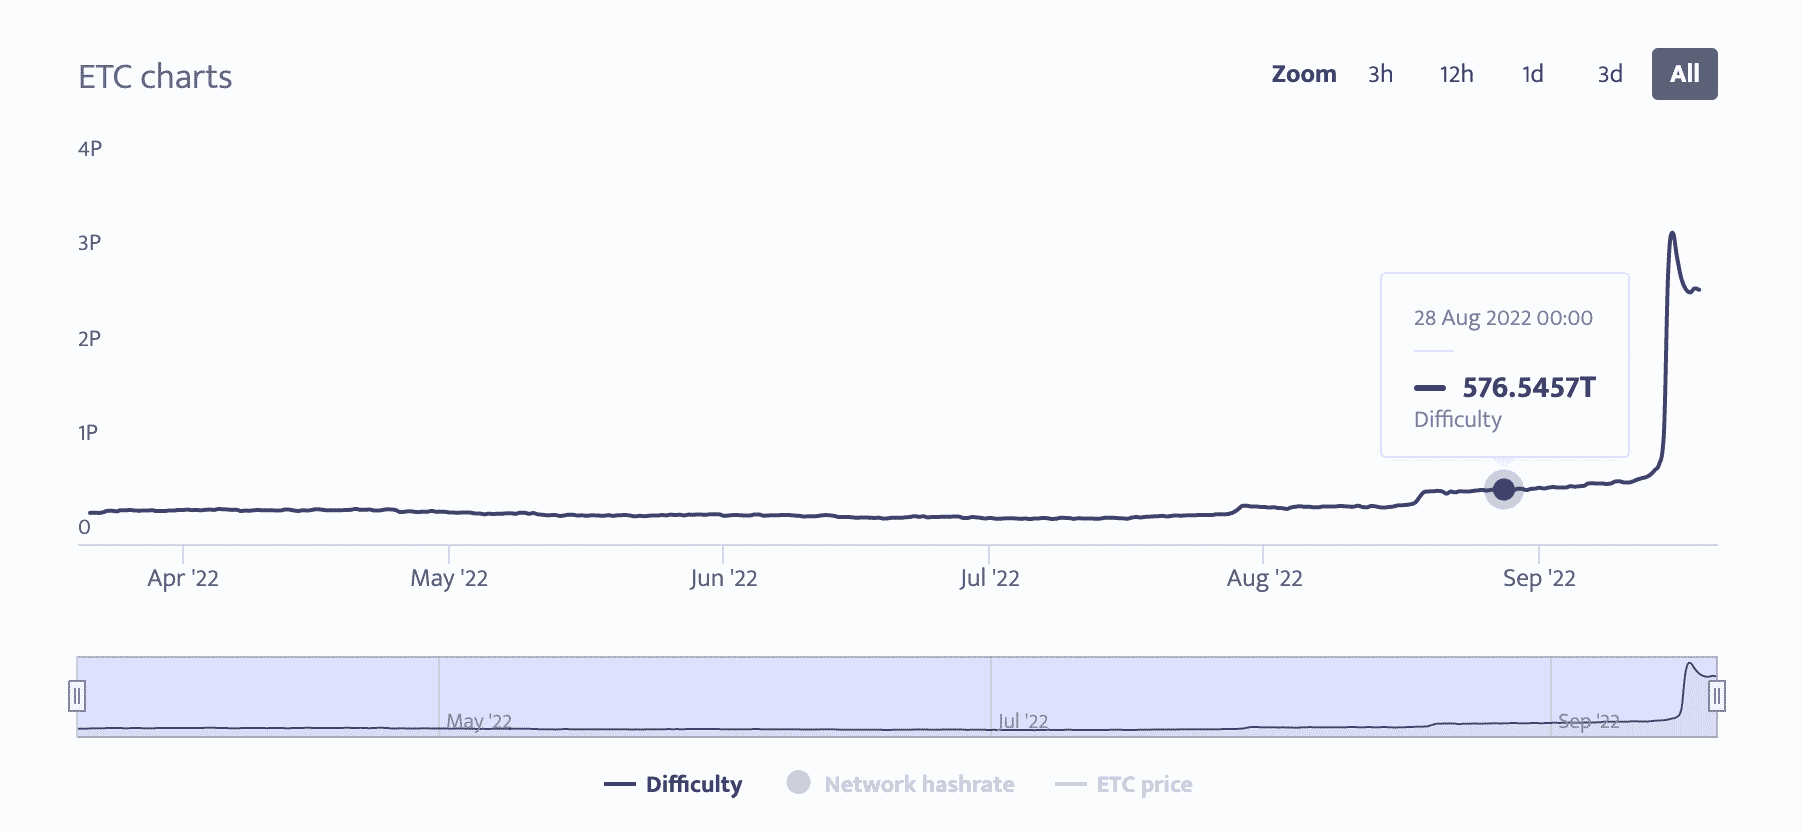
Apart from the decline in hashrate on the network, further data from Minerstat showed a drop in mining difficulty on Ethereum Classic since the merge.
Following the merge, difficulty on the network clinched an all-time high of 3.2943P by 16 September. However, at 2.6068P at press time, it has since declined by 26%.
Even ETC did its thing
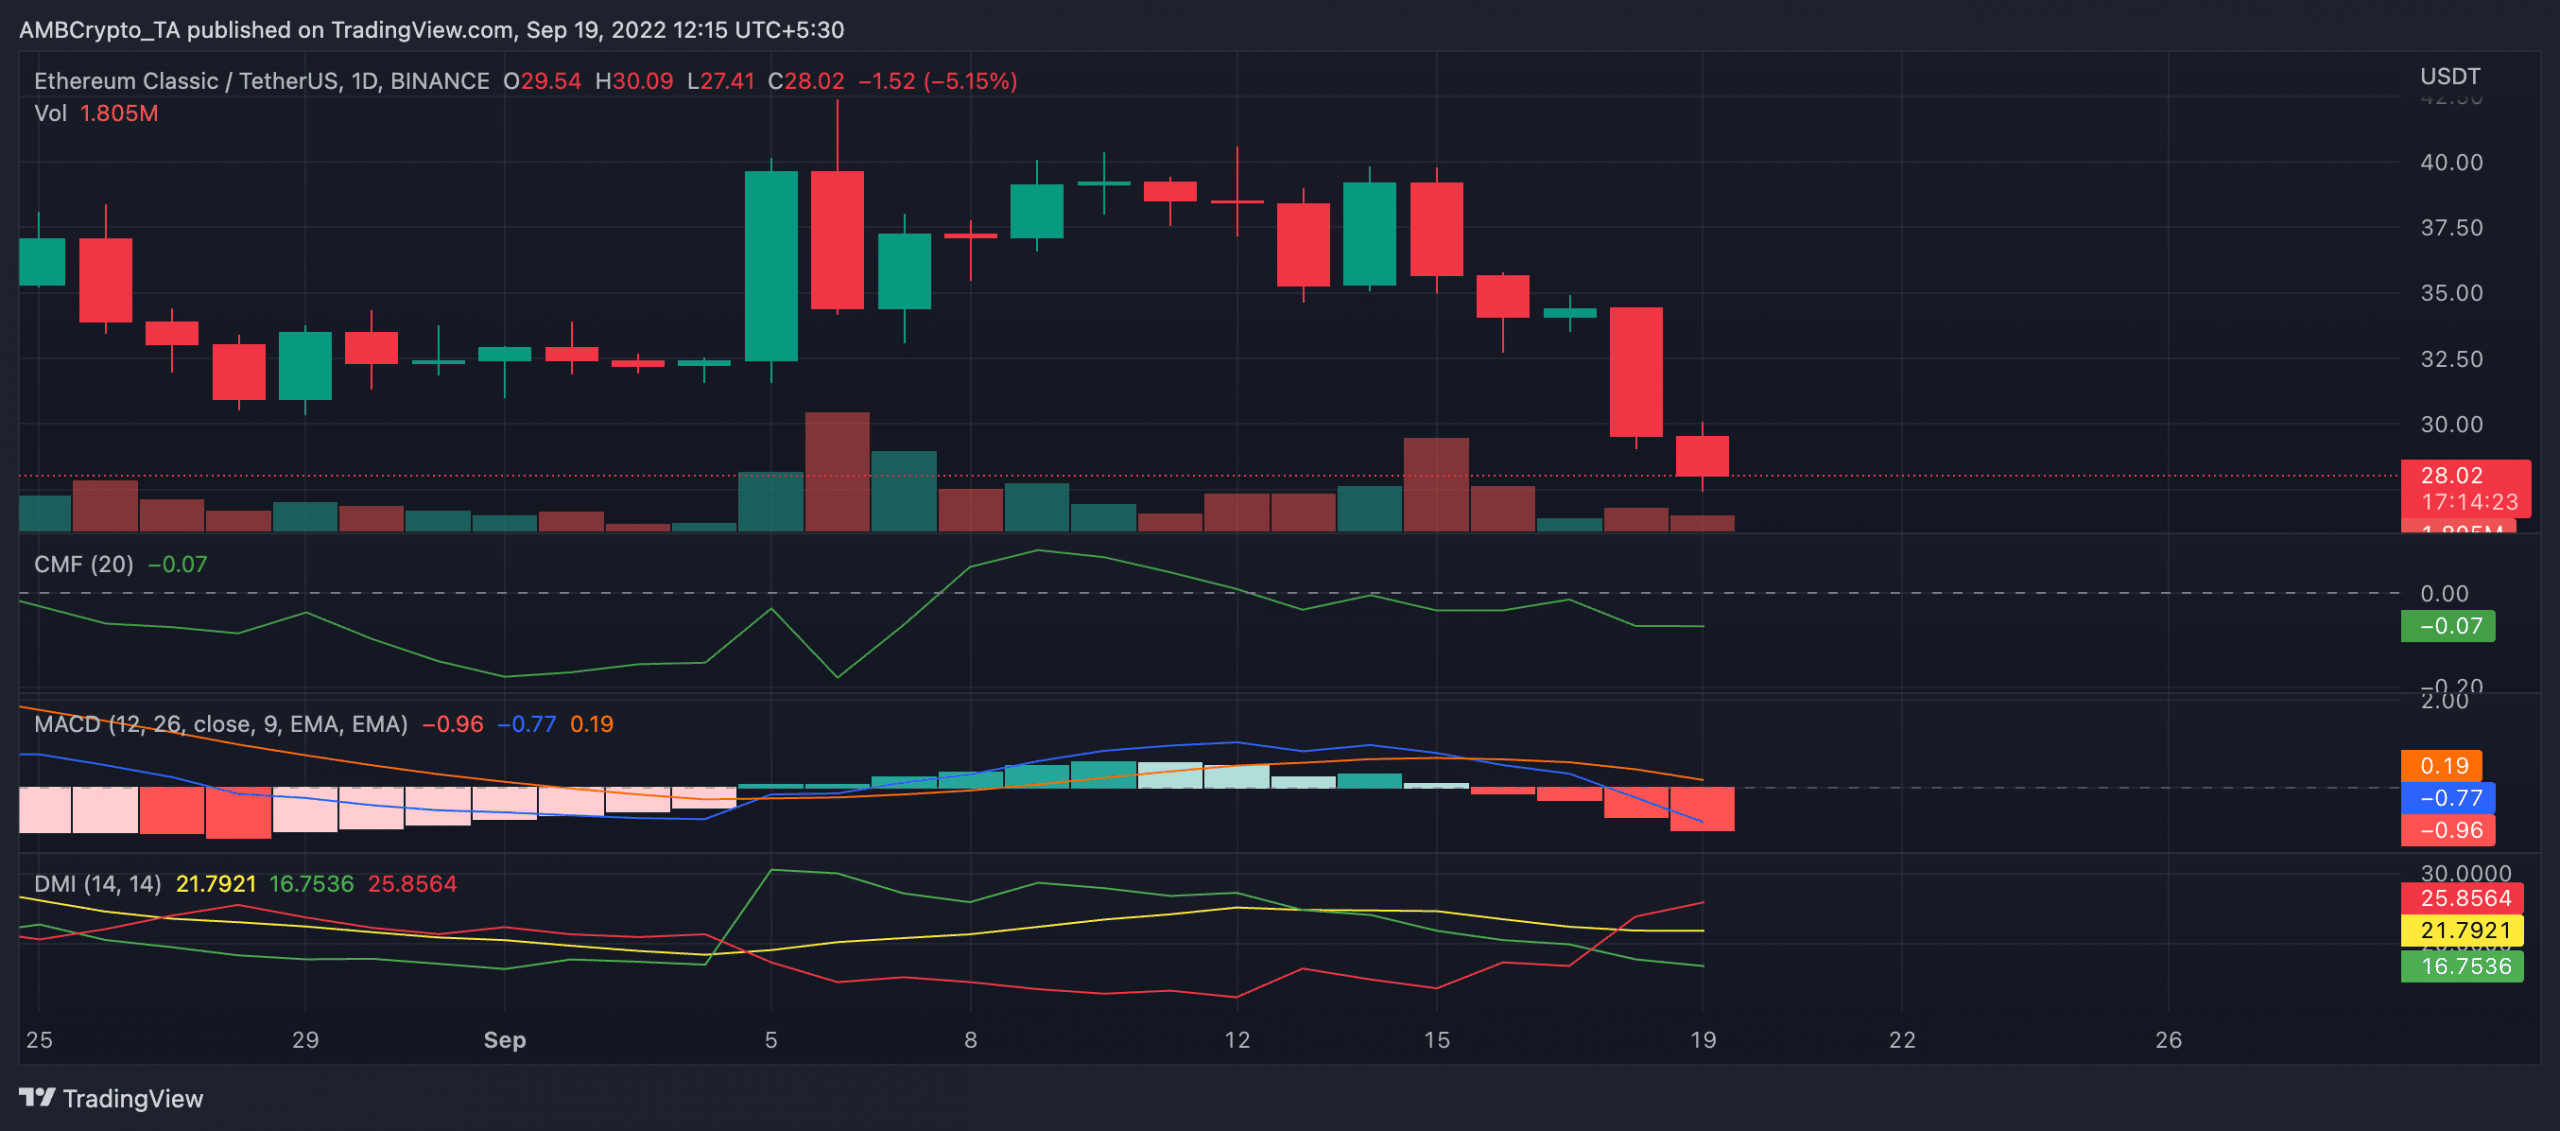
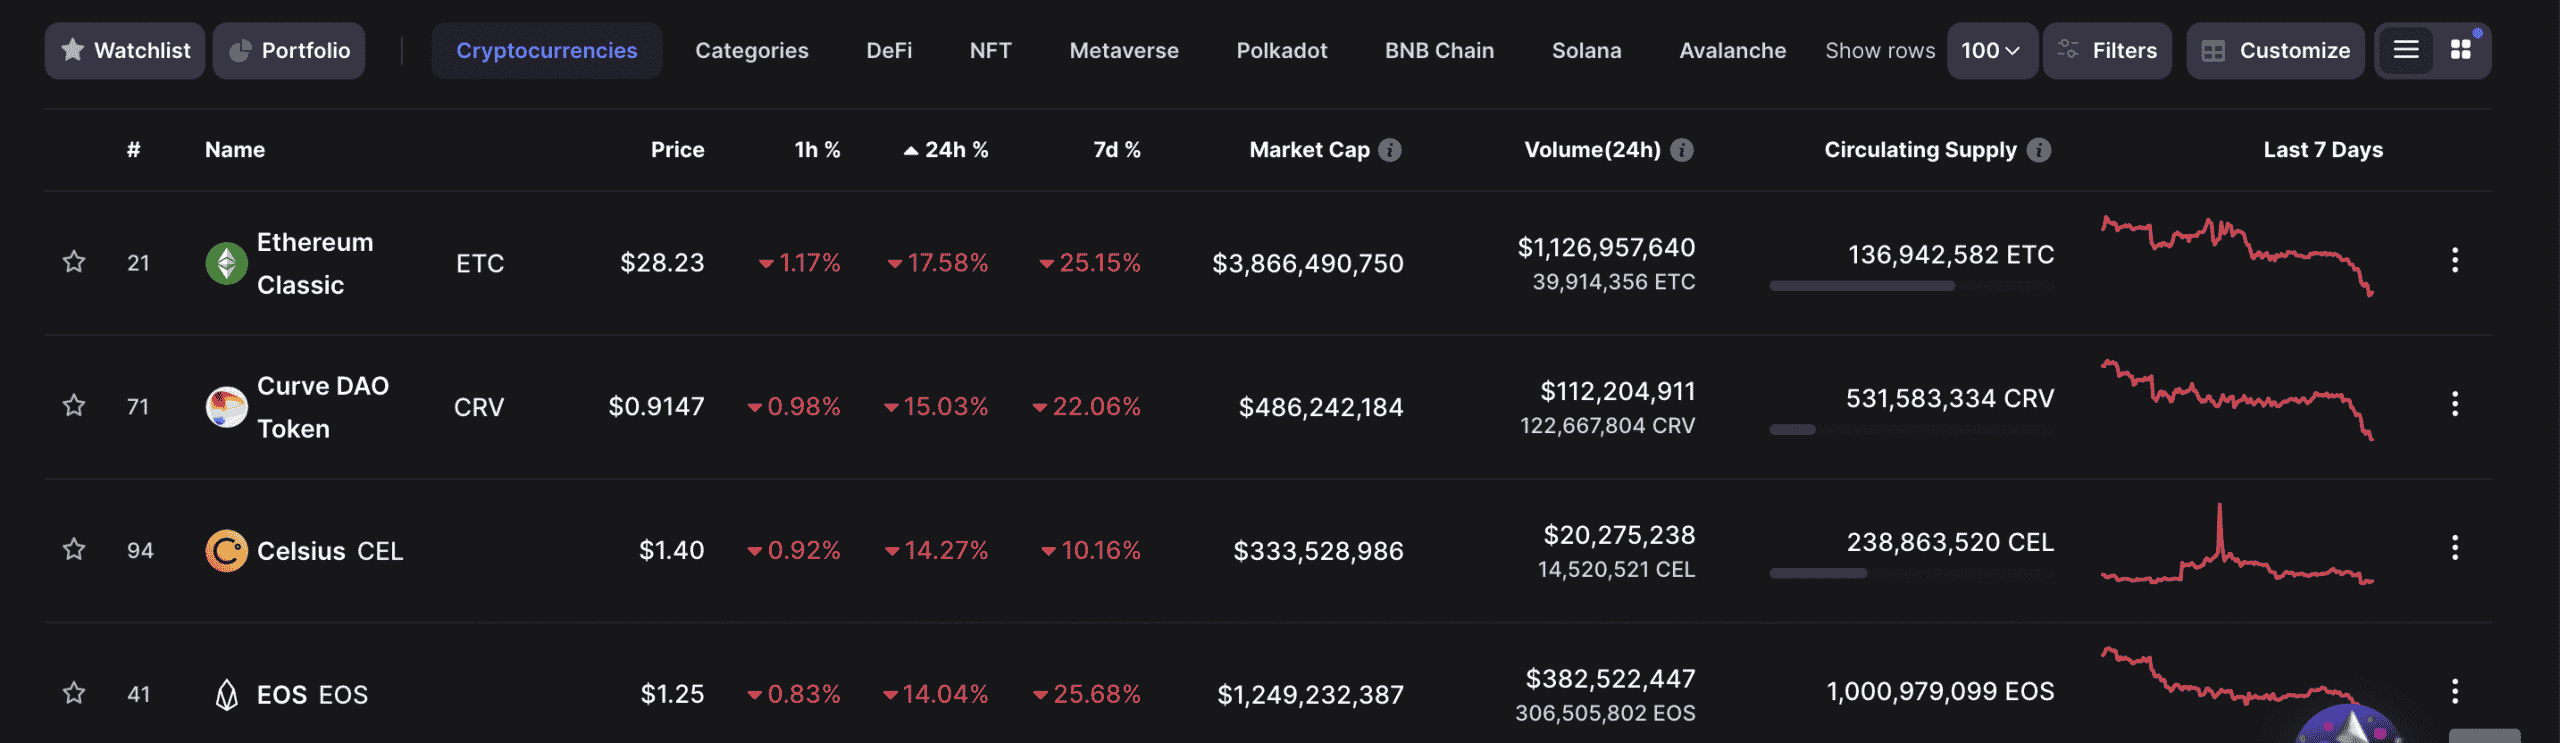
As of this writing, the price per ETC was $28.24, according to data from CoinMarketCap. The 11% price rally following the merge was fleeting as the asset since lost the temporal gains and some more. Since the Ethereum merge, the price of ETC has declined by 26%.
Furthermore, data from CoinMarketCap showed that the price of ETC fell by 17% in the last 24 hours. Thus, making it the crypto asset with the most decline within that period.
Despite the severe decimation in the price of ETC, its trading volume rallied by 122% in the last 24 hours. The price/trading volume divergence indicated buyers’ exhaustion which is common when coin distribution is significant.
In case you are looking to ape in and “buy the dip,” it is imperative to note that ETC initiated a new bear cycle on 16 September after the merge. The position of the asset’s Moving average convergence divergence (MACD) revealed this.
Increased distribution of ETC was underway at press time. The Chaikin Money Flow (CMF) was positioned below the center (0.0), indicating a rally in sell pressure.
The Directional Movement Index (DMI) also showed that sellers controlled the market, with the sellers’ strength (red) at 25.85 positioned above that of the buyers (green) at 16.75.