Skip to content
Active Currencies: 17,390
Market Cap: $2.284T
Bitcoin Dominance: 55.36%
24h Market Cap Change: $-4.11

Why Ethereum’s 77K inflows can spell trouble for ETH

A further crash may be well on its way.

Why Ethereum’s 77K inflow can spell trouble for ETH
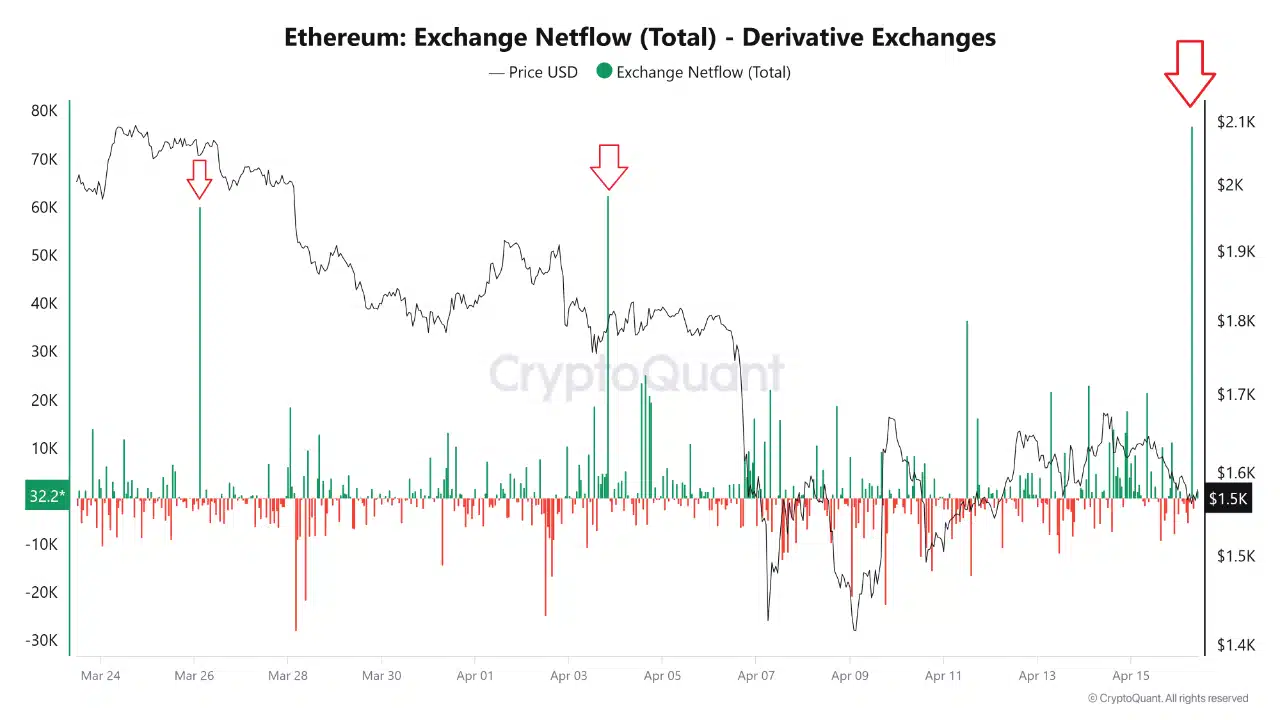
  • Over 77K ETH hit derivative exchanges, signaling potential bearish pressure — or a market bottom.
  • Ethereum bounces to $1,600, but weak momentum and macro headwinds keep traders cautious.

Something big just moved.

Over 77,000 Ethereum [ETH] flowed into derivative exchanges in a single day. This is Ethereum’s largest shift of the year, and everyone’s watching.

Signals like this have spelled trouble before… but this time, the story might be different.

A massive move: 77K ETH hits derivatives

On the 16th of April, over 77,000 ETH flooded into derivative exchanges — Ethereum’s largest single-day net inflow in months.

This makes the previous spikes of 65K ETH on the 26th of March and 60K ETH on the 3rd of April look like chump change.

ethereum
Source: Cryptoquant

The sudden surge, shown clearly in the chart, represents a significant increase in supply entering markets typically used for leverage, hedging, or speculation.

Crucially, Ethereum’s price hovered around $1.5K during the inflow — its lowest level since late 2023 — indicating that this movement isn’t driven by euphoria, but likely caution.

With markets still rattled by uncertainty, such a scale of inflow suggests institutional players are repositioning — and potentially preparing for more downside.

Bearish repeats

Ethereum’s latest spike in derivatives inflow mirrors two prior events — the 26th of March and the 3rd of April — both of which preceded notable price declines.

These inflows correlate with rising bearish sentiment, as traders move ETH to derivative platforms to open shorts or protective hedges.

The pattern is clear: large ETH inflows cause market retreats. What’s different now is the scale and context.

This week’s surge follows China’s retaliatory tariffs, which have sparked a broader risk-off sentiment across global markets.

If history repeats, ETH could see further weakness; but if macro conditions stabilize, this inflow might mark capitulation at the bottom, not a prelude to more pain.

Ethereum price outlook

Ethereum briefly reclaimed the $1,600 level on the 17th of April, bouncing off recent lows. The MACD shows a muted bullish crossover, hinting at weakening selling pressure; but momentum remains shallow.

Meanwhile, the RSI lingered around 40, indicating bearish dominance and limited buyer conviction. Price action remained range-bound, failing to break above the $1,620 resistance zone.

ethereum
Source: TradingView

This technical setup suggested a relief bounce, not a reversal. Without stronger volume or macro tailwinds, Ethereum risks revisiting the $1,500 support zone.

Short-term sentiment remains defensive, as traders await clarity on geopolitical tensions and risk appetite across broader markets.

Disclaimer: AMBCrypto's content is meant to be informational in nature and should not be interpreted as investment advice. Trading, buying or selling cryptocurrencies should be considered a high-risk investment and every reader is advised to do their own research before making any decisions.

Samyukhtha L KM

Journalist

Samyukhtha L KM is a financial journalist and market analyst at AMBCrypto. She covers key market moves, blockchain adoption, and socially-driven crypto trends. She also enjoys providing fresh takes through commentaries on emerging narratives.

AMBCrypto was founded in 2018 with a mission to simplify and bring the latest blockchain and cryptocurrency news to our readers. We have quickly grown into the digital news source for an emerging generation of cryptocurrency enthusiasts, reaching more than a million readers on a monthly basis, across the globe.