Why Hyperliquid fell over 8.03% in the last week despite listings on Upbit, Bithumb
HYPE's latest decline has put its three-month low firmly back on the radar.



Hyperliquid [HYPE] has recently been stirring up chatter in the crypto space after reaching a three-month low.
The token struggled to attract any buying interest, especially after its recent listings on South Korea’s major exchanges, Upbit and Bithumb, ultimately falling 8.03% over the past week.
The recent pressure has been difficult for the token to escape, especially as the broader crypto market continues to struggle.
Notably, Bitcoin’s recent sell-off over the weekend that caused it to fall to $62,000, persistent ETF outflows, and widespread liquidations have kept investors feeling more cautious than ever.
As risk appetite has started to die down and selling pressure has shown little sign of easing, HYPE’s recovery in the near-term seems far-fetched.
HYPE’s weekly chart hints at a further downside risk
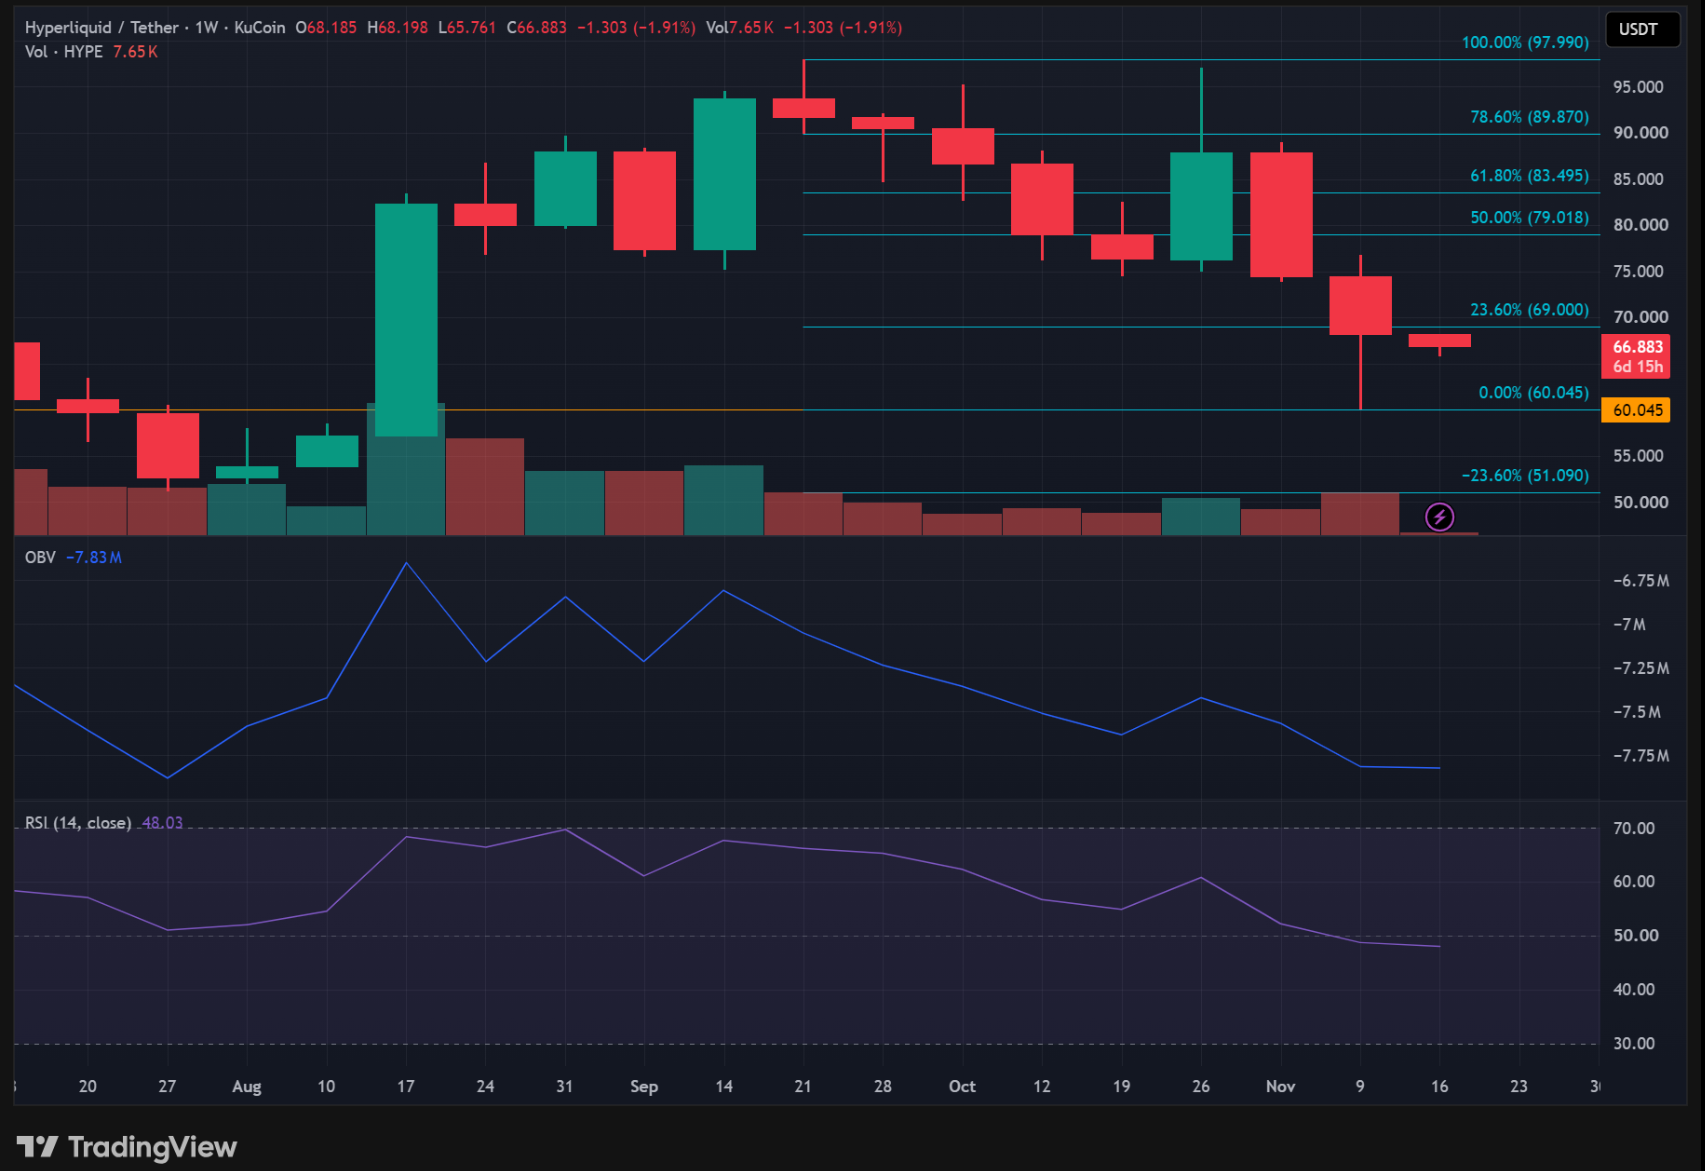
At the time of writing, HYPE was trading at $66.88 on the weekly chart and had officially broken below the 23.6% Fibonacci level. This breach shifted attention to the token’s swing low at $60.045. A decline toward it would erase more of the token’s previous gains.
OBV had declined considerably from its September highs before flattening, indicating that buying pressure had failed to recover. Meanwhile, RSI stood at 48.03, slipping right below the neutral 50 mark, thus reflecting the token’s weakening momentum.
Will HYPE be able to defend its 3-month low?
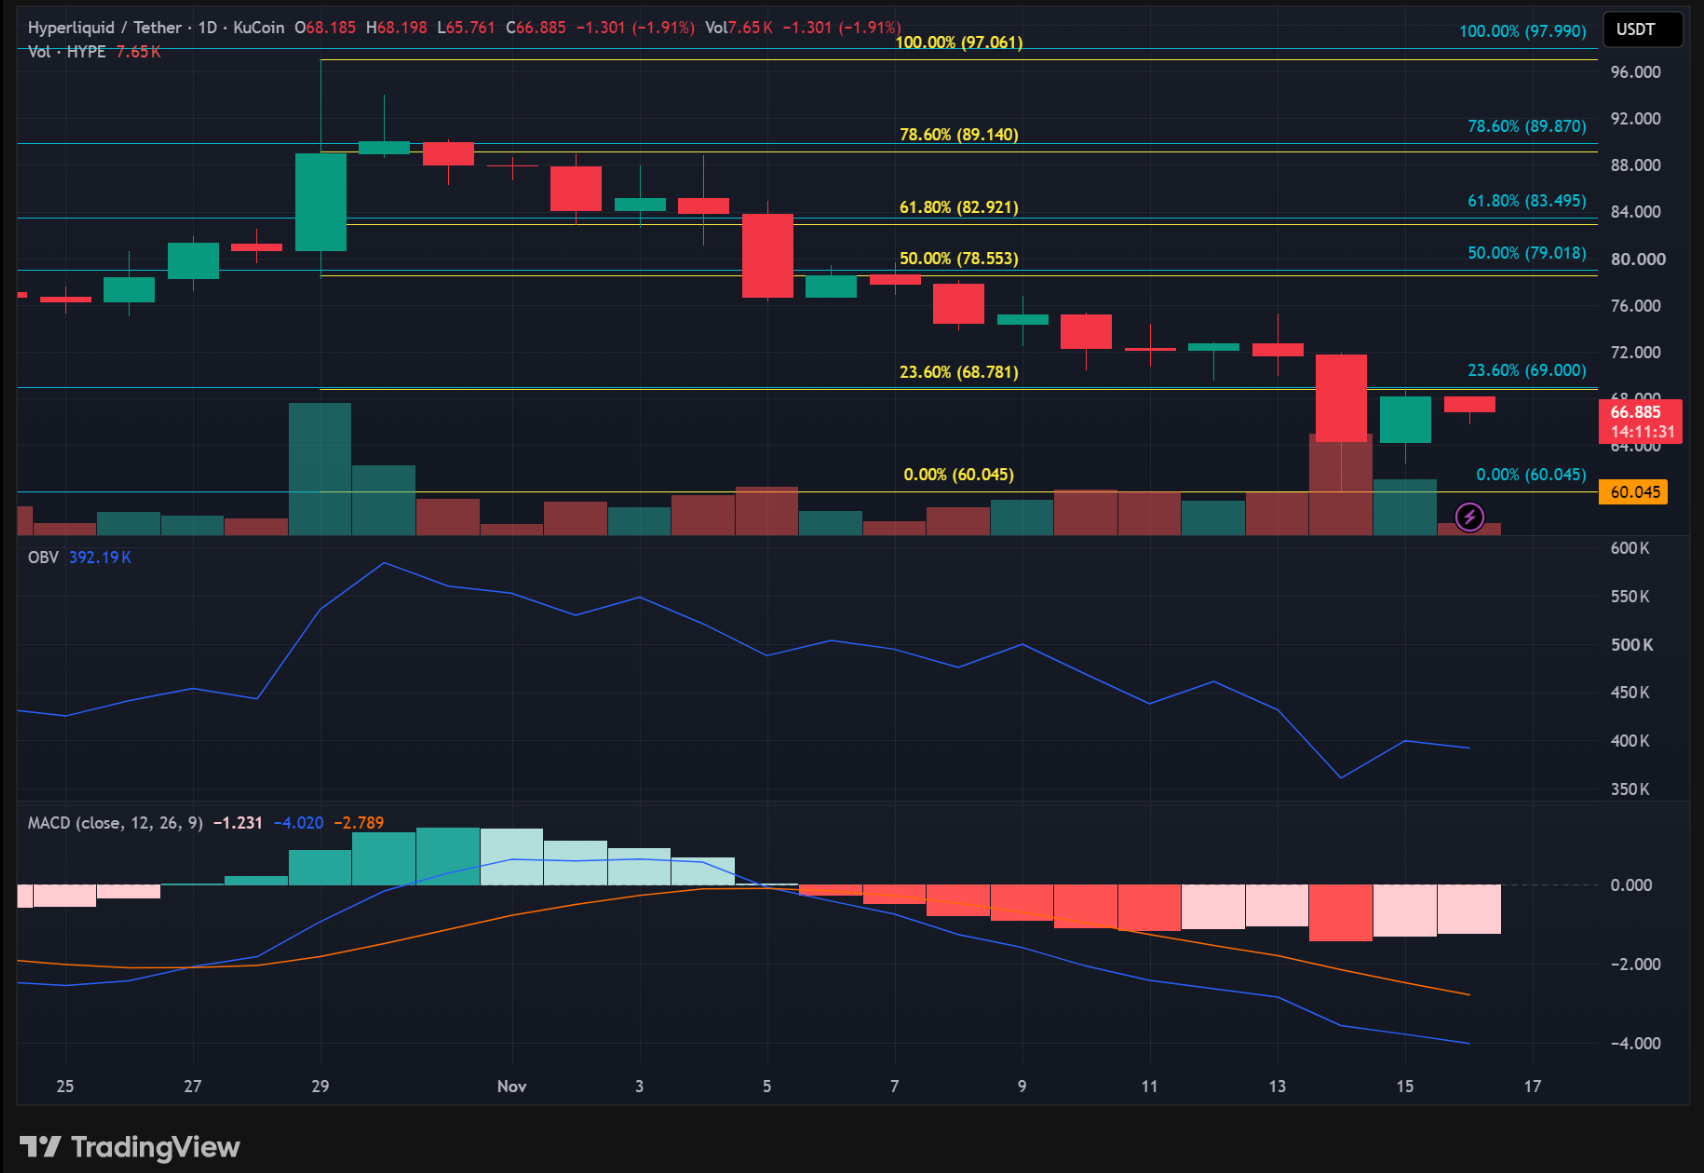
The daily chart offered further insight into the token’s activity and ultimately confirmed the bearish trend. Similar to the weekly chart, HYPE remained trading just below its 23.6% Fibonacci level at $68.78, with any attempt to reclaim this resistance proving to be an uphill battle.
OBV’s continued downtrend suggested that sellers have remained in control over the market. Additionally, the MACD remained below both its signal and zero lines, indicating bearish momentum is likely to persist, and the probability of a reversal occurring is highly unlikely.
As both timeframes pointed at continued downside risks, the $60.045 support level has become increasingly important for traders to pay attention to.
Losing this three-month low would trigger a deeper breakdown and expose HYPE to further losses, making any chances of a recovery a distant dream.
Final Summary
- HYPE’s weekly and daily charts maintained their bearish trend, with a declining OBV and weakening momentum indicators.
- The token’s three-month low at $60.045 is also a crucial support level for traders to watch, as a breakdown could expose HYPE to further downside.