Why Hyperliquid’s 17% price drop puts HYPE’s $69 support at risk
Buyers now face a crucial test as bearish momentum builds.



Over the last week, Hyperliquid [HYPE] has dropped 17%, trading at $72.49 as of writing. Despite bullish exchange listings on South Korea’s Upbit and Bithumb on the 10th of November, the token has struggled to regain ground after falling below $87-$89. The latest price action suggests that sellers have continued to dictate the direction of the market.
At the same time, selling pressure has been rising from several directions. On the 31st of October, two large HYPE holders sold $109 million in tokens after Intercontinental Exchange (ICE) released a more relaxed regulatory statement about perpetual Futures.
Then, on the 8th of November, Binance reopened HYPE withdrawals, giving holders access to their tokens again after the exchange’s security breach in October.
HYPE’s weekly retracement puts $69 in focus
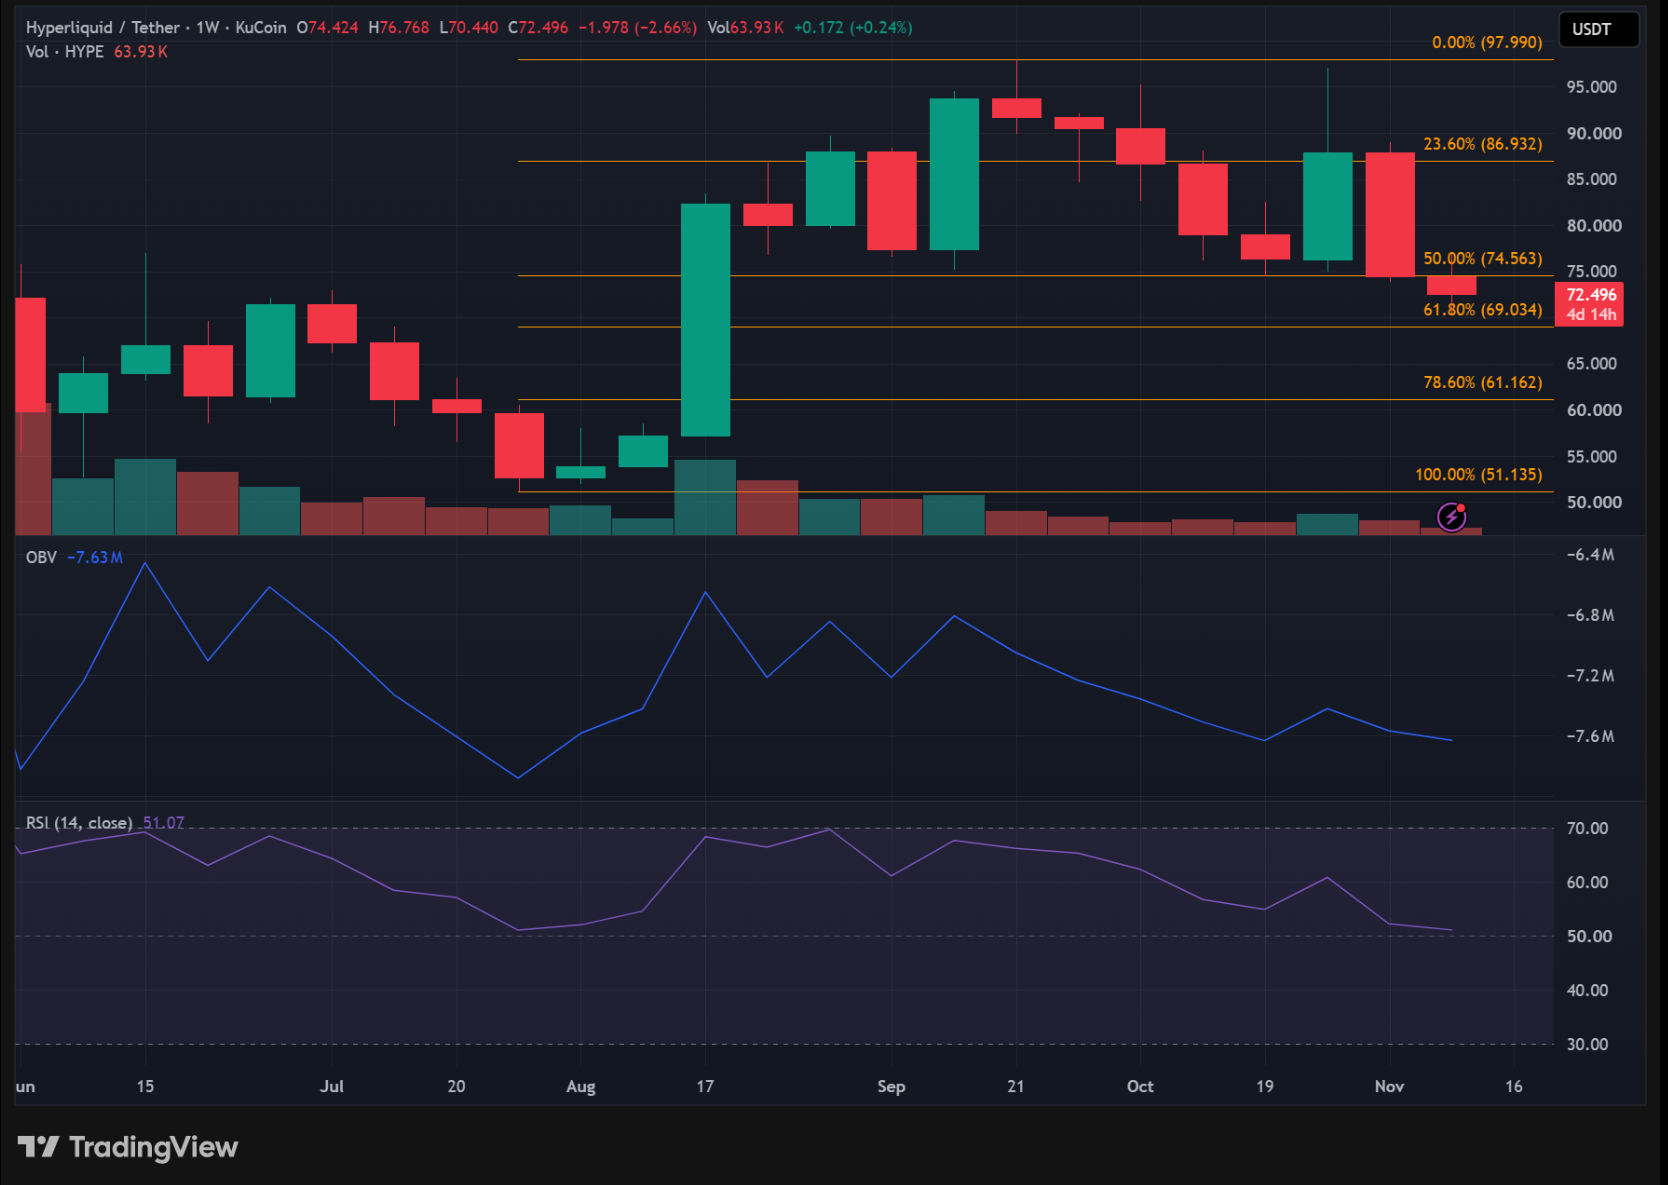
HYPE’s weekly chart has remained under pressure over the past seven days, with price breaking below the 50% Fibonacci level and moving into the 61.8% retracement zone. At the time of writing, HYPE was trading around $72.49 and had officially entered the golden pocket.
The indicators also pointed to the market cooling as the weekly RSI stood at 51.07 and continued to trend lower, suggesting that the bullish momentum seen in previous months was beginning to fade.
Furthermore, OBV had declined from its August-September highs, clearly displaying the difficulty buyers had faced in matching the volume behind recent selling.
Can daily buyers prevent another leg lower?
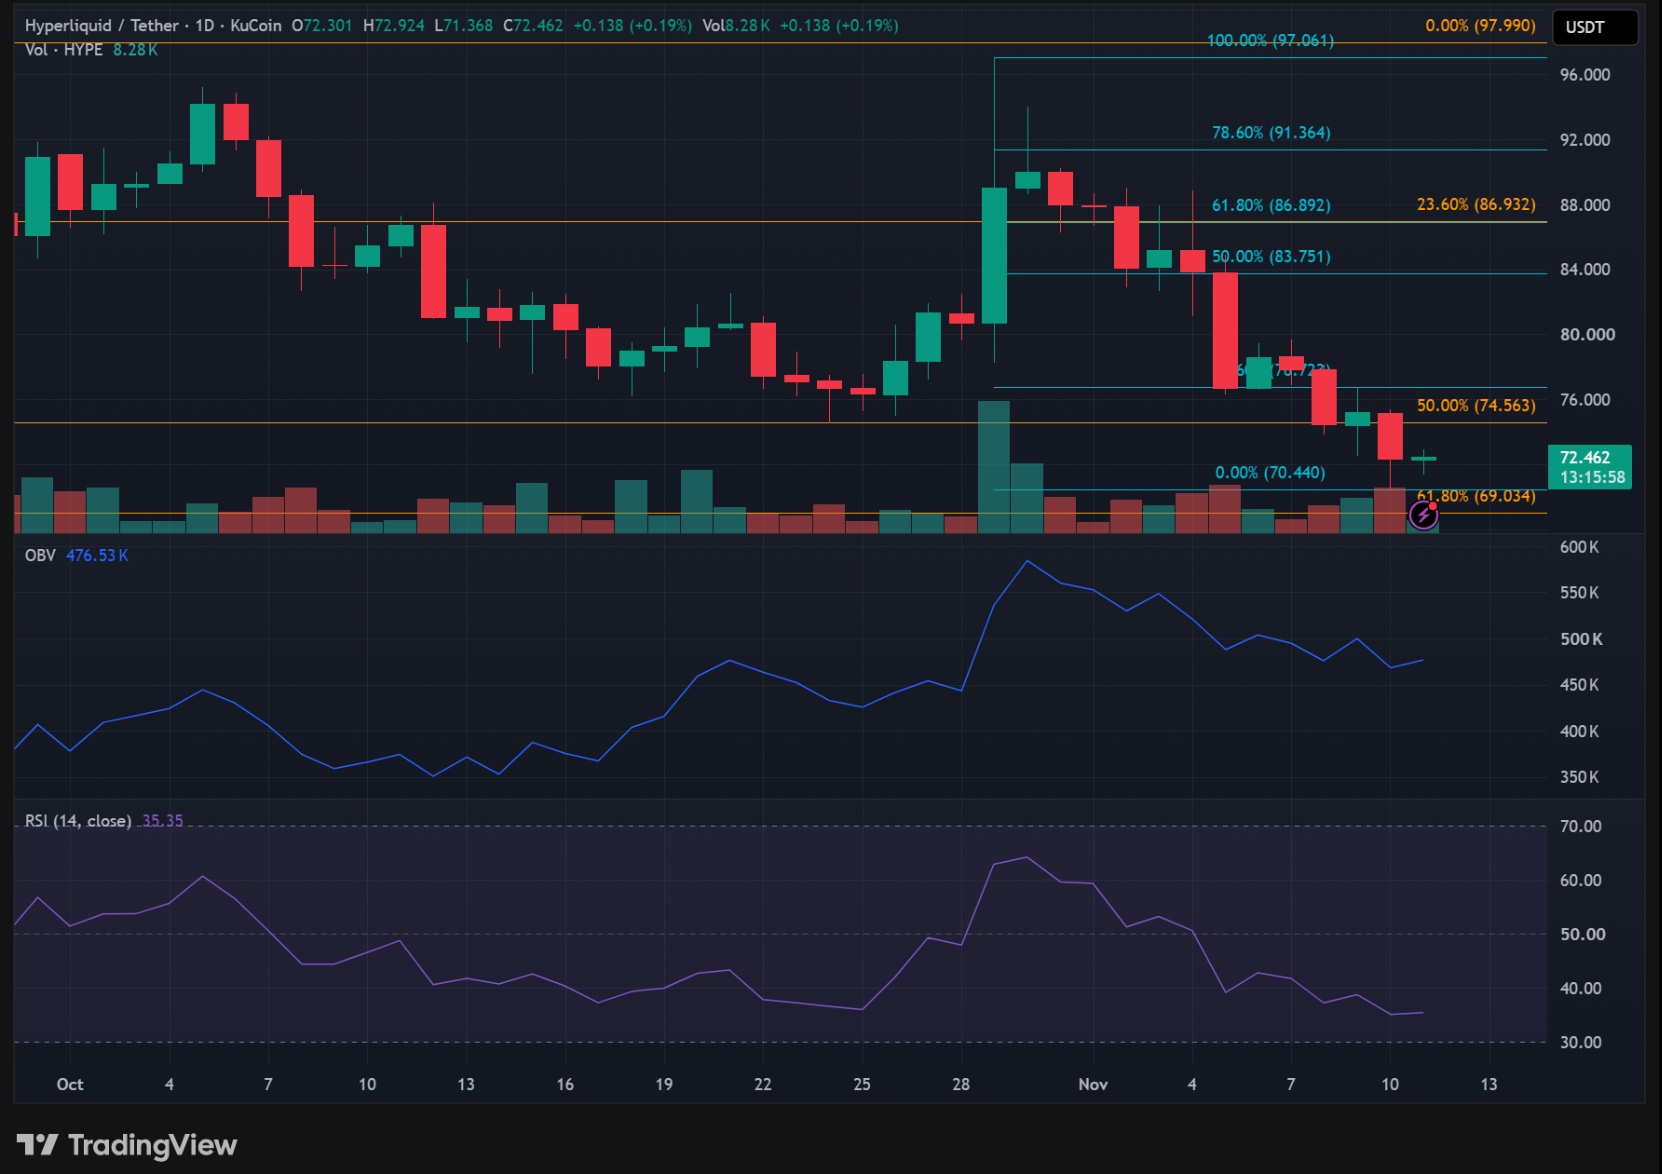
The daily chart also offered very little evidence of a reversal happening anytime soon. HYPE remained below the 23.6% Fibonacci retracement and is hovering close to its recent swing low at $70.44. An RSI of 35.35 pointed towards continued bearish momentum.
On the other hand, OBV’s recent uptick suggested that buyers’ interest had peaked; however, sustained buying would be needed for price to have any meaningful recovery.
A break below $70.44 could shift attention towards the weekly $69.03 retracement. If buyers defend this area, some relief could be seen, potentially giving HYPE room to attempt a recovery. However, if this support gives way, the next downside target sits at the weekly Fibonacci level of $61.16.
Final Summary
- HYPE’s weekly and daily charts show weakening momentum, with sellers continuing to hold the upper hand.
- The $69.03 Fibonacci level is the next major support to watch. A successful defence of this level could open the door to a recovery attempt, while a breakdown risks further losses towards $61.16.