Bitcoin
Why is Bitcoin down today? Several key factors are at play
Bitcoin’s price has gone under its market bottom threshold, hinting at a price increase.


- Bitcoin’s price dropped by over 7% in the last seven days.
- Selling pressure on Bitcoin was high.
Bitcoin [BTC] has been struggling for quite a few days as its price plummeted under $63k. A major reason behind this sluggish price action might be a decline in ETF interest among the top players.
However, data suggests that the trend might change soon. Let’s take a closer look at why Bitcoin is down and whether there are any chances of a trend reversal.
Why is Bitcoin down?
CoinMarketCap’s data revealed that BTC’s price dropped by more than 7% in the last 24 hours. In fact, in the last 24 hours alone, the king of cryptos’ price declined by over 4%.
At the time of writing, BTC was trading at $61,360.70 with a market capitalization of over $1.2 trillion.
Though there might have been several factors at play, one of the key reasons behind this drop could be the decline in BTC ETFs.
Per an earlier AMBCrypto report, as of the 21st of June, Fidelity Wise Origin Bitcoin Fund (FBTC) was hit the hardest with outflows totaling $44.8 million.
This was followed by Grayscale Bitcoin Trust (GBTC), which saw outflows of $34.2 million in a single day. Not all Bitcoin ETFs, though, saw considerable withdrawals.
IBTC at BlackRock stayed steady, with no days of withdrawals both during and before this time.
A trend reversal for BTC?
Amidst all this, AMBCrypto’s analysis of Glassnode’s data revealed an interesting development. As per our analysis, BTC’s price went below its market bottom for the first time in 2024, as evident from its Pi Cycle Top indicator.
For the uninitiated, the Pi Cycle indicator is composed of the 111-day moving average and a 2x multiple of the 350-day moving average of Bitcoin’s price.
This suggested that the chances of BTC turning bullish once again were high.If that turns out to be the case, then BTC might touch $91k in the coming weeks.
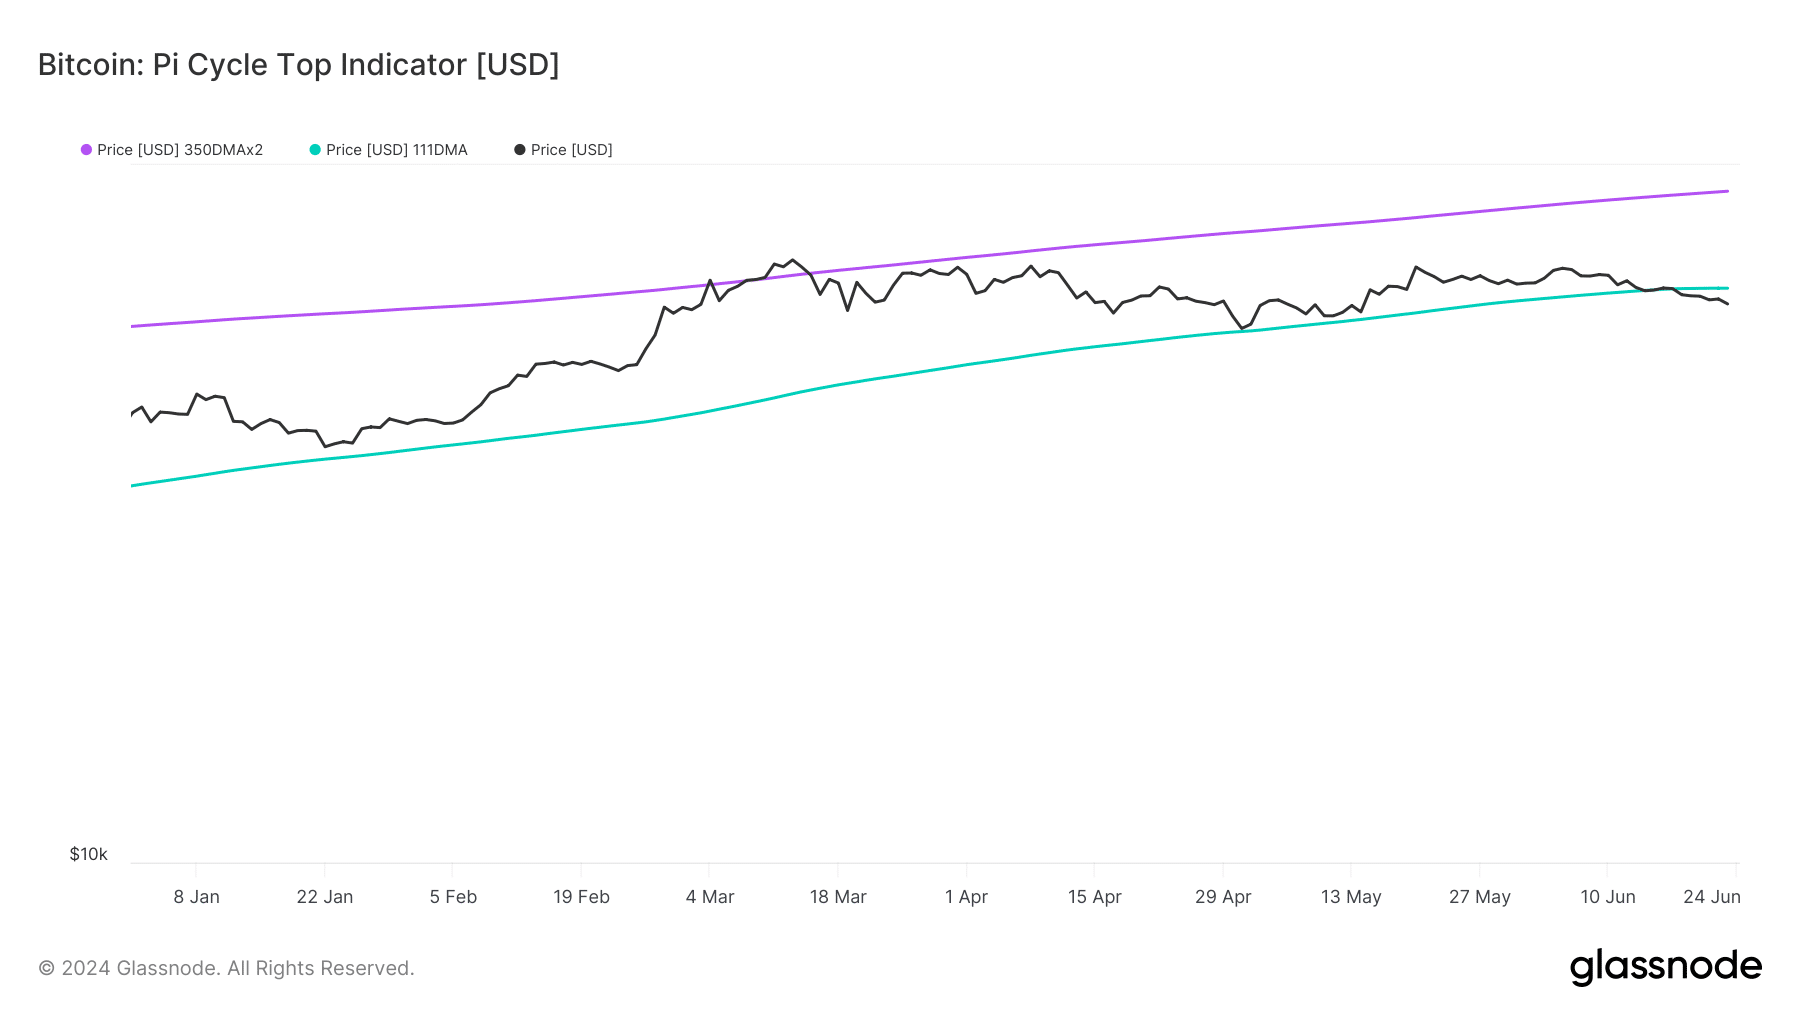
Source: Glassnode
To check whether BTC was awaiting a trend reversal, AMBCrypto analyzed CryptoQuant’s data. We found that selling pressure on BTC was high as its net deposit of n exchanges was high compared to the last seven days’ average.
Its Coinbase Premium was also red, meaning that selling sentiment was dominant among U.S. investors. Additionally, BTC’s aSORP was red, meaning that more investors were selling at a profit.
In the middle of a bull market, it can indicate a market top.
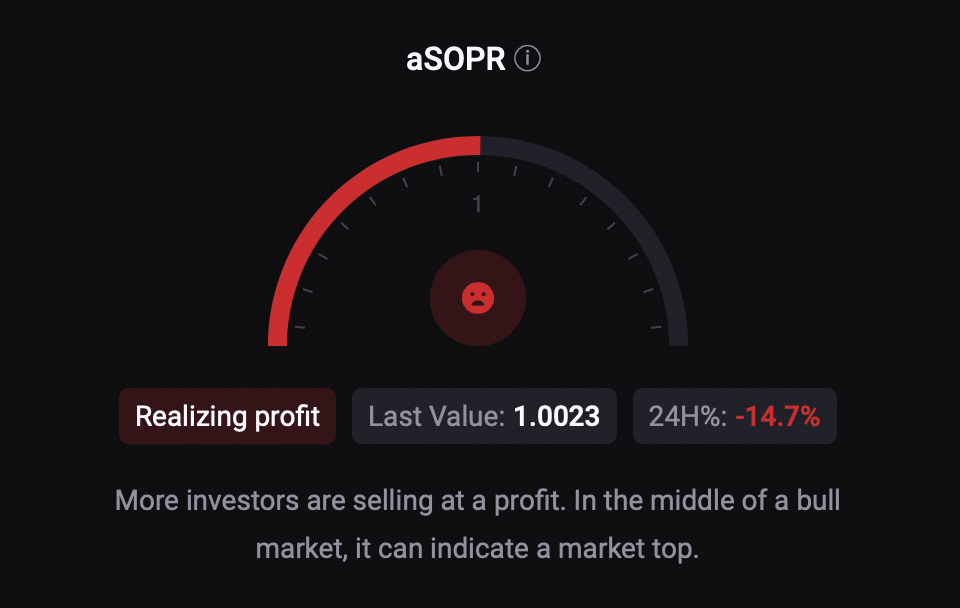
Source: CryptoQuant
Read Bitcoin’s [BTC] Price Prediction 2024-25
The technical indicator MACD also displayed a clear bearish advantage in the hand, hinting at a further downtrend. However, BTC’s Relative Strength Index (RSI) was about to enter the oversold zone.
This might increase buying pressure and, in turn, put an end to its bearish price action.
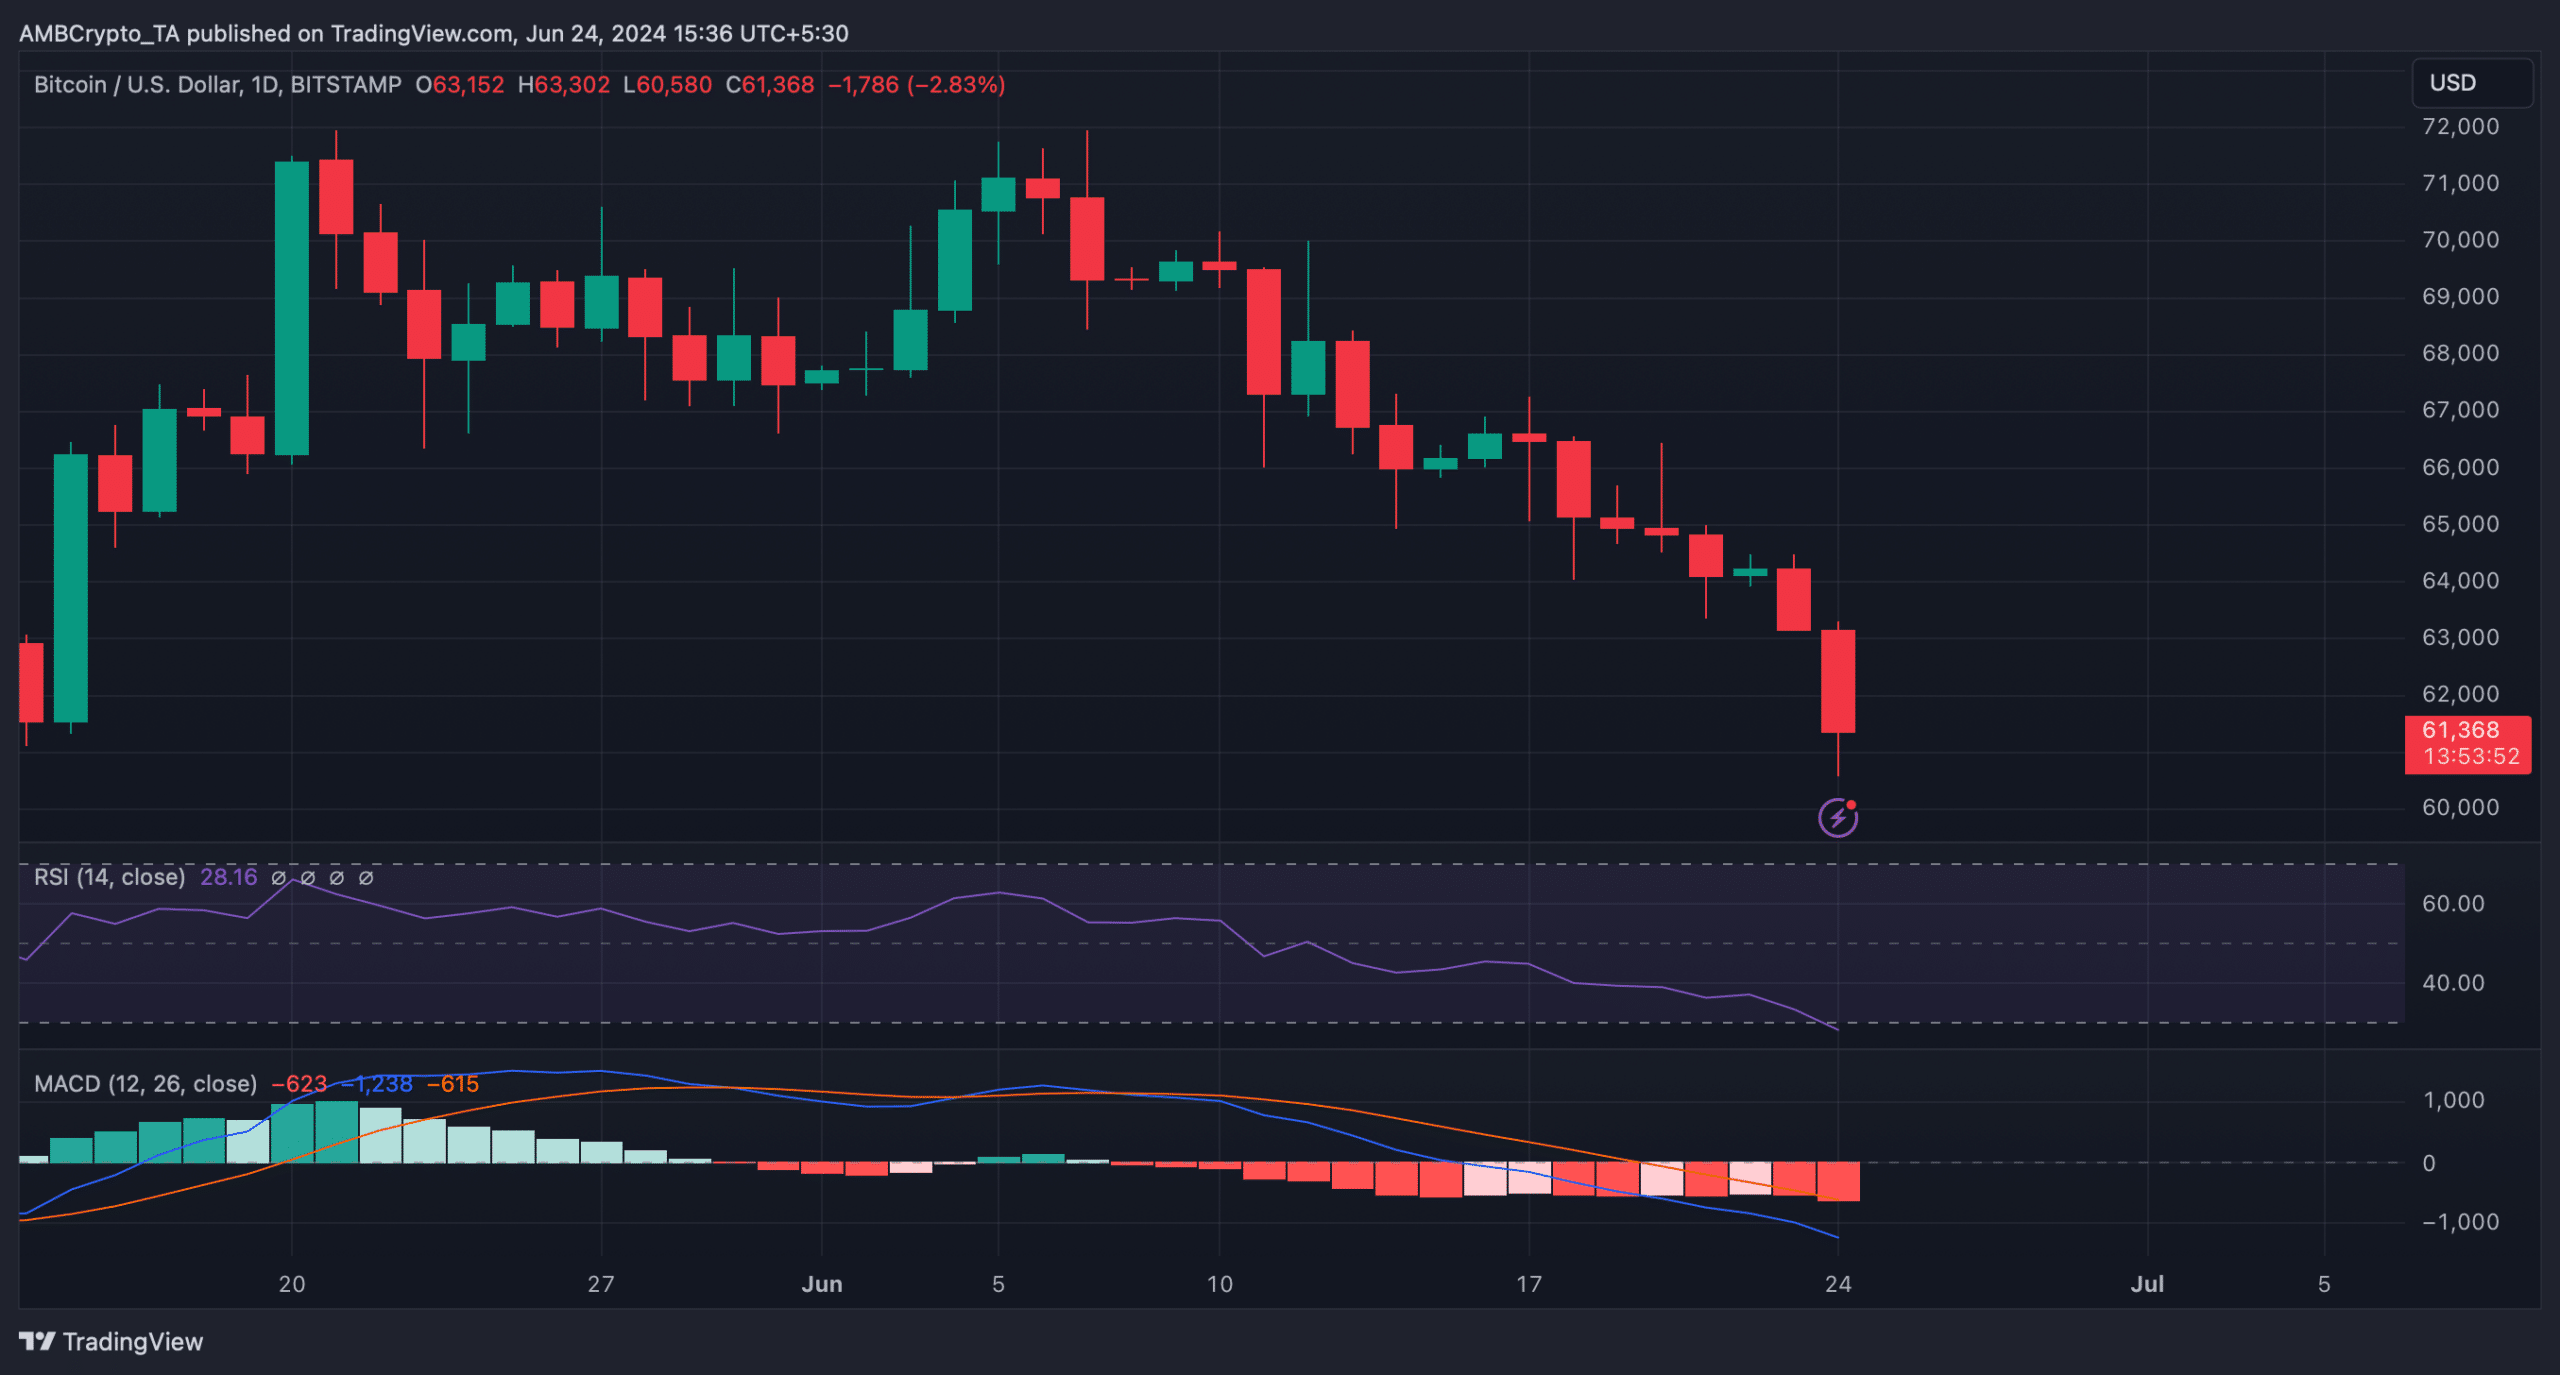
Source: TradingView


