
Hyperliquid price prediction – THESE shorting opportunities could yield 16% gains!
- The price of Bitcoin has gone up close to 5% since the recent weekend.
- There was a buy signal from on-chain metrics but also concerns over “artificial demand”.
Bitcoin [BTC] has gained 4.5% since Saturday, the 29th of June. In doing so, the support zone that stretched back to the 1st of March was retested and defended as support. Additionally, the range lows of the past three months’ price action were also saved.
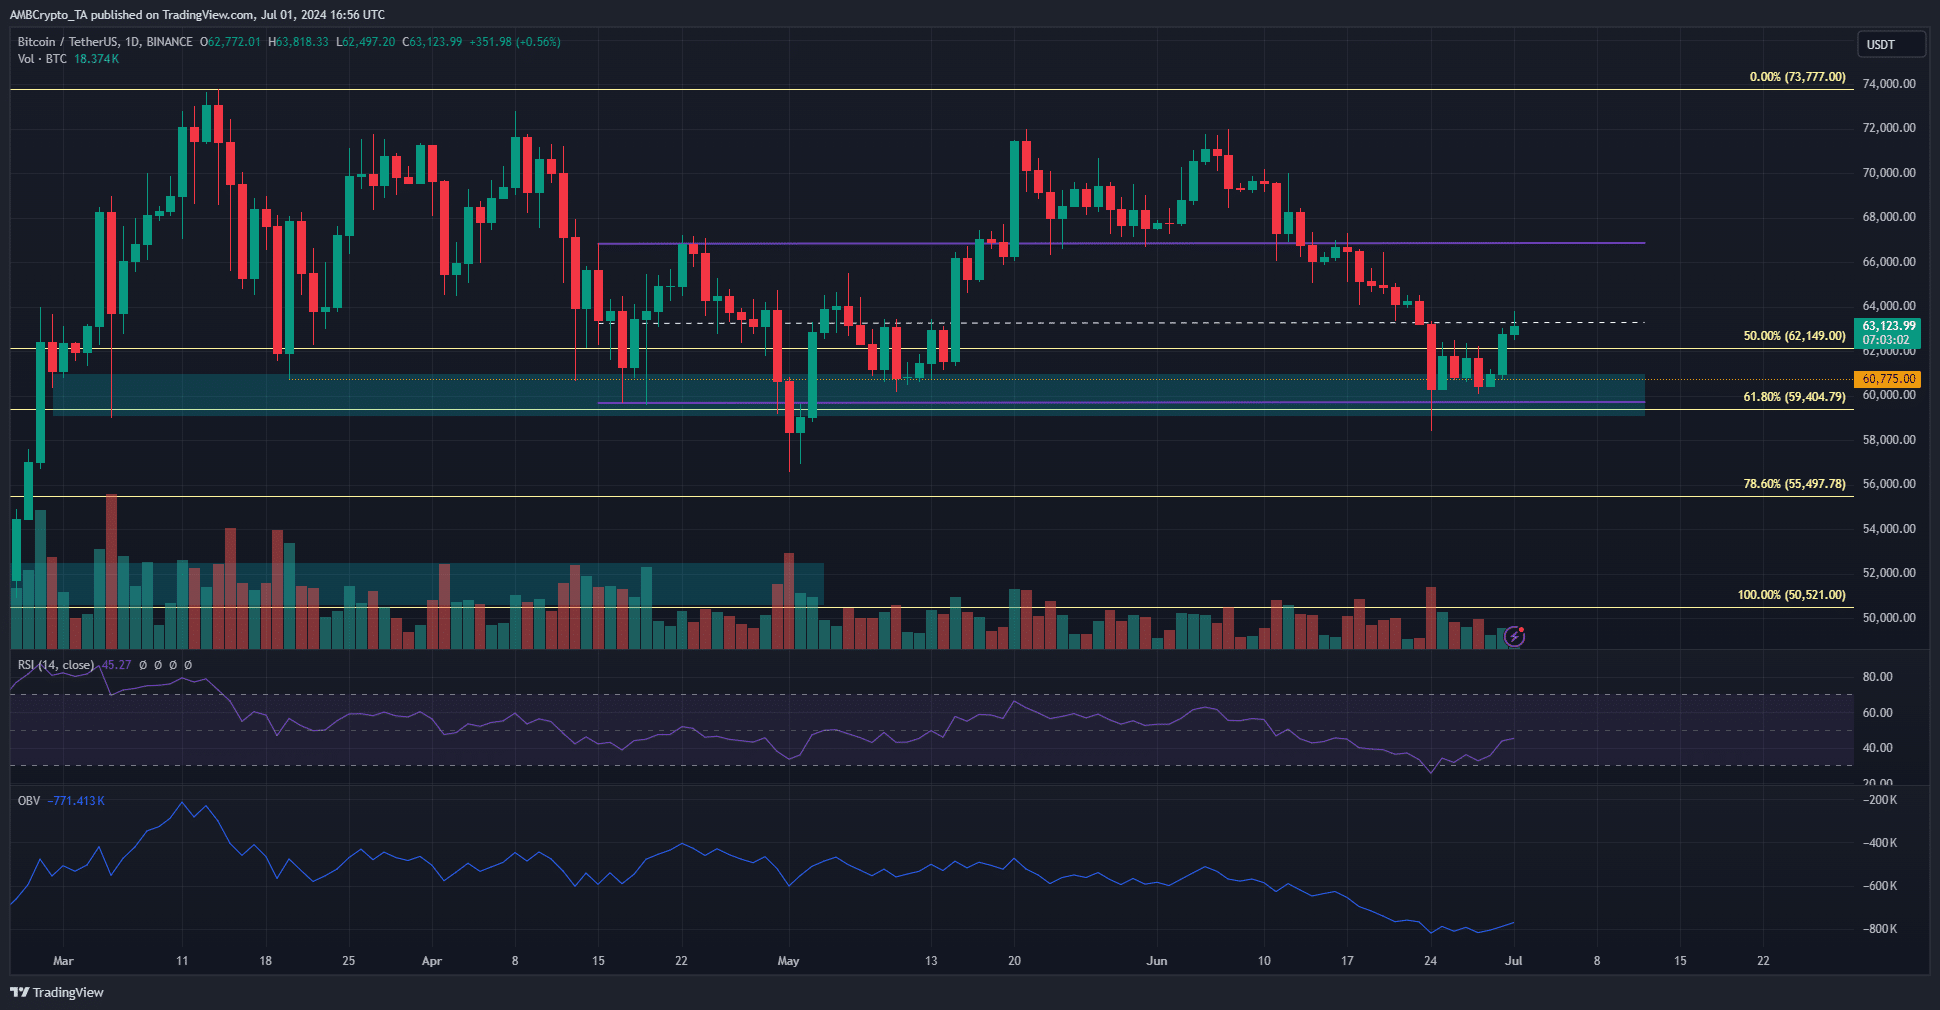
Source: BTC/USDT on TradingView
At press time, the mid-range mark at $63.3k served as resistance. The technical indicators showed that a bullish reversal on the higher timeframes was not yet in sight.
However, in the lower timeframes, the bearish sentiment of the past week and the lopsided futures market meant that liquidation levels to the north might be hunted.
The question of why Bitcoin is going up is partially answered there, but there are other factors at play too. Will the bulls drive prices higher?
The metrics indicate a network-wide accumulation but also hint at trouble
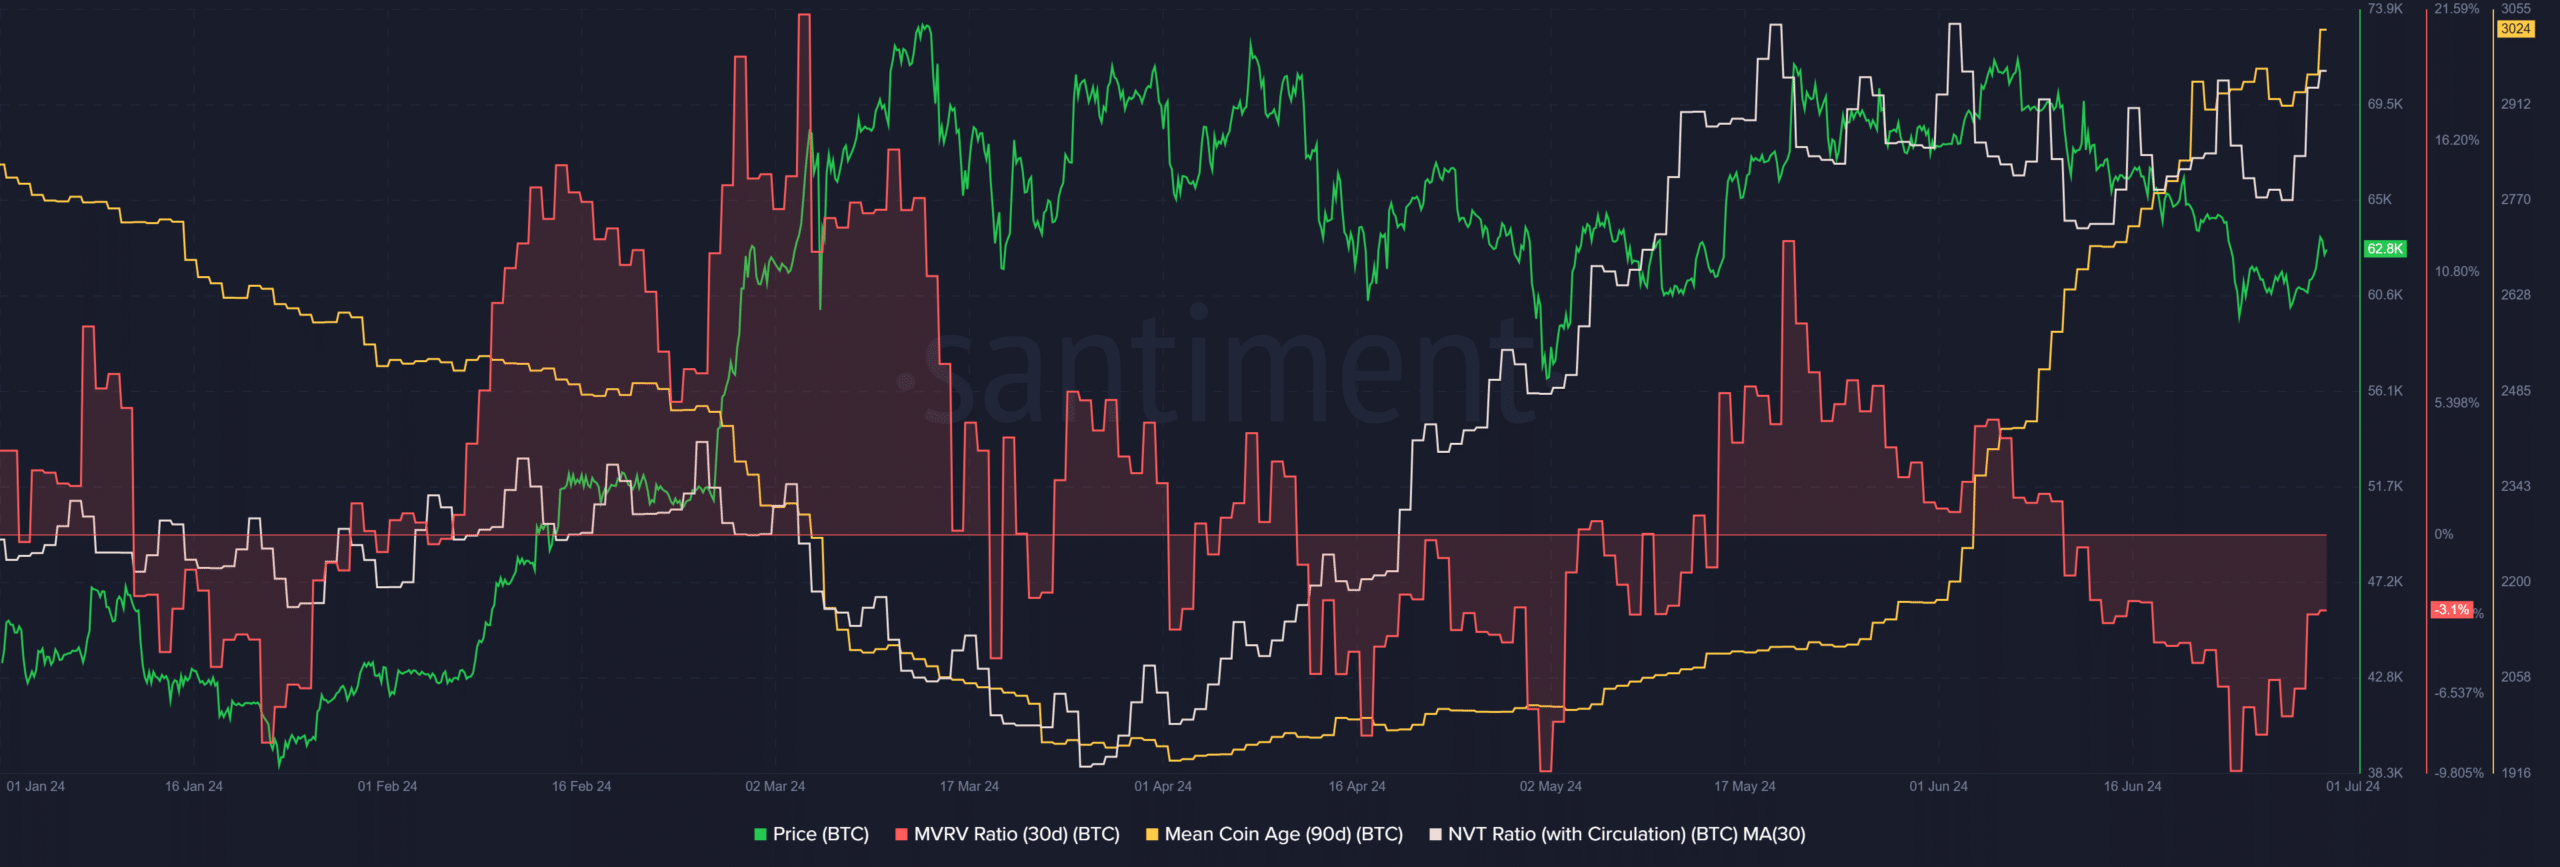
Source: Santiment
The 30-day MVRV ratio was negative, meaning that short-term holders were out of the money. However, in the past six weeks, the mean coin age has firmly trended higher. This was a positive combination.
It indicated accumulation amongst holders while also signaling an undervalued asset. Together, it marks a short-term buying opportunity. This could set up a rally for the king of crypto.
However, the Network Value to Transactions Ratio, calculated here based on circulation, showed that Bitcoin was overvalued when compared to the amount of BTC transacted on-chain daily.
This could hinder the bulls but is overshadowed by the MVRV and mean coin age combination.
The liquidity cluster beckons BTC upward
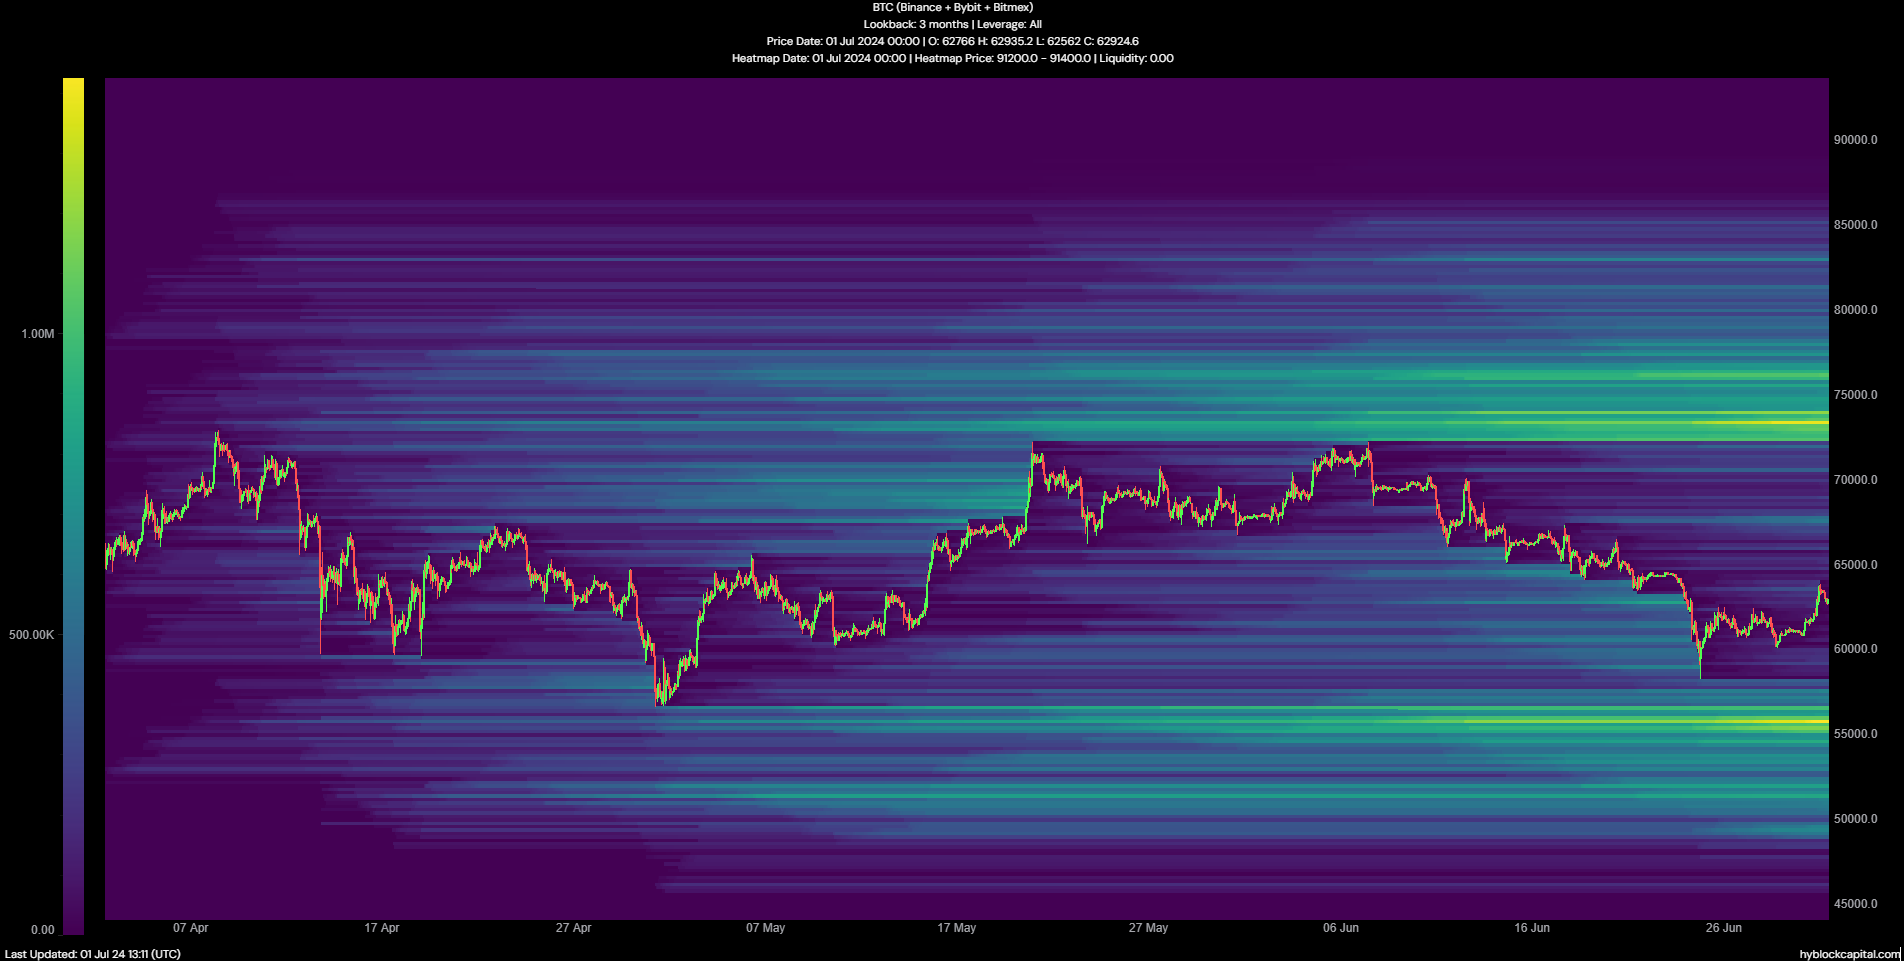
Source: Hyblock
The $55k liquidation cluster was not tested as the bulls halted the price from falling below the $60k psychological support. Not every zone of high liquidity needs to be tested. If the price continues to climb higher, the $73k zone is the next area of interest for traders.
The path forward is not straightforward for the bulls. A tweet from Head of Research at CryptoQuant, Julio Moreno, highlighted that Bitcoin miner capitulation was at hand and prices might have formed a local bottom.
Read Bitcoin’s [BTC] Price Prediction 2024-25
Another crypto analyst, Axel Adler, observed that it was the crypto exchanges that were largely snapping up the Bitcoin being sold in recent weeks and not the wider market.
While it is not inherently negative, the analyst believed that other cohorts of holders were selling and that this artificial demand might not be healthy in the long term.


