Why is crypto down today? Looking at Bitcoin, FED, and past week’s sell-off effects!
Based on the liquidation data from the past week, AMBCrypto found that a price move might be incoming.

- Bitcoin retained a bearish structure on the 4-hour chart
- Steady selling was seen recently, but sentiment appeared to point towards a price bounce
Bitcoin [BTC] saw its Christmas rally begin to fade, and an attempt to climb past the $100k-mark was halted on Boxing Day. The two-day U.S. Federal Reserve meeting that began on 17 December ended in a policy statement. One that forecasted just two interest rate cuts in 2025, instead of the previously projected four.
This saw the Dow Jones fall by over 2.5%, or just over 1,150 points. These losses have since been recovered, but the market has not been as kind to Bitcoin.
Risk-on asset status slows recovery
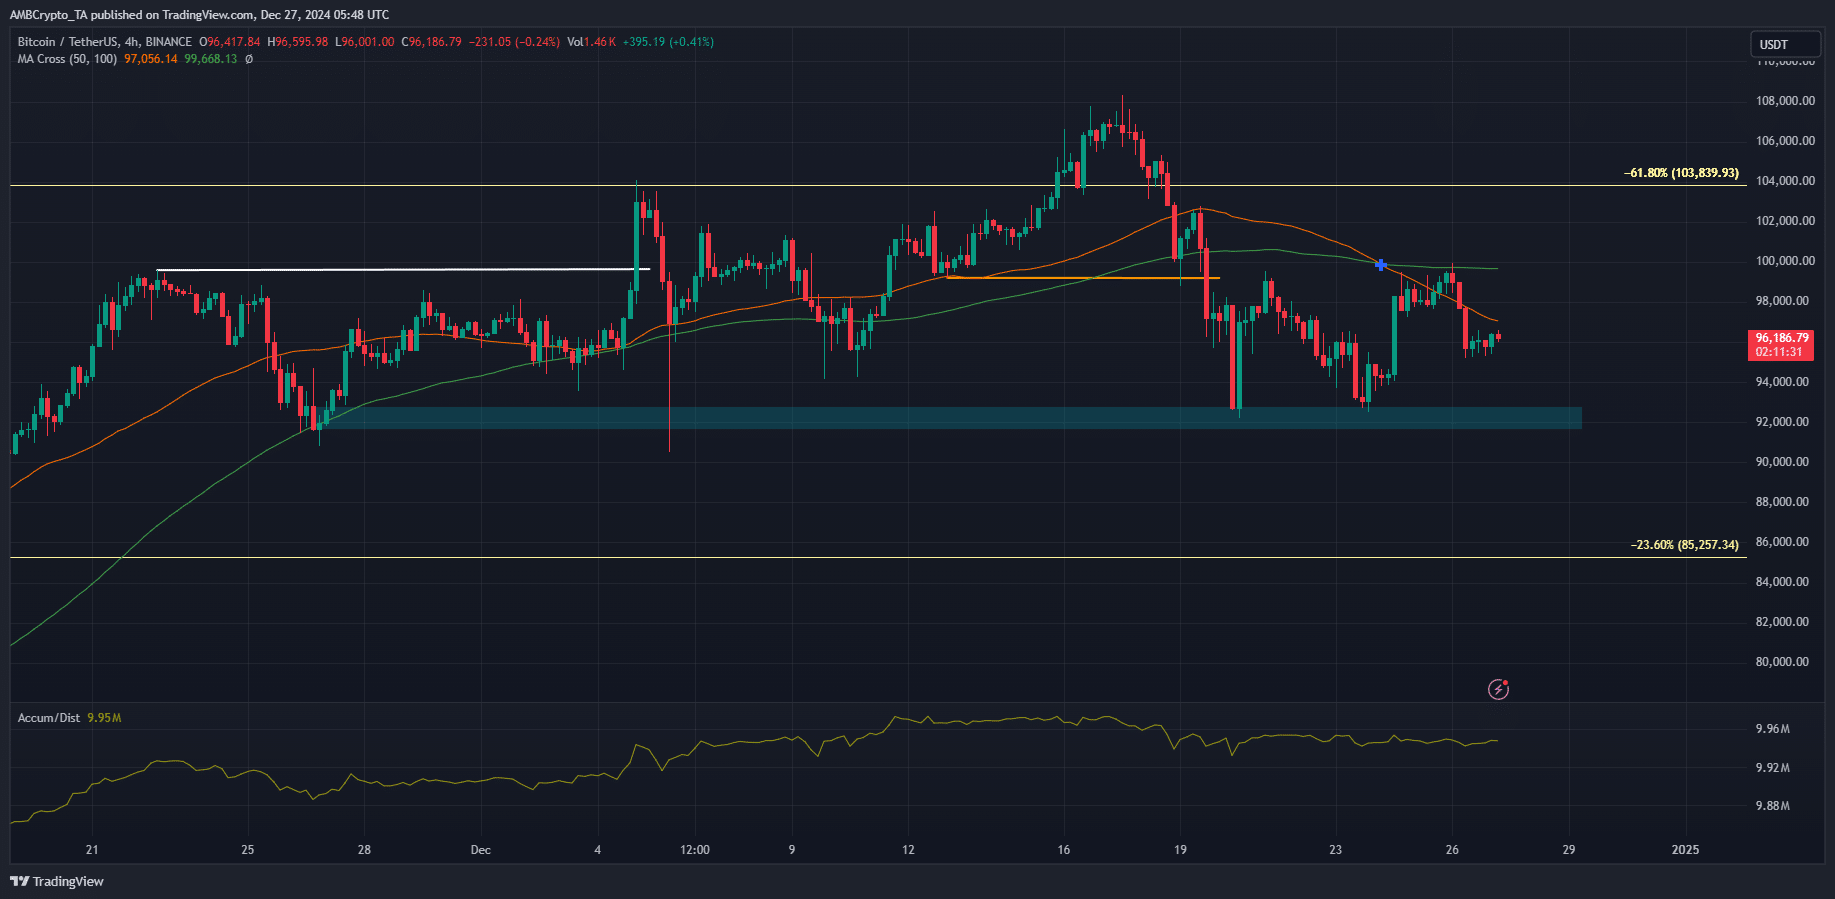
The wider crypto market generally follows the trend of Bitcoin. In the Last 24 hours, BTC fell by 2.75% and the altcoin market shed 2.31% of its value. Examining the trend of BTC on the 4-hour chart, we can see that the bearish market structure was still in play.
It was flipped bearishly on 19 December, marked in orange. Since then, the A/D indicator has also been on a slow decline, showing reduced buying pressure. The moving average formed a bearish crossover, further highlighting downward momentum over the last ten days.
Crypto is down today- Will it regain the uptrend next month?
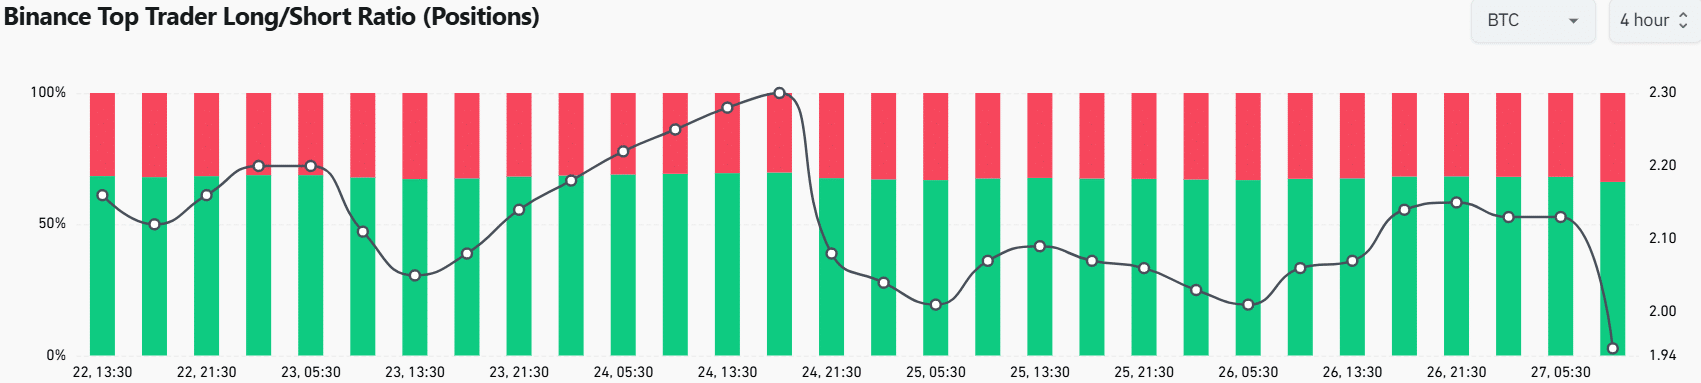
Analysis of top trader positions on Binance using Coinglass data showed that there is some short-term hope. AMBCrypto found that this metric, which measures the long or short positions held by the top 20% of traders, was at 1.95.
Long positions accounted for 66.12%, and shorts for 33.88% – A sign of bullish sentiment among the top traders.
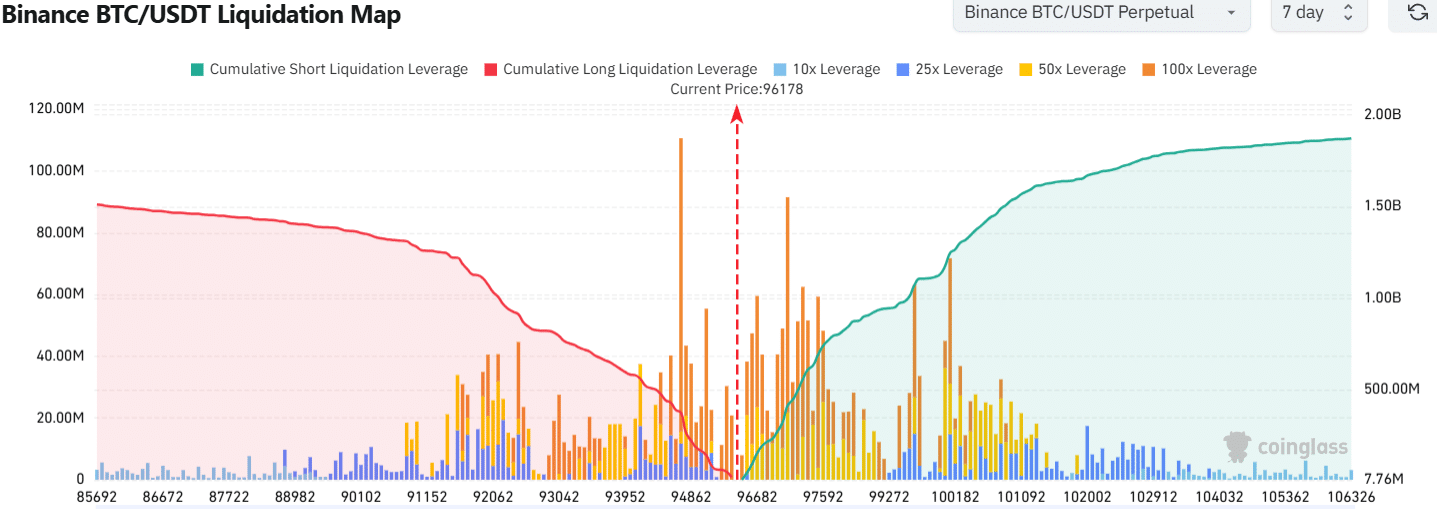
The liquidation map helped cement this bullish short-term idea. The liquidations to the north were more numerous, meaning that a liquidity hunt north was more likely in the coming days.
Is your portfolio green? Check the Bitcoin Profit Calculator
Based on the data from the past week, AMBCrypto found that a price move might be checked at the $97.6k-mark and rebuffed by sellers. Further volatility can be expected as 2024 nears its end.