
- The market sentiment soured, and liquidity pockets attracted prices lower.
- Bitcoin and Ethereum faced rejections at their respective resistance zones.
On the 26th of August, the total crypto market capitalization dropped from $2.216 trillion to $2.041 trillion the next day. This was a $215.87 billion or 9.7% drop across the market.
Certain tokens were affected more than others.
In the past 24 hours, the market prices have already begun rebounding. Bitcoin [BTC] and Ethereum [ETH] were up 3.84% and 6.82% respectively. But what could explain why crypto is down since the 26th?
Market participant behavior
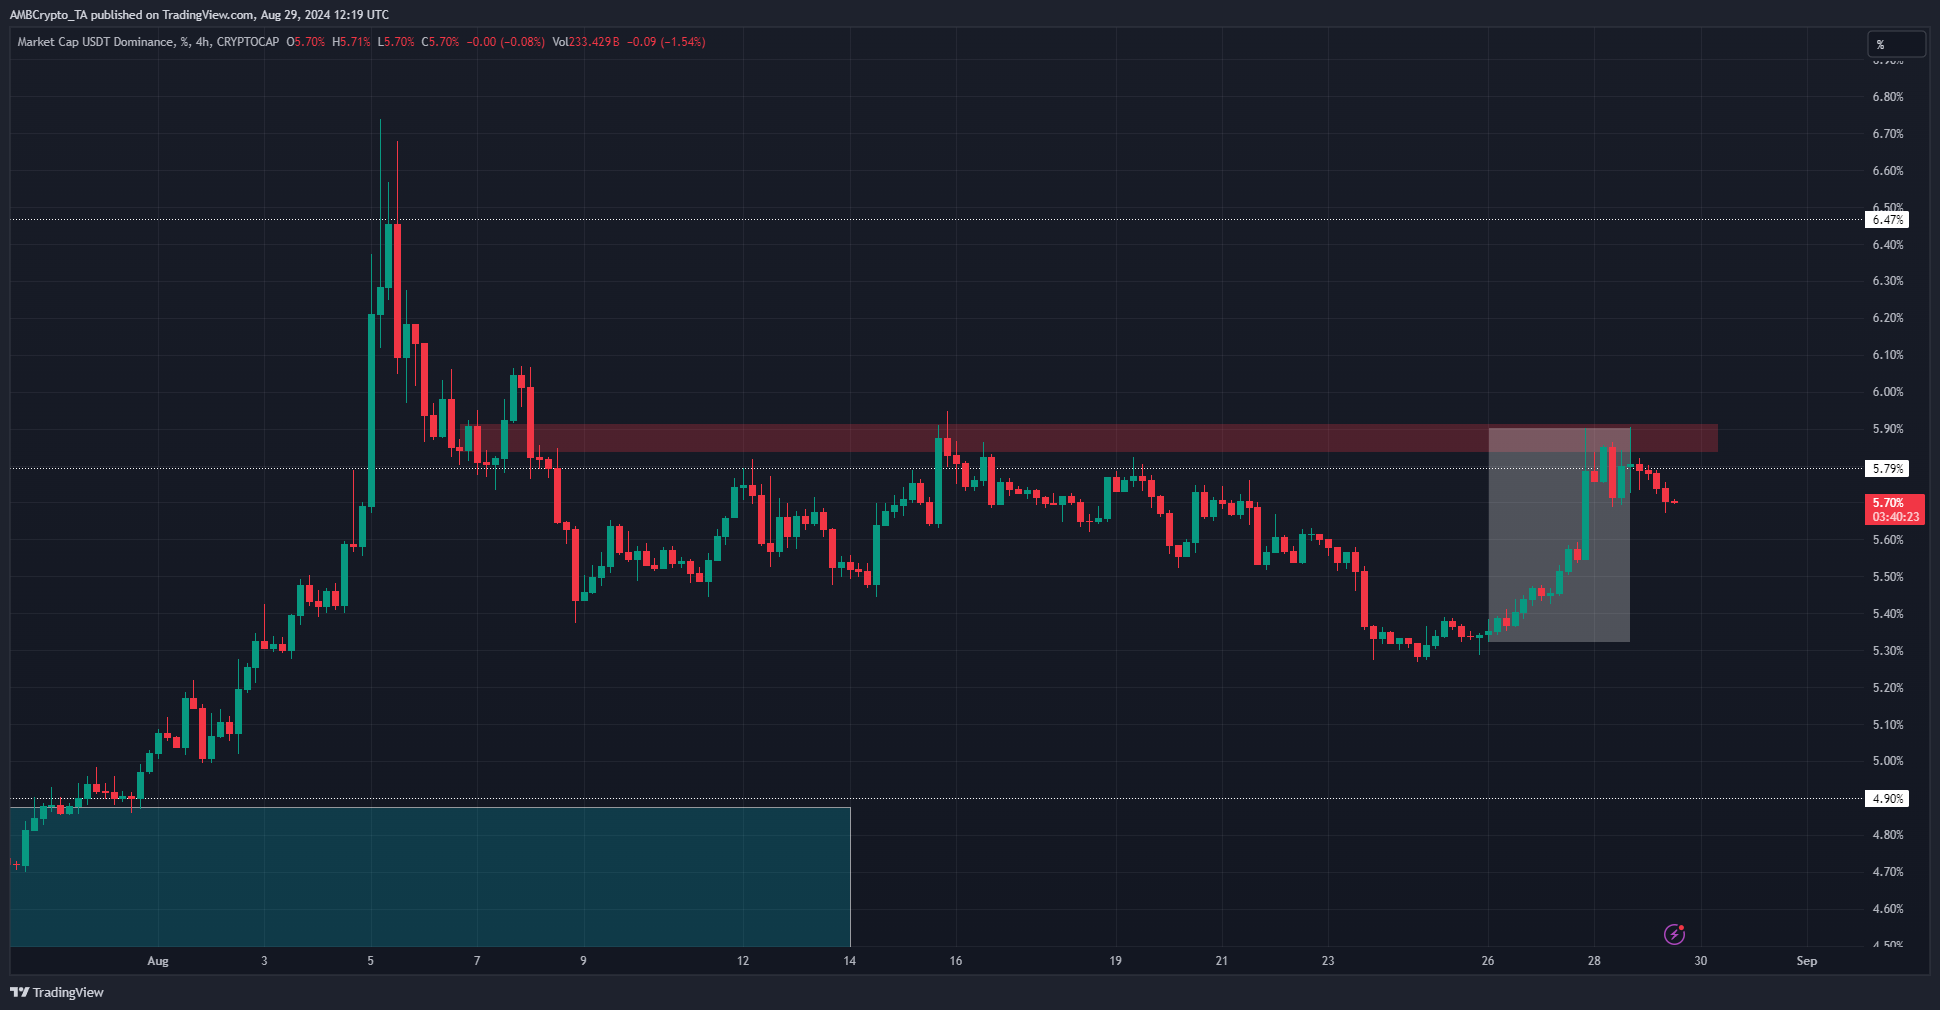
Source: USDT.D on TradingView
The Tether dominance chart measures Tether’s market capitalization as a share of the total crypto market cap. The chart above showed USDT.D rose by 10.91% from Monday, running into a resistance zone at 5.9%.
Since then, it has declined. The Tether dominance and crypto price movements are inversely related.
When USDT.D goes up it signifies more investors and market participants exchanging their crypto for Tether, implying a lack of confidence and a surge in sell pressure.
This has abated in recent hours and a price bounce was witnessed across the major altcoins and for Bitcoin.
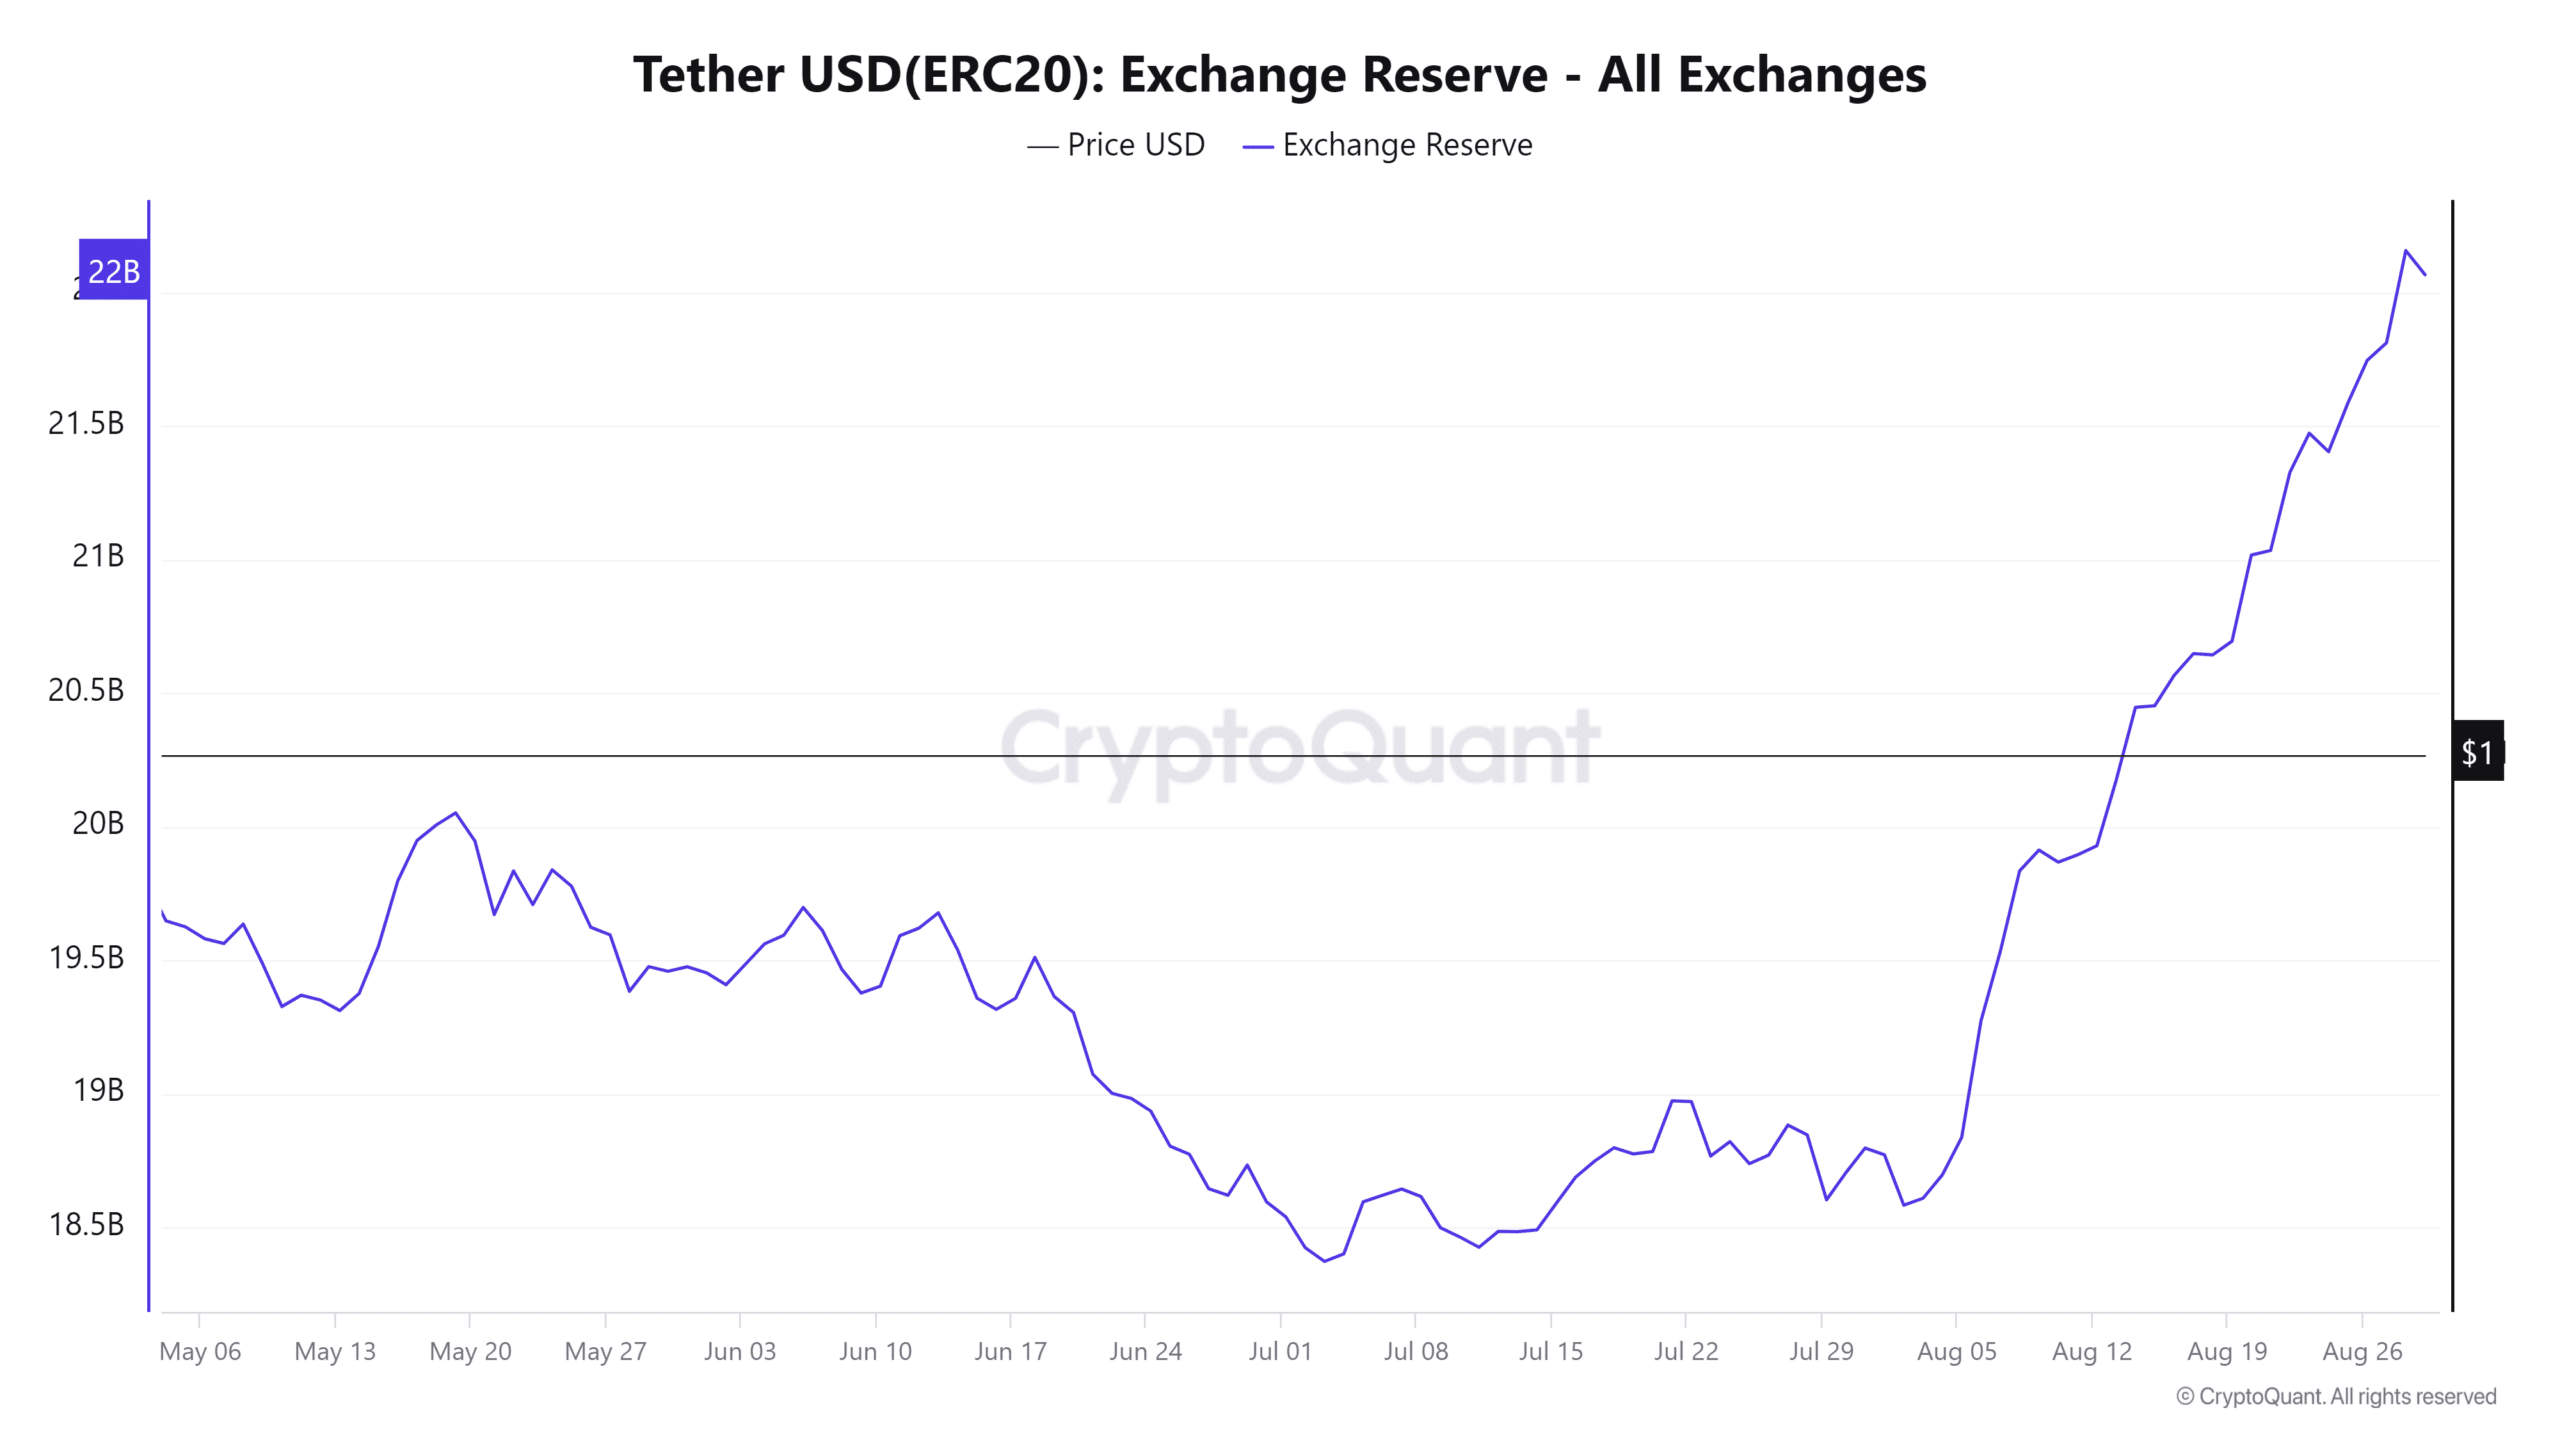
Source: CryptoQuant
The Tether exchange reserve has been trending higher since early August. It was an indication of rising buying power in the market.
However, it is hard to tell when the crypto market prices would begin to rally, but the metric showed that there is room for expansion.
Liquidity explains why crypto is down
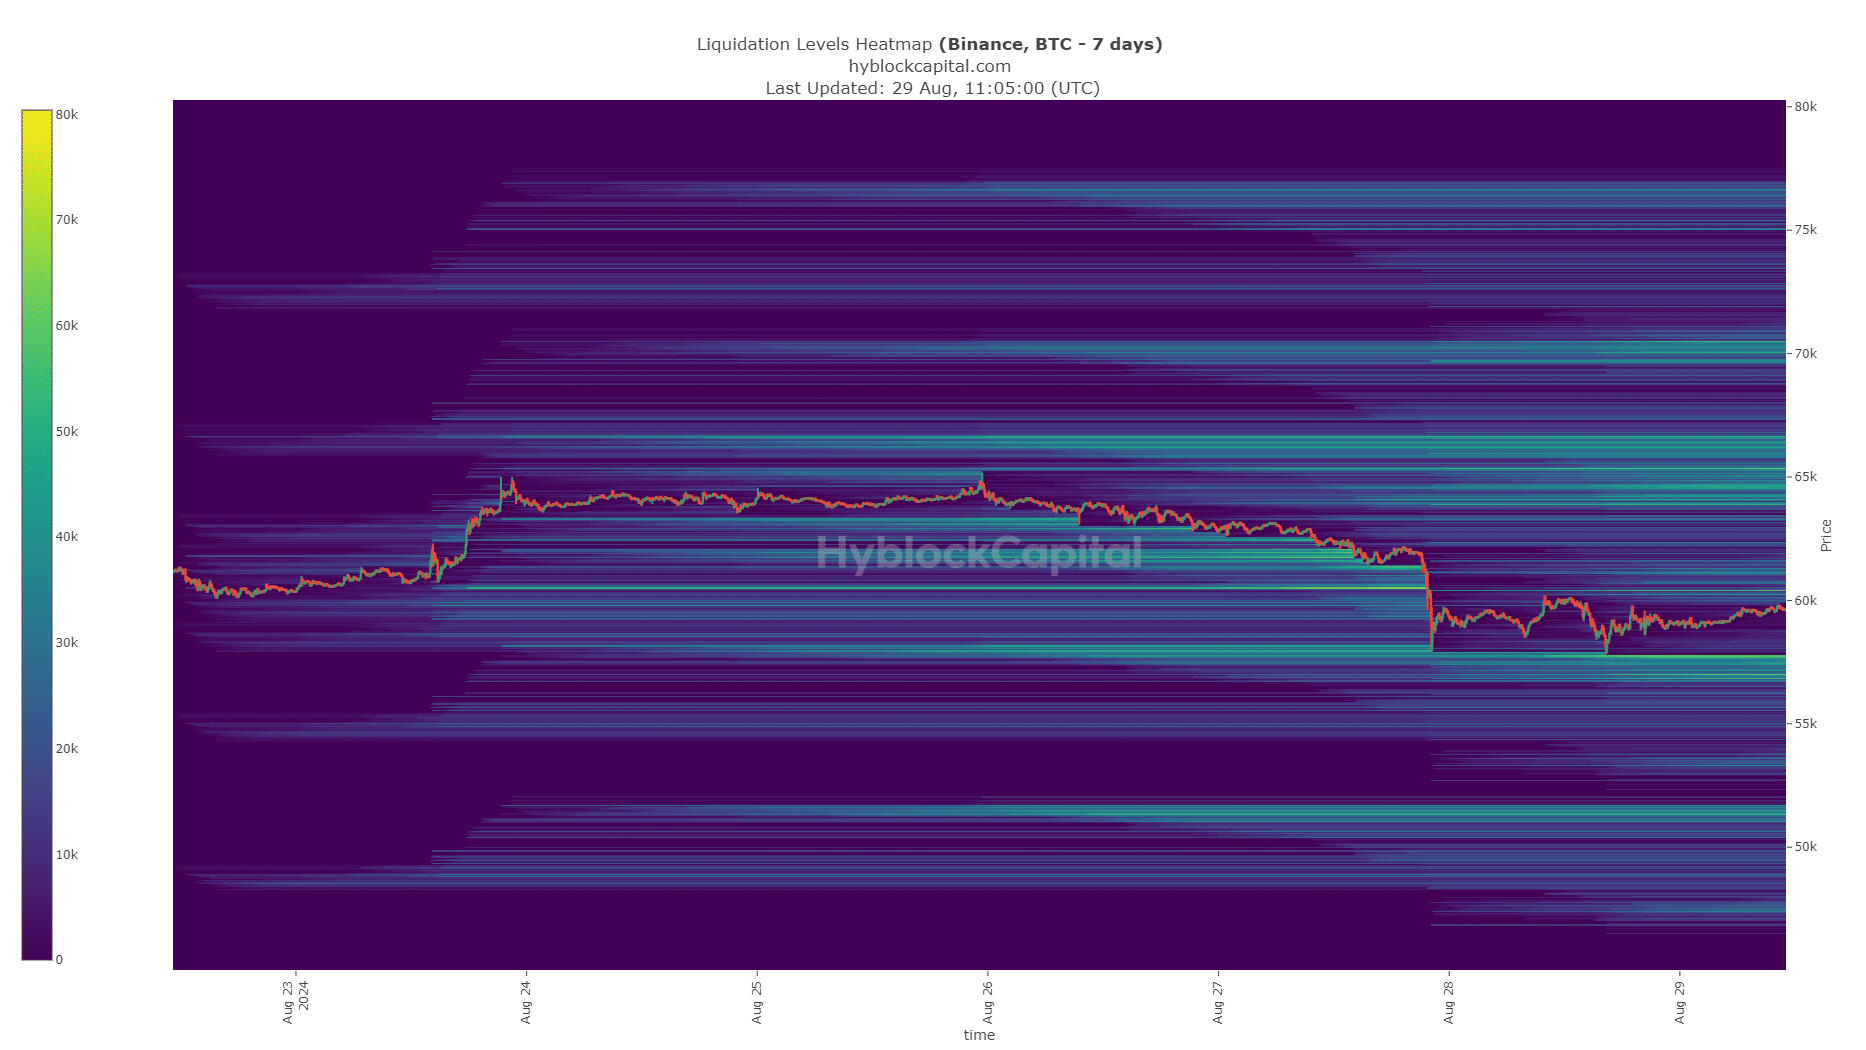
Source: Hyblock
Investors fleeing to stablecoins is a good measure of market sentiment. Another way to gauge where prices are likely to go is from the liquidation charts.
Since Bitcoin and Ethereum are the largest assets and most major altcoins’ price performance has a high positive correlation with them, AMBCrypto decided to examine their liquidation heatmaps.
On the 27th of August, Bitcoin plunged through multiple short-term liquidity clusters, quickly reaching the $58k liquidity pool. It has stabilized since then, but liquidity is a key driver of price movements.
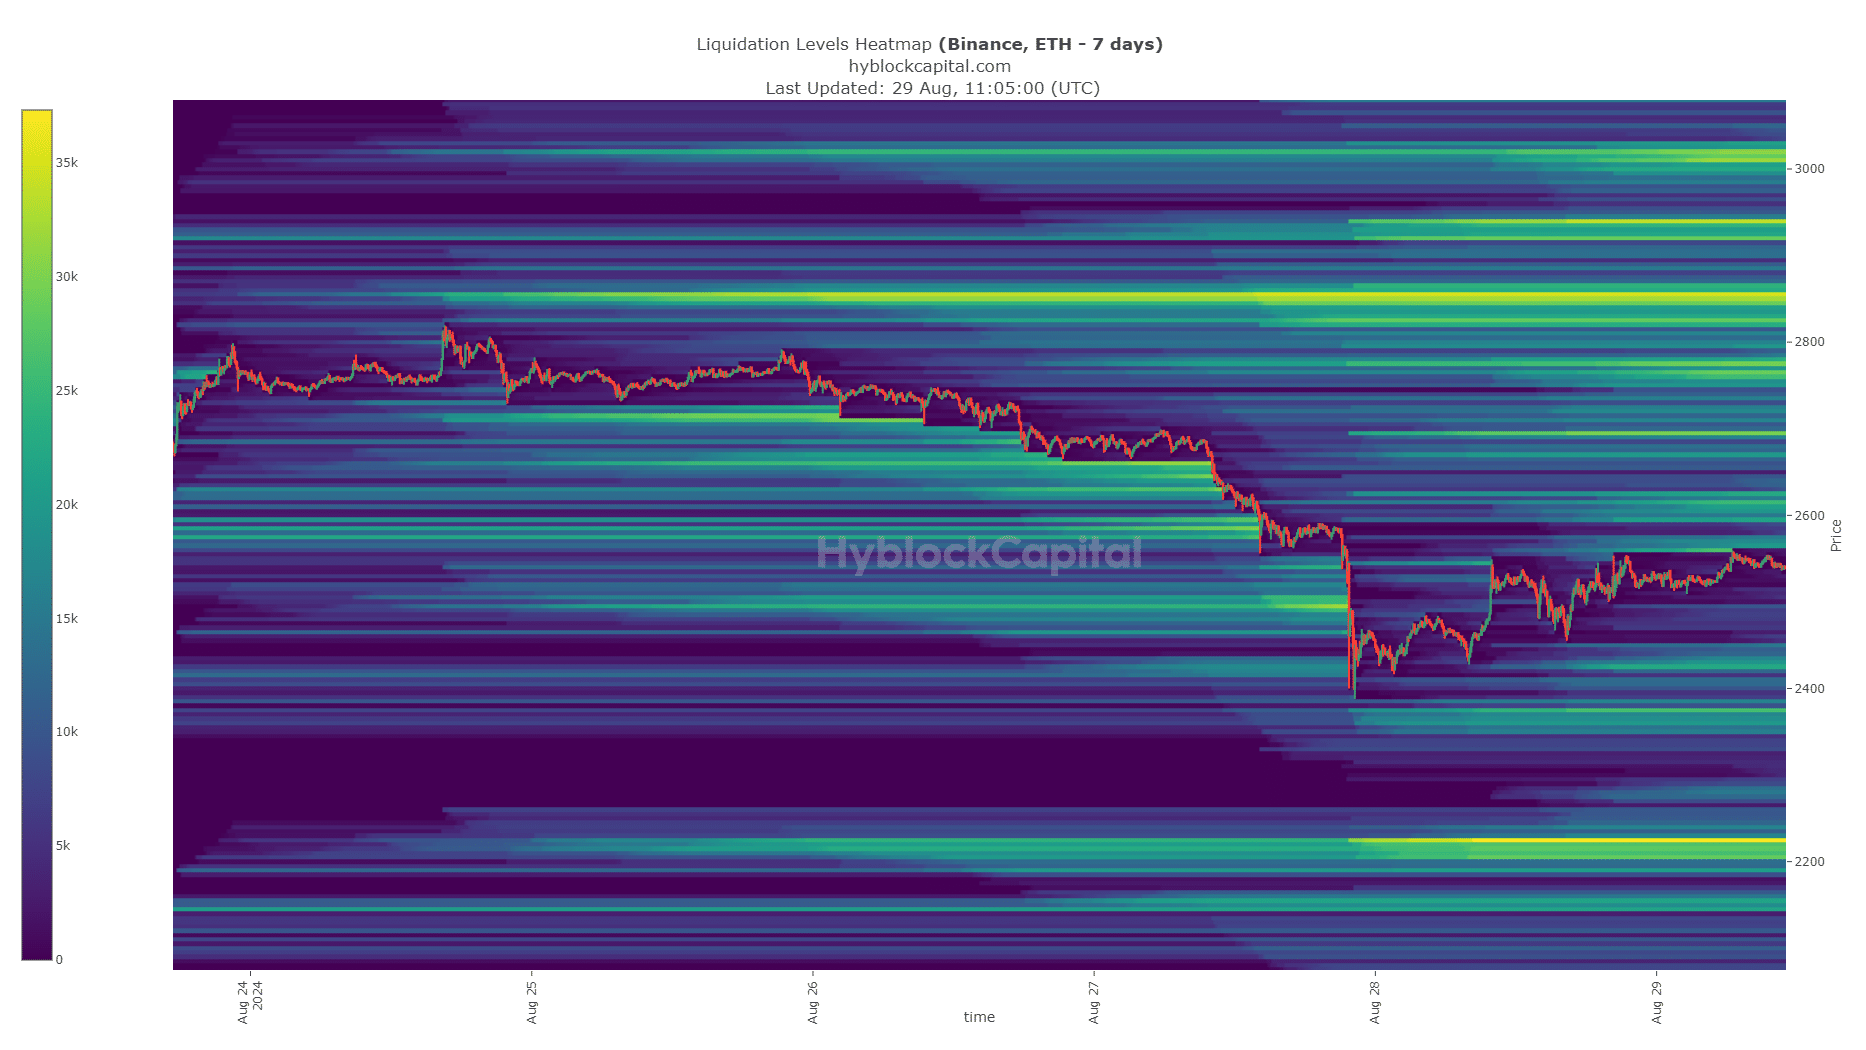
Source: Hyblock
Read Bitcoin’s [BTC] Price Prediction 2024-25
Ethereum also saw a dense cluster of liquidation levels hit at $2490, but ETH continued to drop and reached the $2415 pocket. At press time, it appeared headed for the $2.6k liquidity band.
Liquidity and market sentiment were the key factors behind why crypto is down. The move caused millions of dollars in liquidations, and the crypto market could consolidate over the next few days.


![Ethereum's [ETH] short-term price targets - Is the $2,300 resistance too strong?](https://ambcrypto.com/wp-content/uploads/2025/03/Evans-1-min-400x240.png)