


Disclaimer: The information presented does not constitute financial, investment, trading, or other types of advice and is solely the writer’s opinion.
- PEPE has a strong bearish structural bias on the 4-hour chart.
- A short-term range could be viable for scalp traders.
At the time of writing, Pepe [PEPE] had dropped out of the top 100 cryptocurrencies by market capitalization. It sat at 105th with a market cap of $260.9 million.
Read Pepe’s [PEPE] Price Prediction 2023-24
Selling pressure on the meme coin was hefty and technical analysis showed that the downtrend was not likely to let up anytime soon. The coin lacked momentum over the past week, but there was a high probability of further PEPE losses in September.
The Fibonacci extension level to the south beckons PEPE on the chart
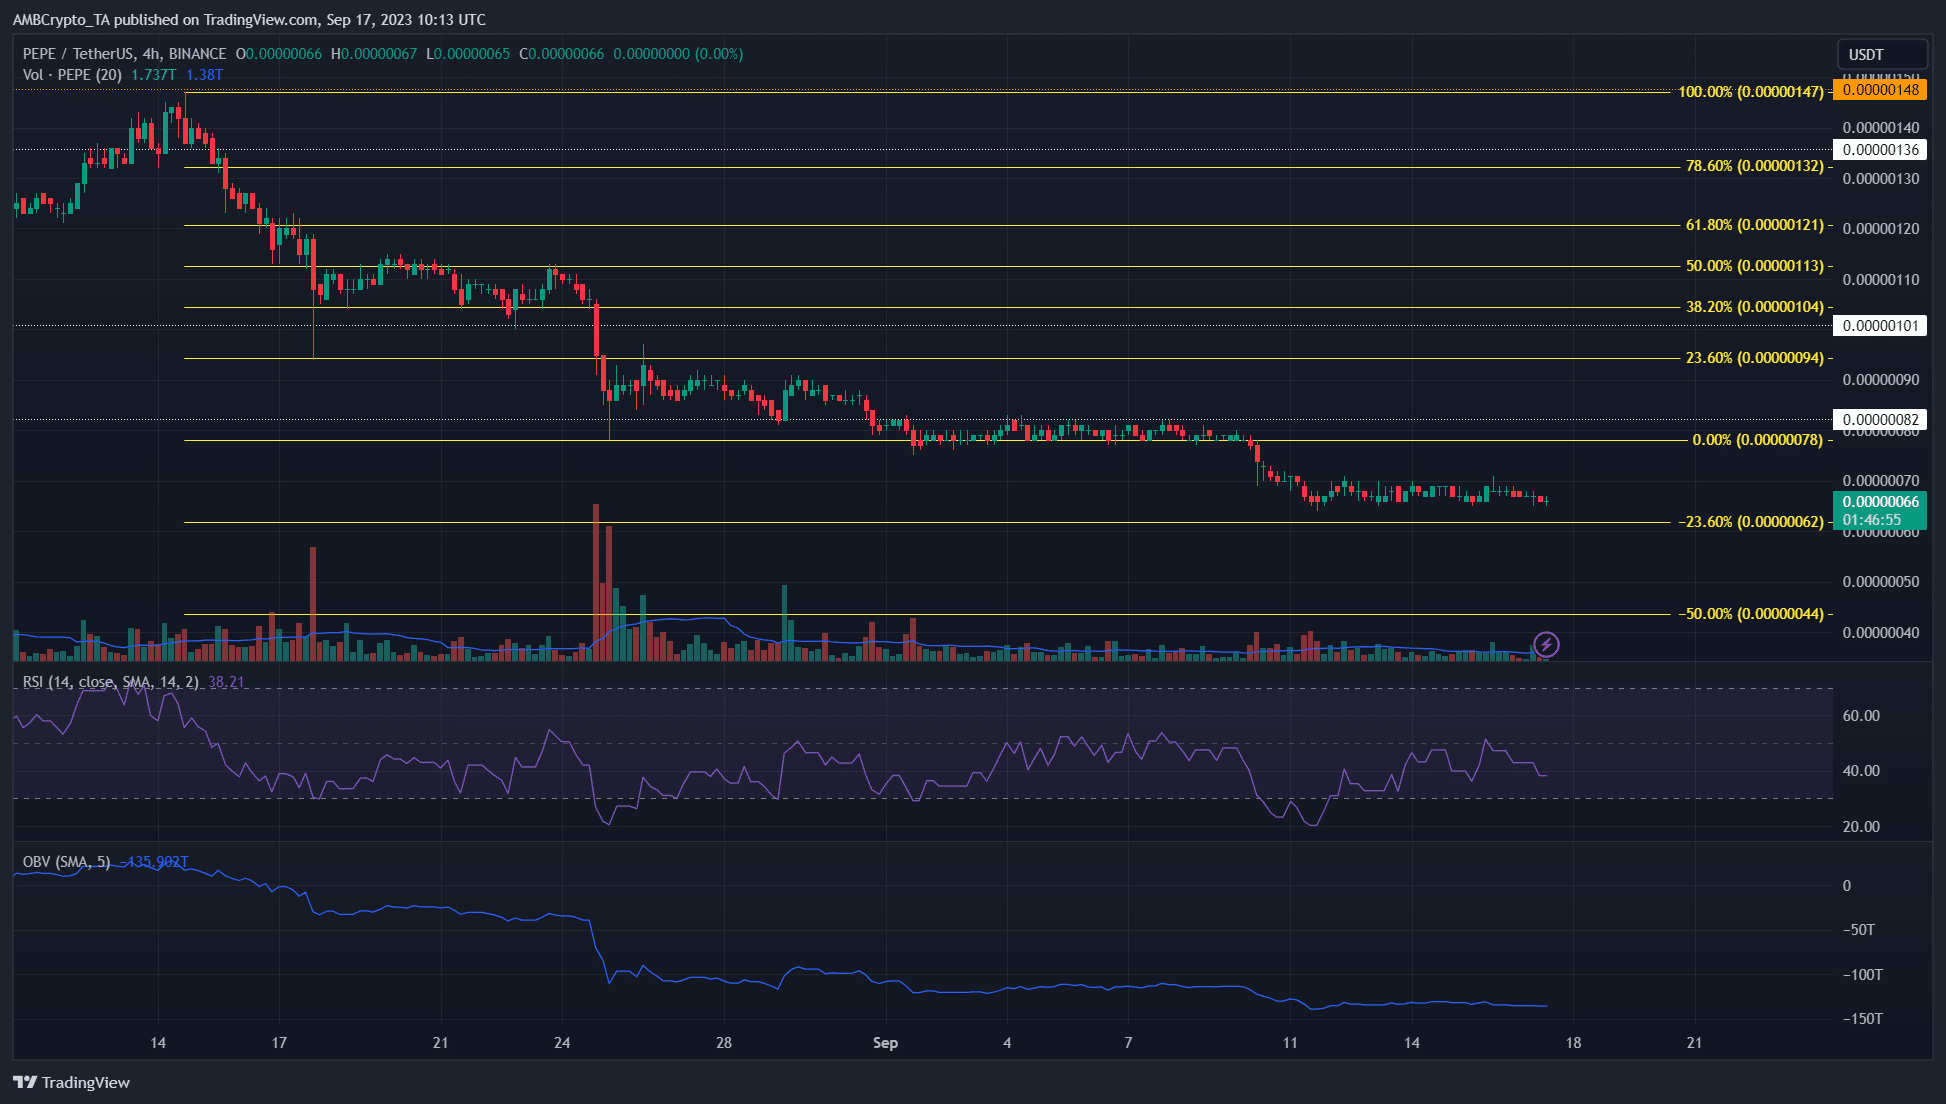
The price action since 14 August showed that PEPE has descended lower on the charts. The market structure on the 4-hour chart flipped bearishly on 15 August. During that time the meme coin saw a sharp downturn.
This move southward was used to plot a set of Fibonacci retracement and extension levels (yellow). They revealed that the 23.6% and 50% extension levels sat at $0.00000062 and $0.00000044. These support levels were 6.7% and 33.7% lower on the chart than the price of PEPE at press time.
The market structure has remained bearish in the past month, and the RSI agreed with this finding. It was unable to climb past neutral 50 since 15 August, reinforcing the idea of a downtrend. The OBV has also steadily moved southward to highlight the lack of bullish conviction in the market.
The lower timeframe market sentiment remained bearish
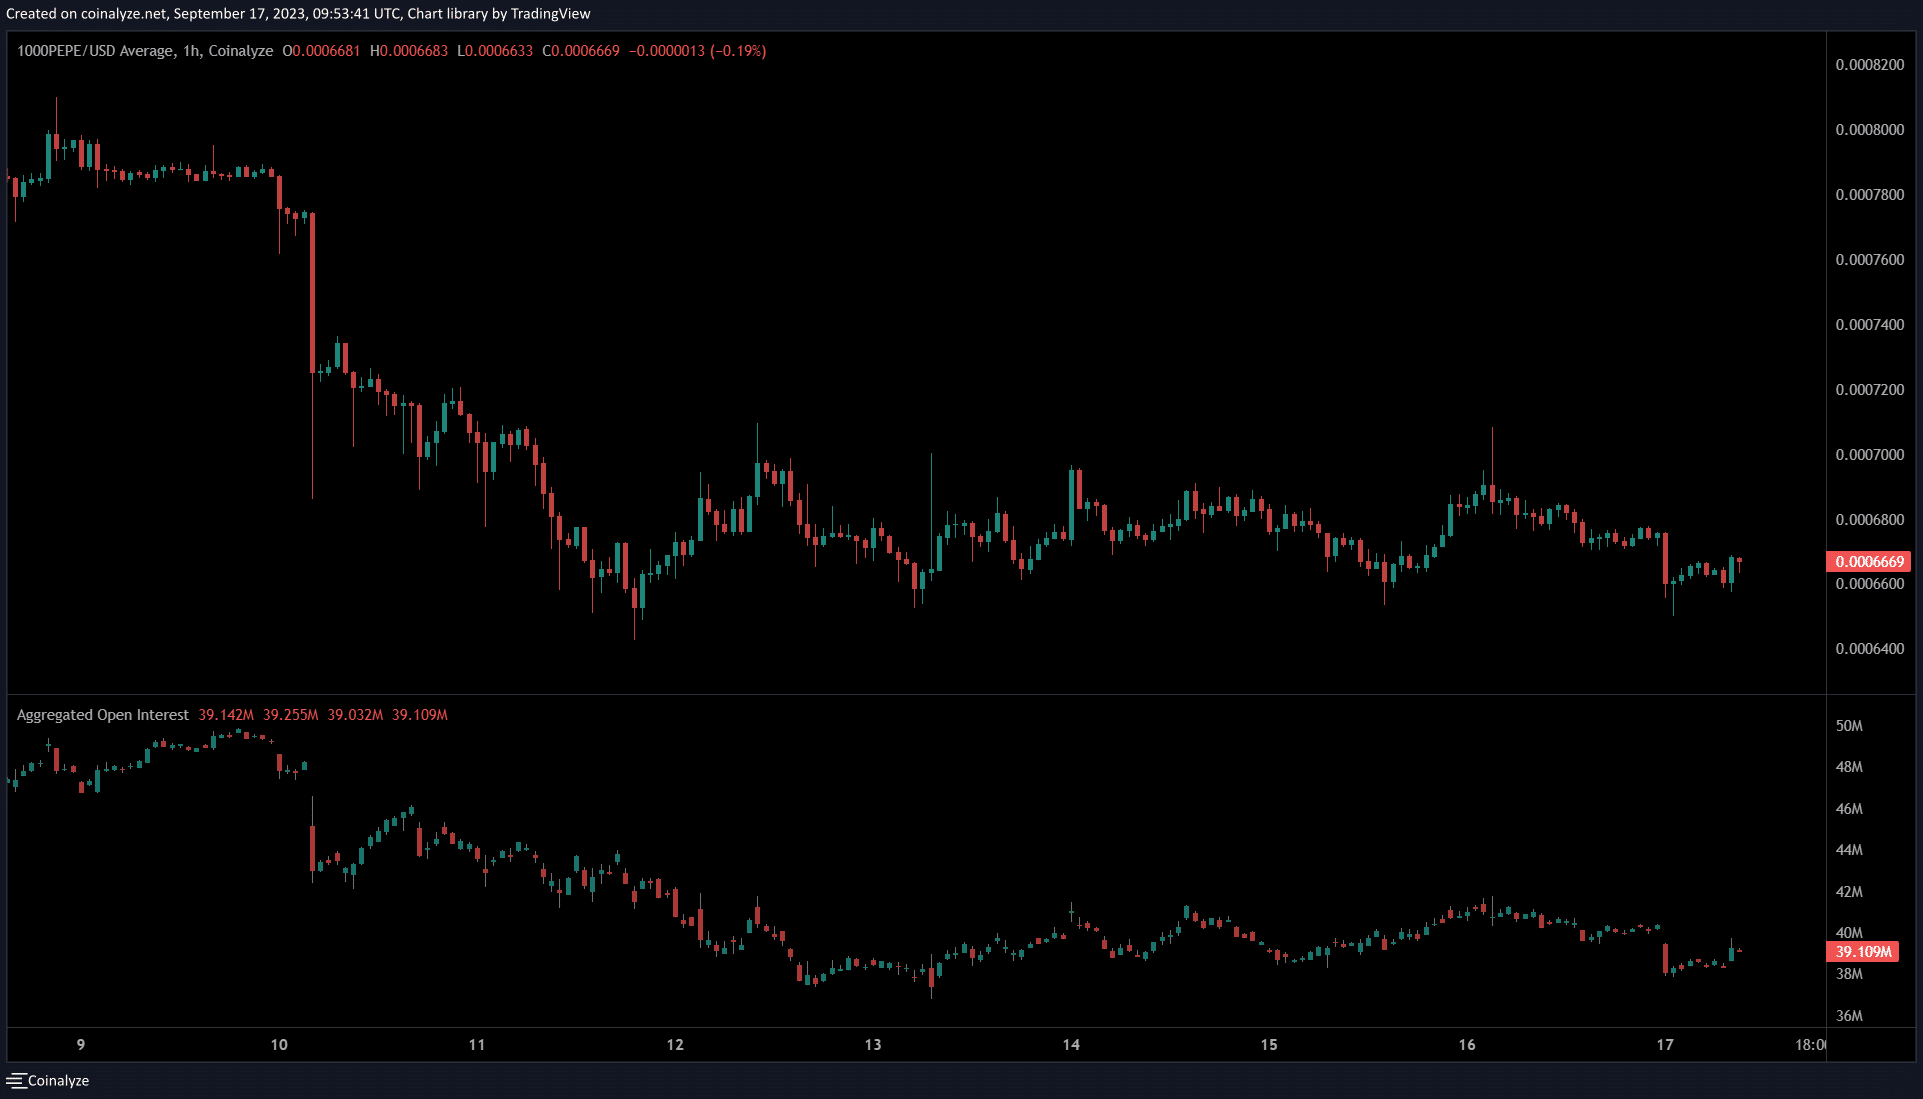
The 1-hour chart from Coinalyze highlighted the short-term range that PEPE has traded within over the past week. The range extended from $0.0000007 to $0.00000066. Scalp traders can look to trade within this range and book profits.
How much are 1, 10, or 100 PEPE worth today?
The Open Interest has climbed higher since 13 September even though PEPE lacked a firm trend. This hinted at bidding from early bulls, but it was unclear if they foreshadow a bounce in prices. Traders can wait for a bounce to the $0.00000074-$0.00000078 region to assess entering short positions.