Why Polkadot intraday traders can look for shorting opportunities

Disclaimer: The findings of the following analysis are the sole opinions of the writer and should not be considered investment advice.
USDT Dominance is a metric of the share of the crypto market cap held by USDT. In the past two weeks, this metric was in an uptrend. This showed market participants increasingly choosing to hold the USDT stablecoin rather than any crypto asset, and highlighted periods of selling pressure.
Polkadot has also seen strong bearish momentum in recent days as it crashed through another support zone on the price charts.
DOT- 12-Hour Chart

On the 12-hour chart, there were many levels that had served as support in the past three months that were eventually flipped to resistance.
The most important zones of support were highlighted by the red box. The $9.5 zone was an area that the bulls absolutely needed to push past. The $10 psychological level was just overhead, and the $10.57 technical level was only slightly further north.
After the sudden plummet in early May, DOT buyers desperately tried to defend the $9.5 region. However, June brought more fear with it and the bulls were soon overwhelmed. Thereafter, the price sank to the $6.6 mark, where it tried to bounce back multiple times.
The most successful of these attempts managed a rally to $9.68. Although it measured 43% in magnitude, it was still a failed rally as it failed to flip the longer-term market structure to bullish.
In recent weeks, the price fell beneath the $6.6 area as well, and at the time of writing saw a bounce from $6 to reach the former support region again.
Hence, higher timeframe traders can look for shorting opportunities. Based on the Fibonacci extension levels (yellow) a drop to $6 and even $4.94 could occur in the coming weeks.
Rationale
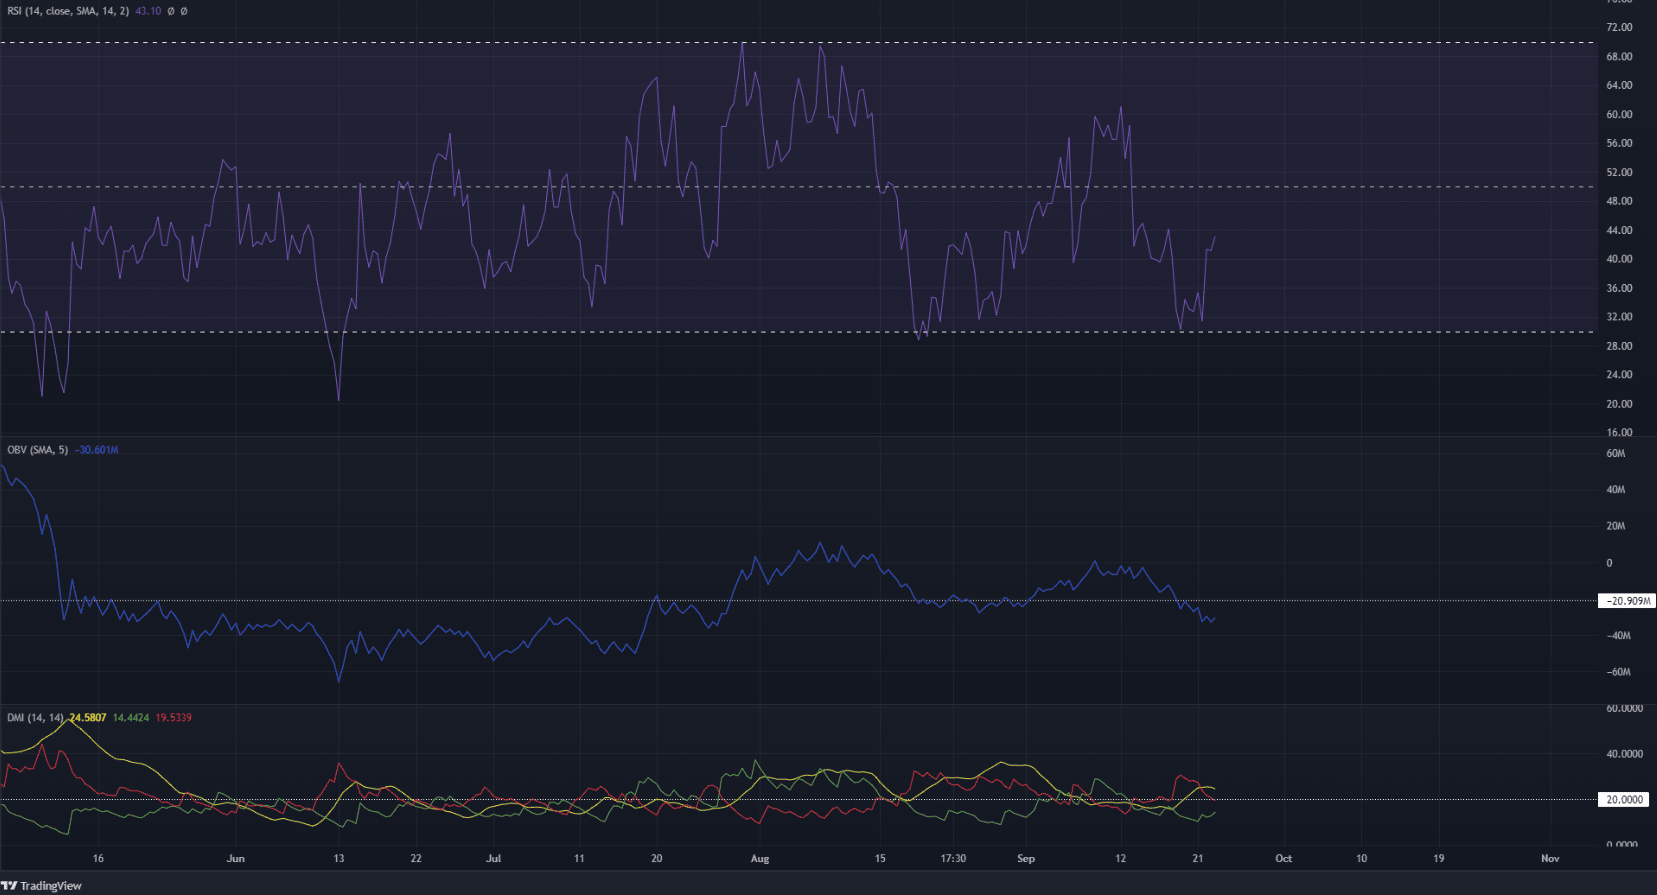
The indicators showed a bearish picture as well. The RSI fell below neutral 50. Even during the surge to $9.6, the RSI was unable to push past the 60 region and show strong bullish momentum on the H12 timeframe. The OBV also fell below a level of support.
The Directional Movement Index saw the ADX (yellow) at 24.5 and -DI (red) at 19.5. Hence the indicator also stood on the verge of showing a strong downtrend in progress.
Conclusion
Intraday traders can look for shorting opportunities behind Polkadot after an examination of the H12 timeframe showed a bearish bias. The selling pressure behind Bitcoin in the past two weeks meant another move downward was likely.


