Why Polkadot’s recovery faces headwinds
Polkadot’s [DOT] bulls face multiple obstacles, from the mid-range to the range high. Will the recent recovery be sustainable?

Disclaimer: The information presented does not constitute financial, investment, trading, or other types of advice and is solely the writer’s opinion.
Polkadot’s [DOT] ongoing recovery is headed into a bearish zone, which may impact traders if a price reversal occurs. A previous report entailed that DOT had a selling opportunity if bulls were discouraged in the same bearish zone.
This time, there are more hurdles to clear before reaching the high range. Meanwhile, Bitcoin [BTC] has reclaimed $27k, but it remains to be seen if it will retest the $28k level again.
DOT edging higher to multiple roadblocks
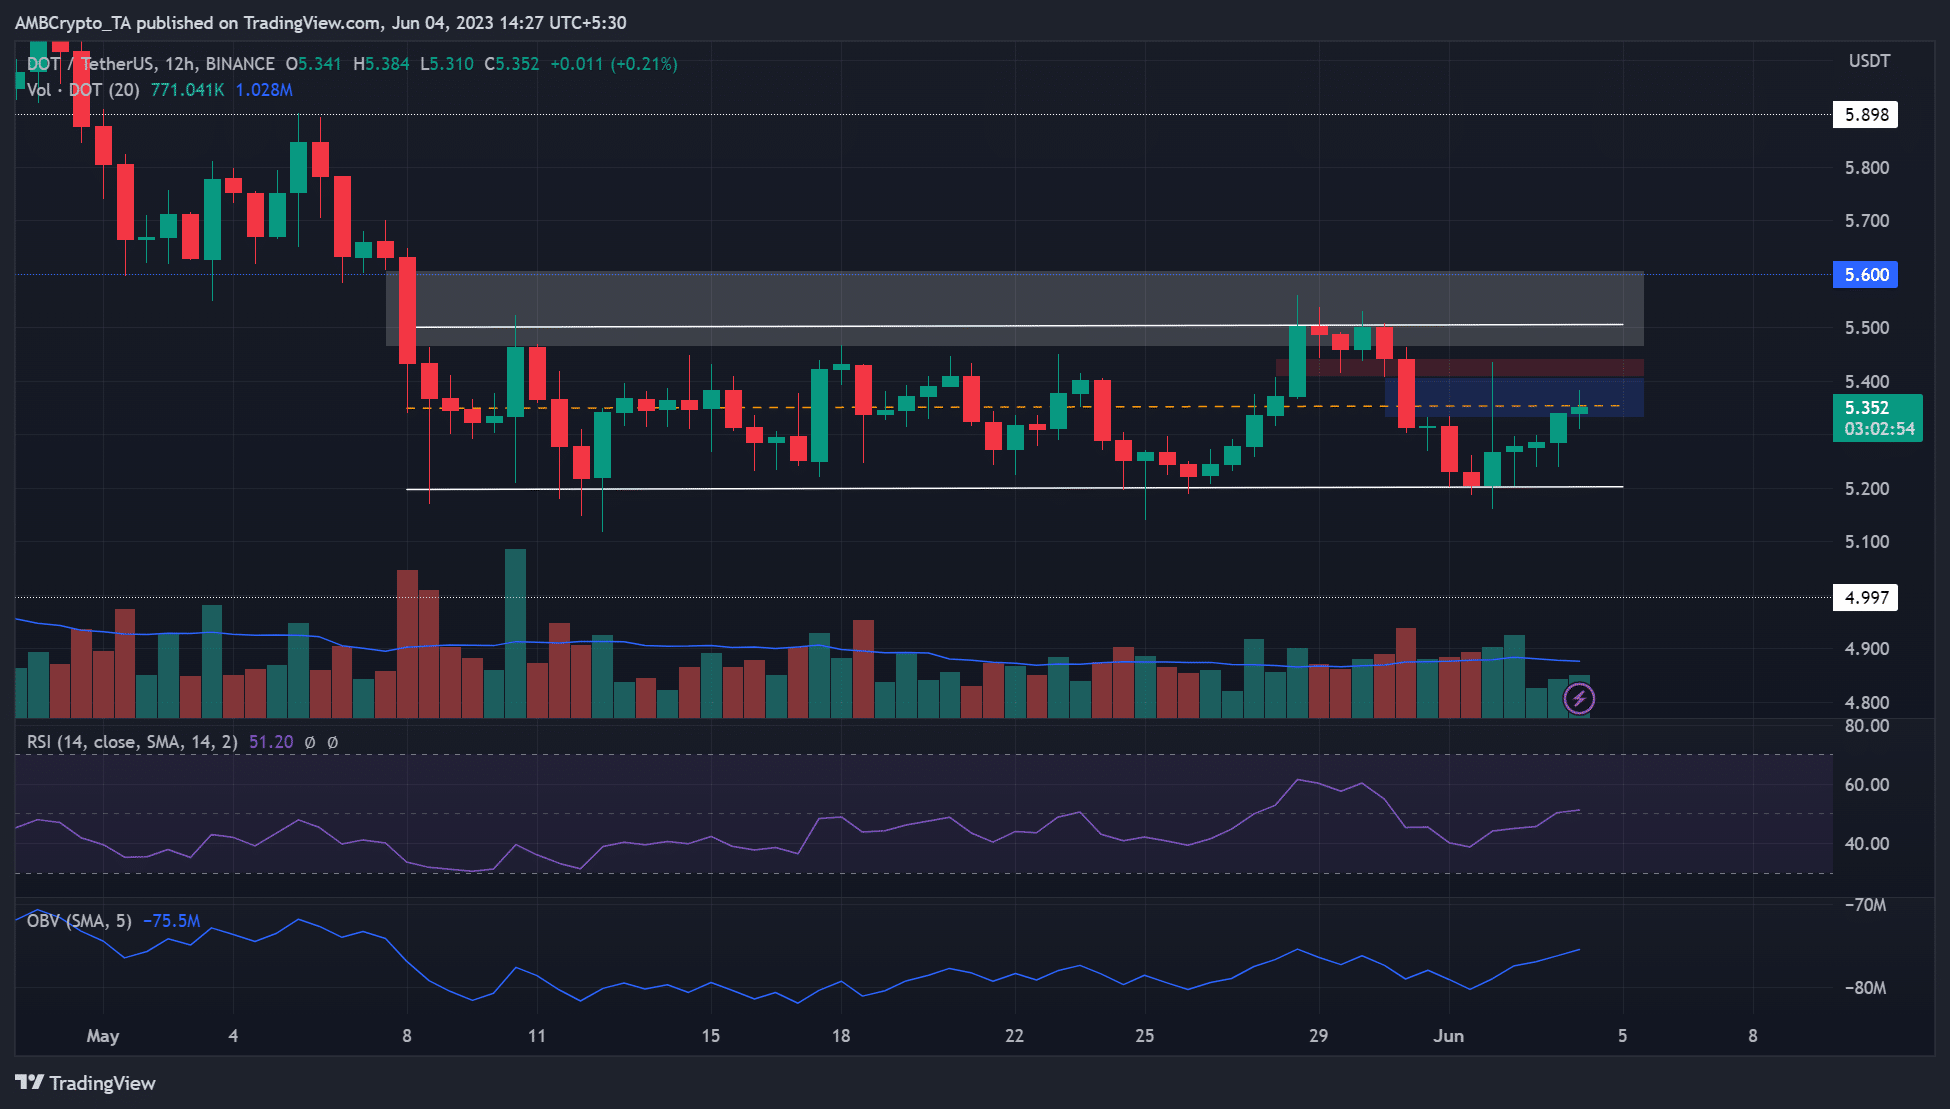
Above the rally lies a couple of FVG (fair value gap) zones. The first FVG zone ($5.47 – $5.61), white, was formed during the drop on 8 May.
The second FVG (red) was formed just above the mid-range level of $5.35, while the third one (blue) aligns with the mid-range. This could make the area above the mid-range a key bearish stronghold unless BTC reclaims $28k.
Otherwise, a price rejection could be imminent in the mid-range if BTC falters. Such a move could tip sellers to extend gains to the range low of $5.2.
Alternatively, DOT could push through the FVGs and hit the range high of $5.51 if BTC retests $28k. But it could falter again at this level as the range high aligns with another FVG zone (white) of $5.47 – $5.61, especially if BTC cannot go beyond $28k.
The RSI and OBV registered upticks, confirming the recent buying pressure and demand. However, RSI rested in a neutral position, and the price could take either direction.
The CVD spot is up in June
Is your portfolio green? Check out the DOT Profit Calculator
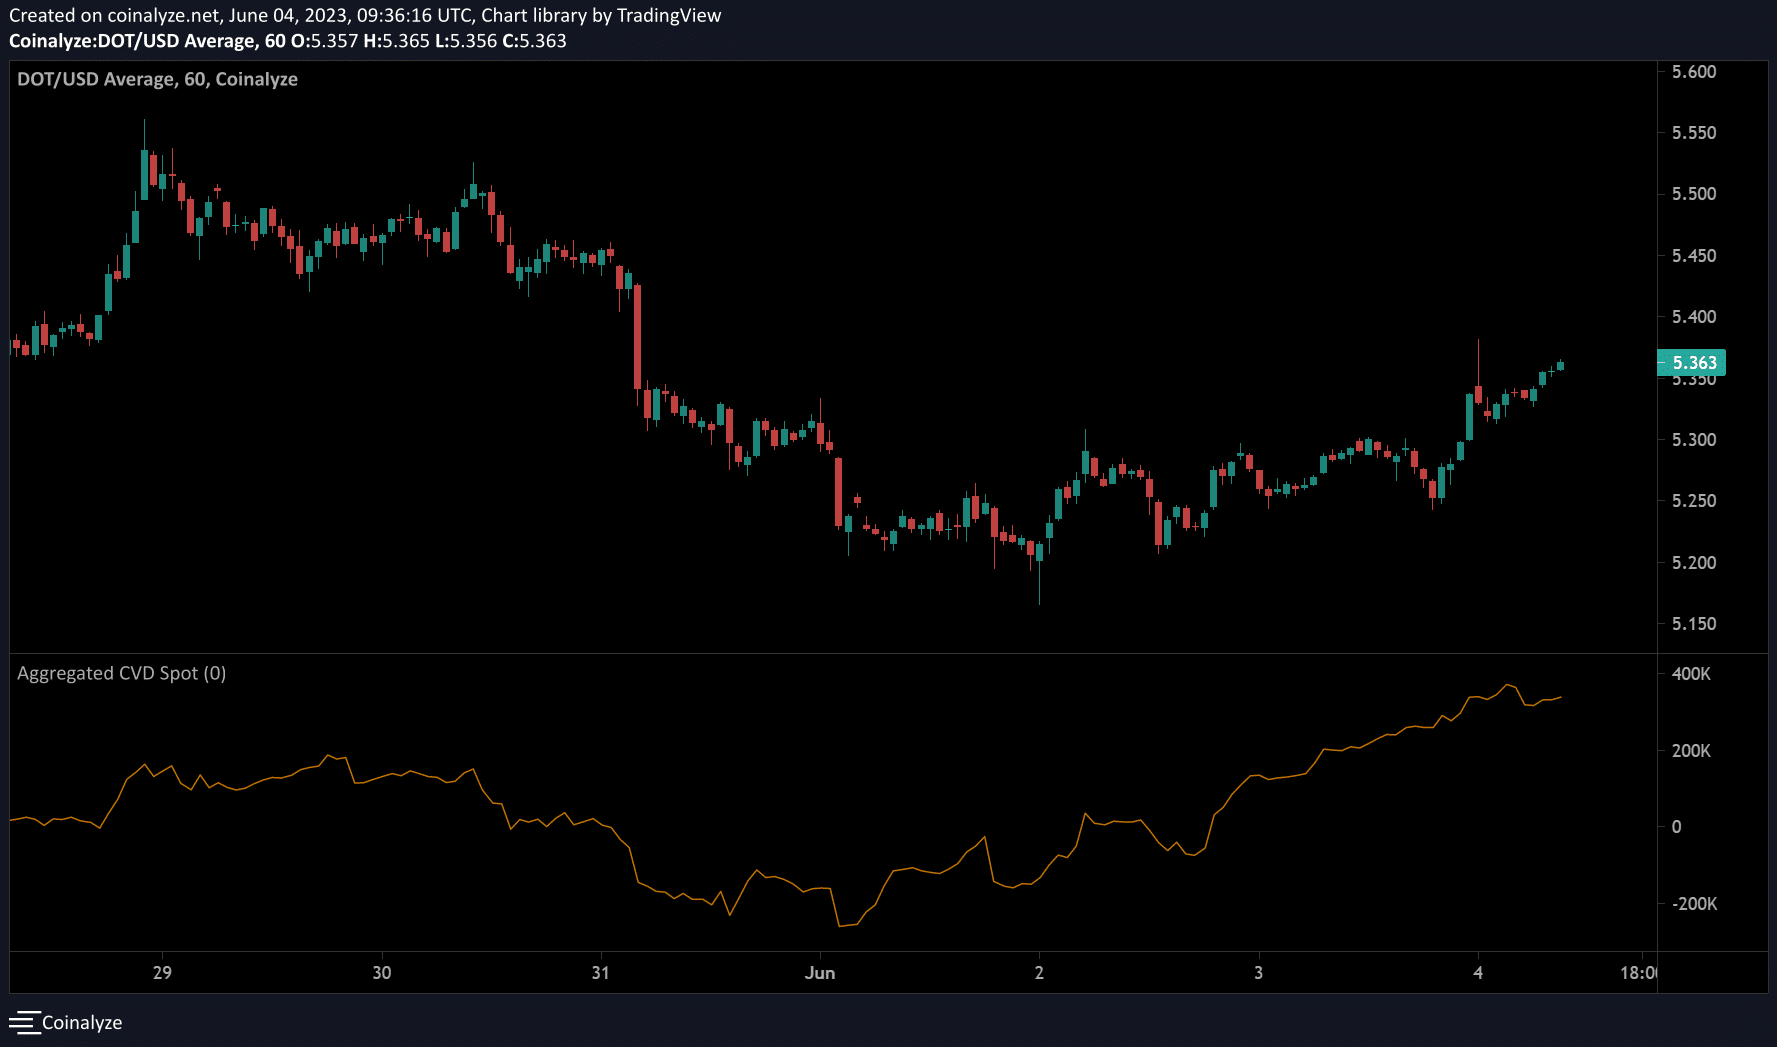
The CVD (Cumulative Volume Delta) spot, which tracks buying and selling volume, has steadily risen since the beginning of June. It highlights the rising buying pressure and buyers’ leverage. If Polkadot’s CVD spot rises further, it will signal a break above the mid-range of $5.35.
Traders should track BTC price action for more optimized trade setups.


