![Why Polygon's [MATIC] loss is Chainlink's gain, as LINK surges 10%](https://ambcrypto.com/wp-content/uploads/2024/05/LINK-Featured-Image-1200x686.webp)
- Chainlink and MATIC on-chain metrics were compared, and investors have a clear favorite.
- This could be an early sign of a better price performance in the coming months for one of them.
Chainlink [LINK] has gained just over 10% in the past week. Whales continued to accumulate the token, which was a positive sign for long-term investors.
Exchange flow was negative as well, as IntoTheBlock pointed out on X (formerly Twitter).
The oracle network token is closely rivaled by the Layer 2 scaling solution Polygon [MATIC] in terms of market capitalization. They stand at 16th and 18th on the list of the largest cryptos, respectively.
How do their on-chain metrics measure against one another?
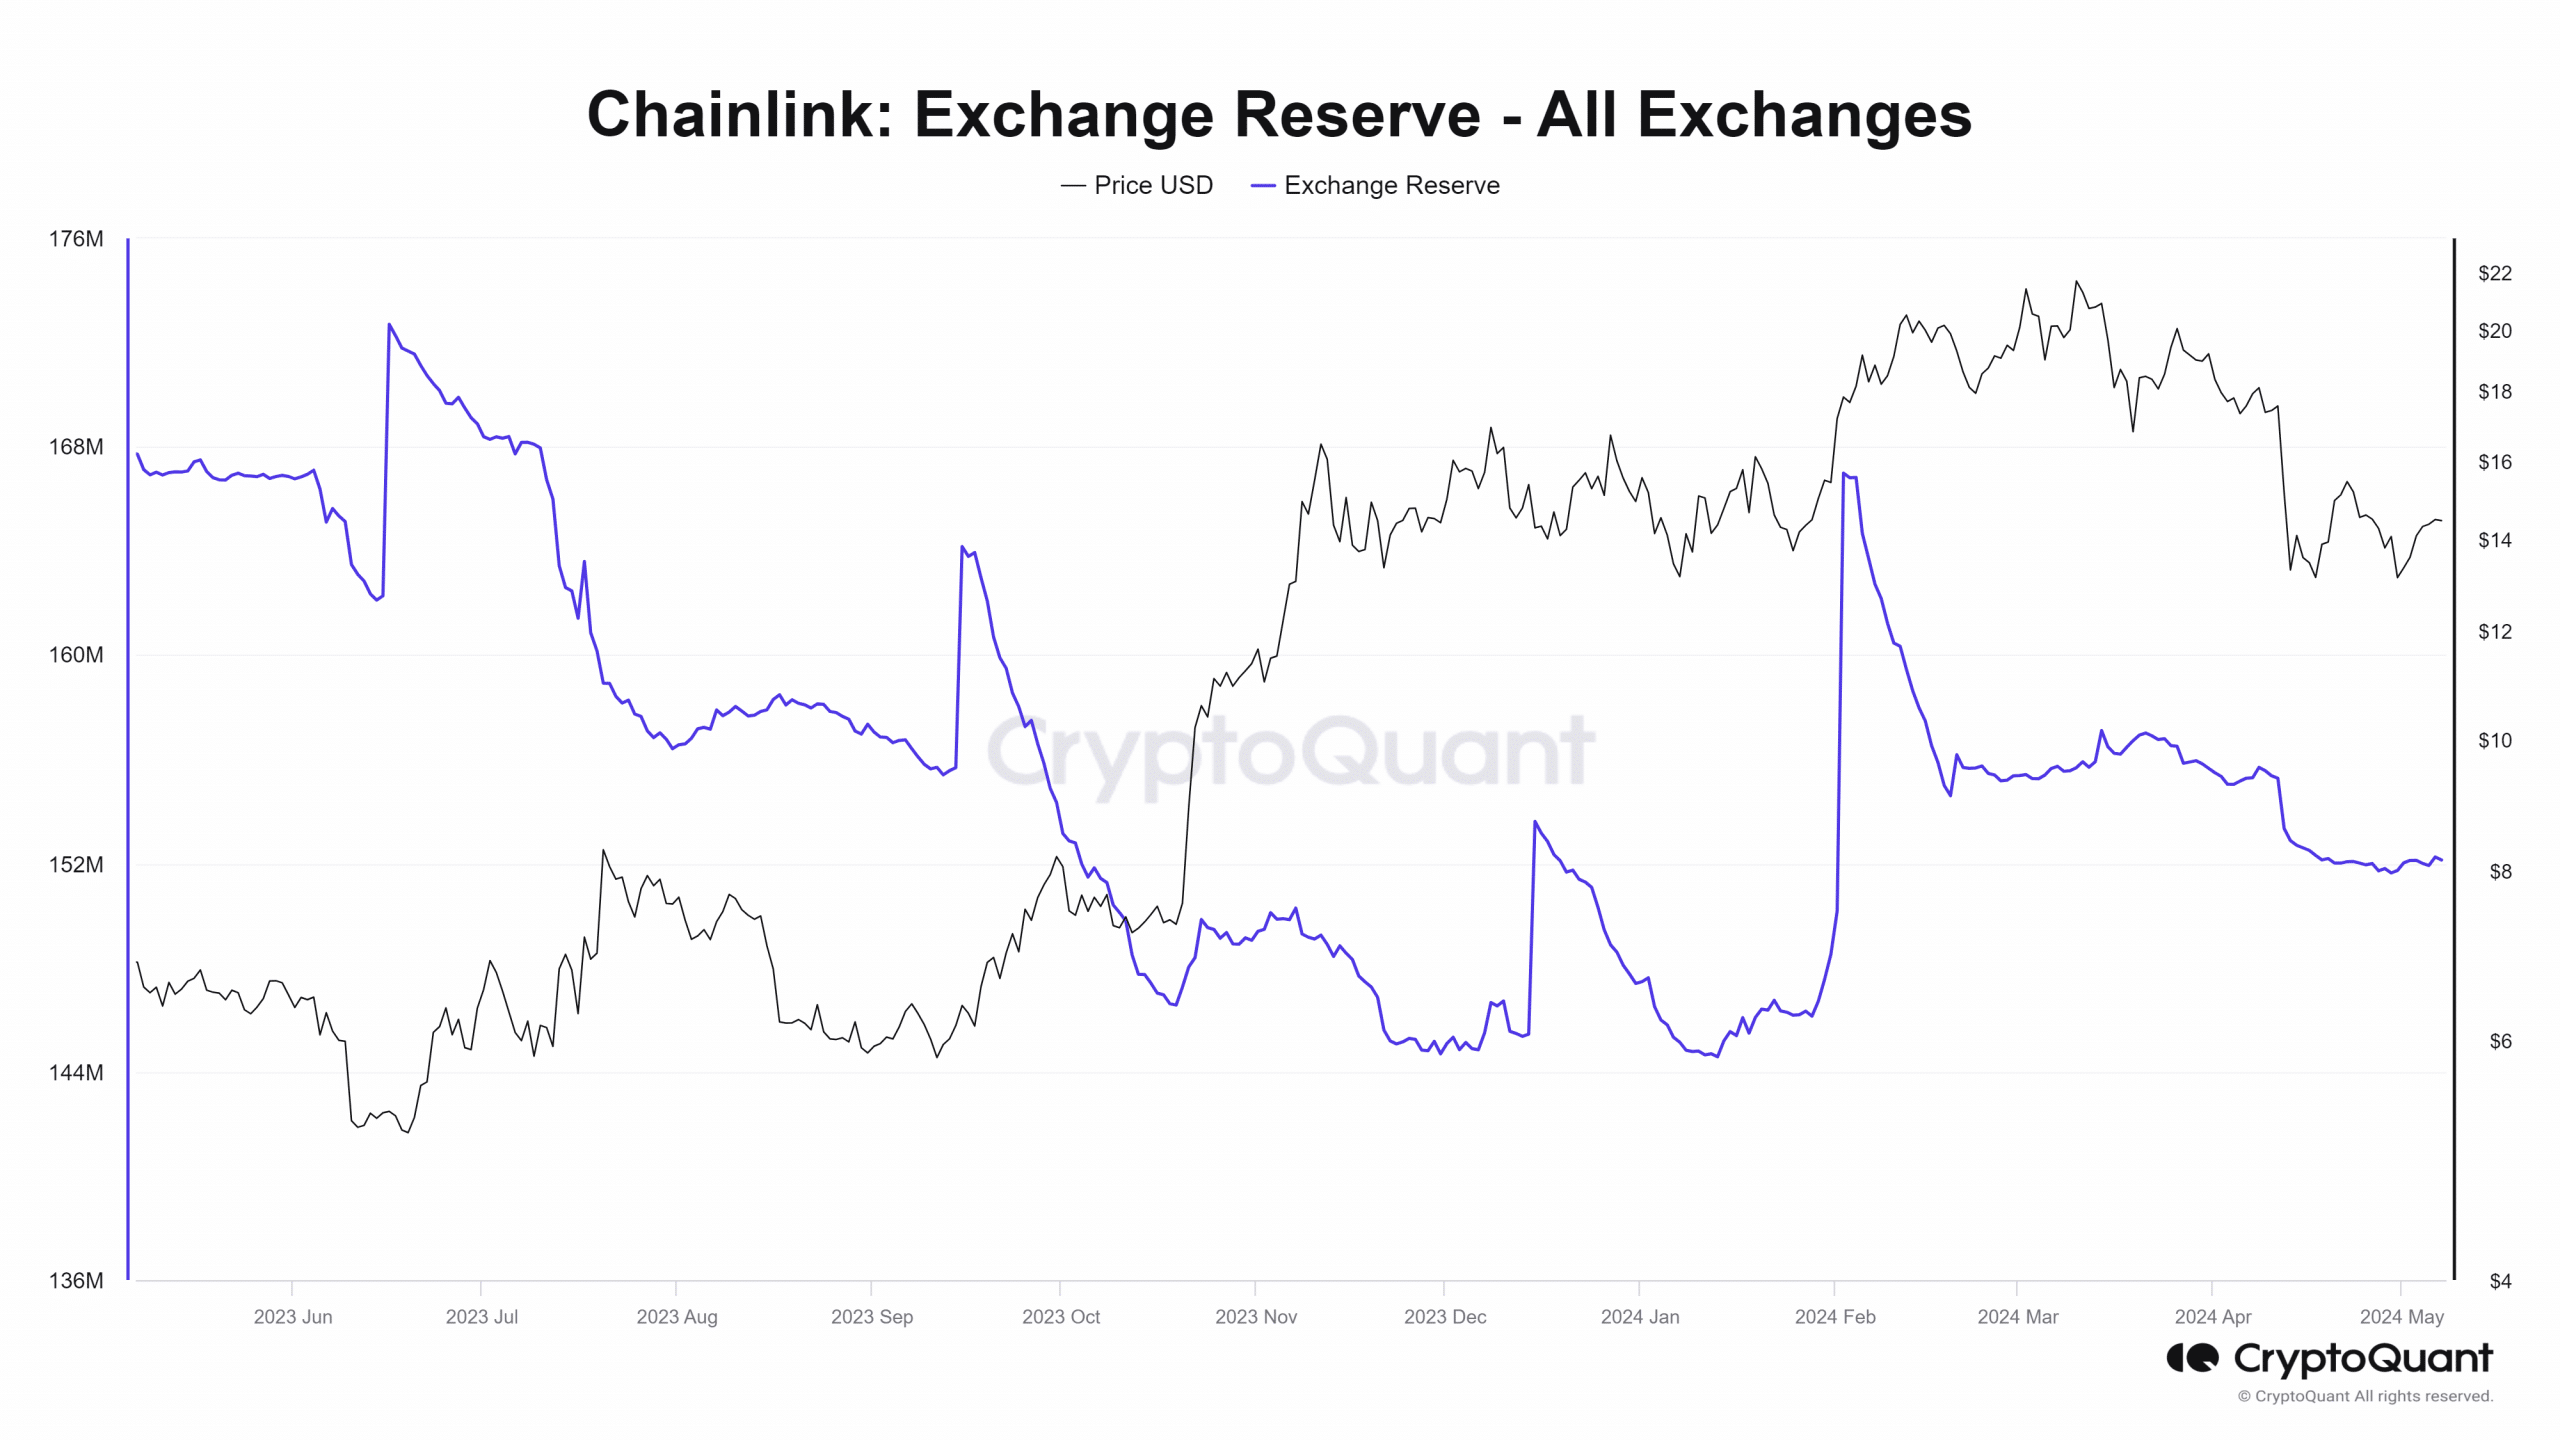
Source: CryptoQuant
The exchange reserve metric tracks how much of a token is on centralized exchanges. When the metric spikes higher, it indicates that a large amount of the tokens have entered exchanges, likely for selling.
Conversely, tokens moving off exchanges indicates accumulation was underway. The Chainlink exchange reserve chart above noted that a downtrend in the metric has been present since mid-February.
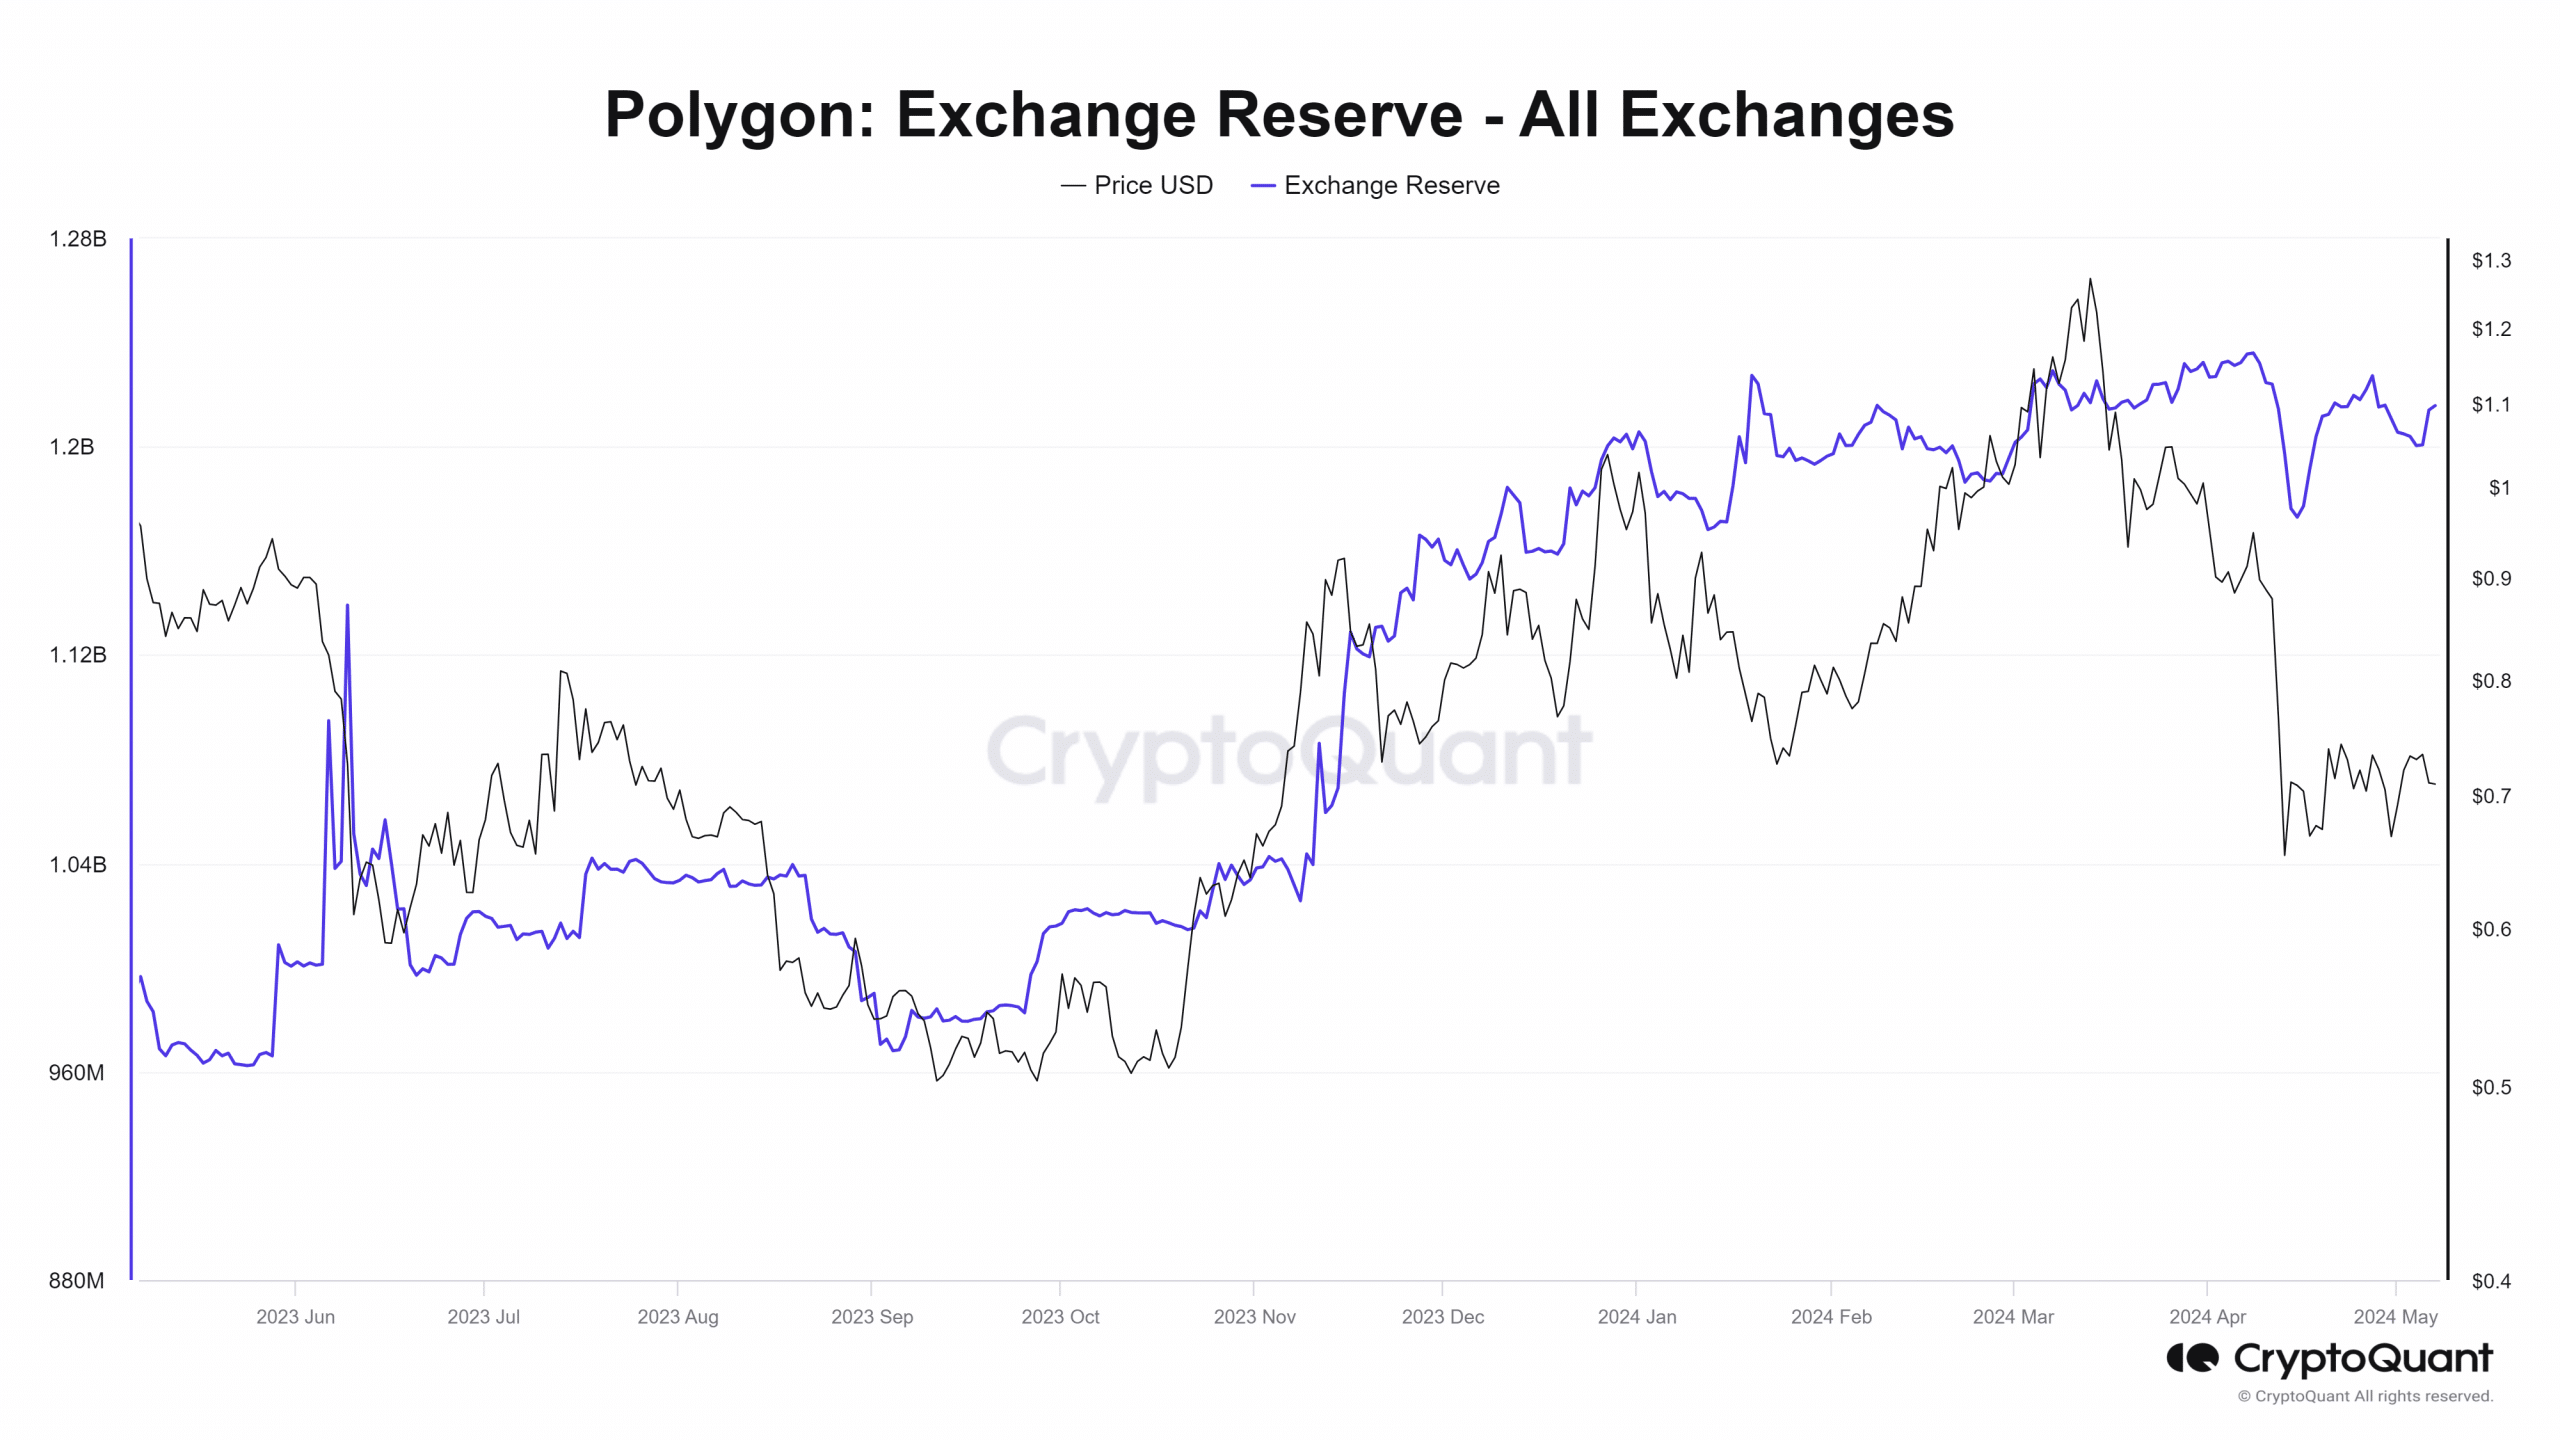
Source: CryptoQuant
On the other hand, MATIC has slowly trended higher since mid-February. It tumbled downward from the 11th to the 14th of April, but quickly pushed higher.
This showed that, overall, holders might lack faith in the token and are steadily selling.
This metric is just one factor amongst many that deals with market-wide sentiment and the accumulation or distribution of an asset.
Hence, its findings can not be taken by themselves to draw conclusions about the next price trends.
Sentiment comparison also hands LINK the advantage
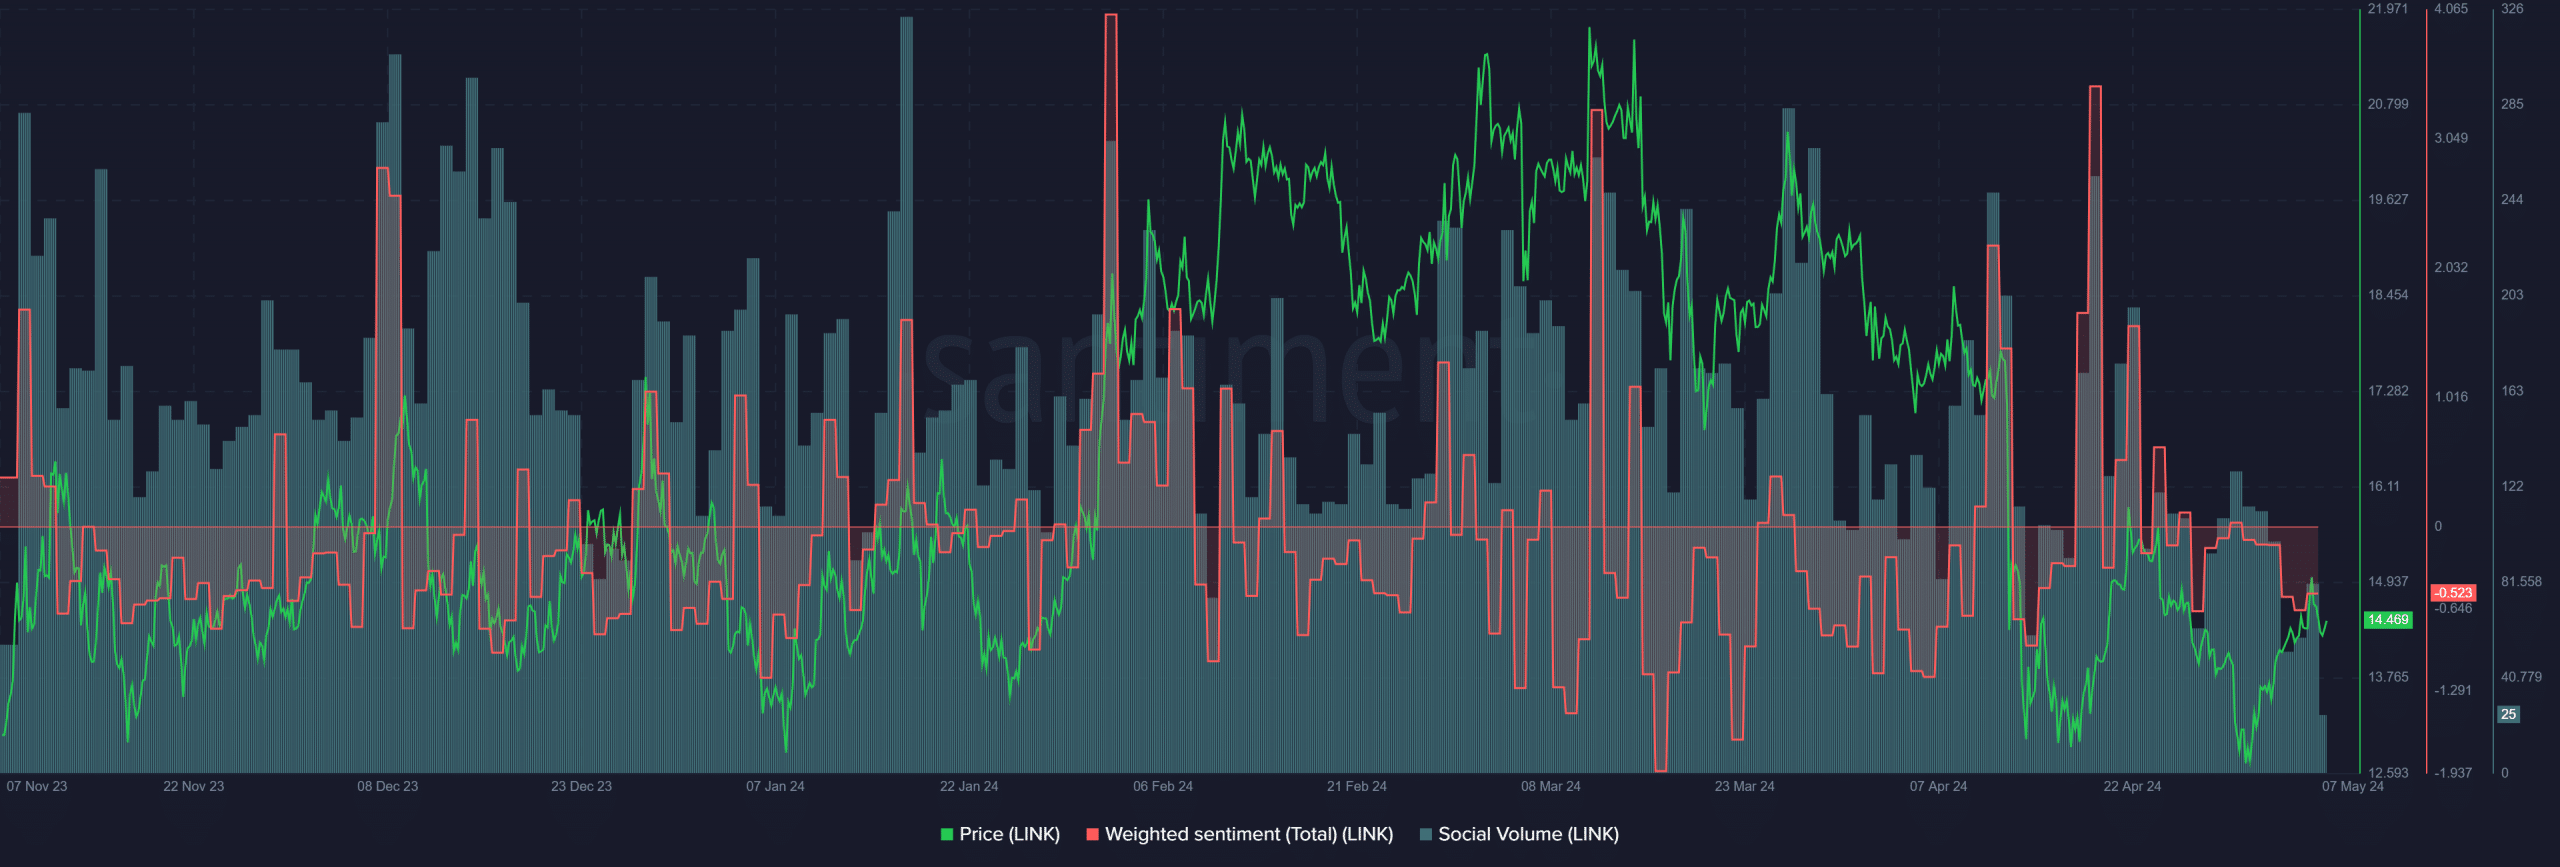
Source: Santiment
AMBCrypto analyzed data from Santiment to see if LINK and MATIC had positive market participant sentiment. The Weighted Sentiment of LINK was negative, and has been that way for the past ten days.
The rally from $13.2 to $15.6 in the latter half of April saw the social engagement jump skyward. It outmatched the March highs and nearly set new highs for 2024 on the 19th of April.
However, the Social Volume has been trending lower over the past six weeks.
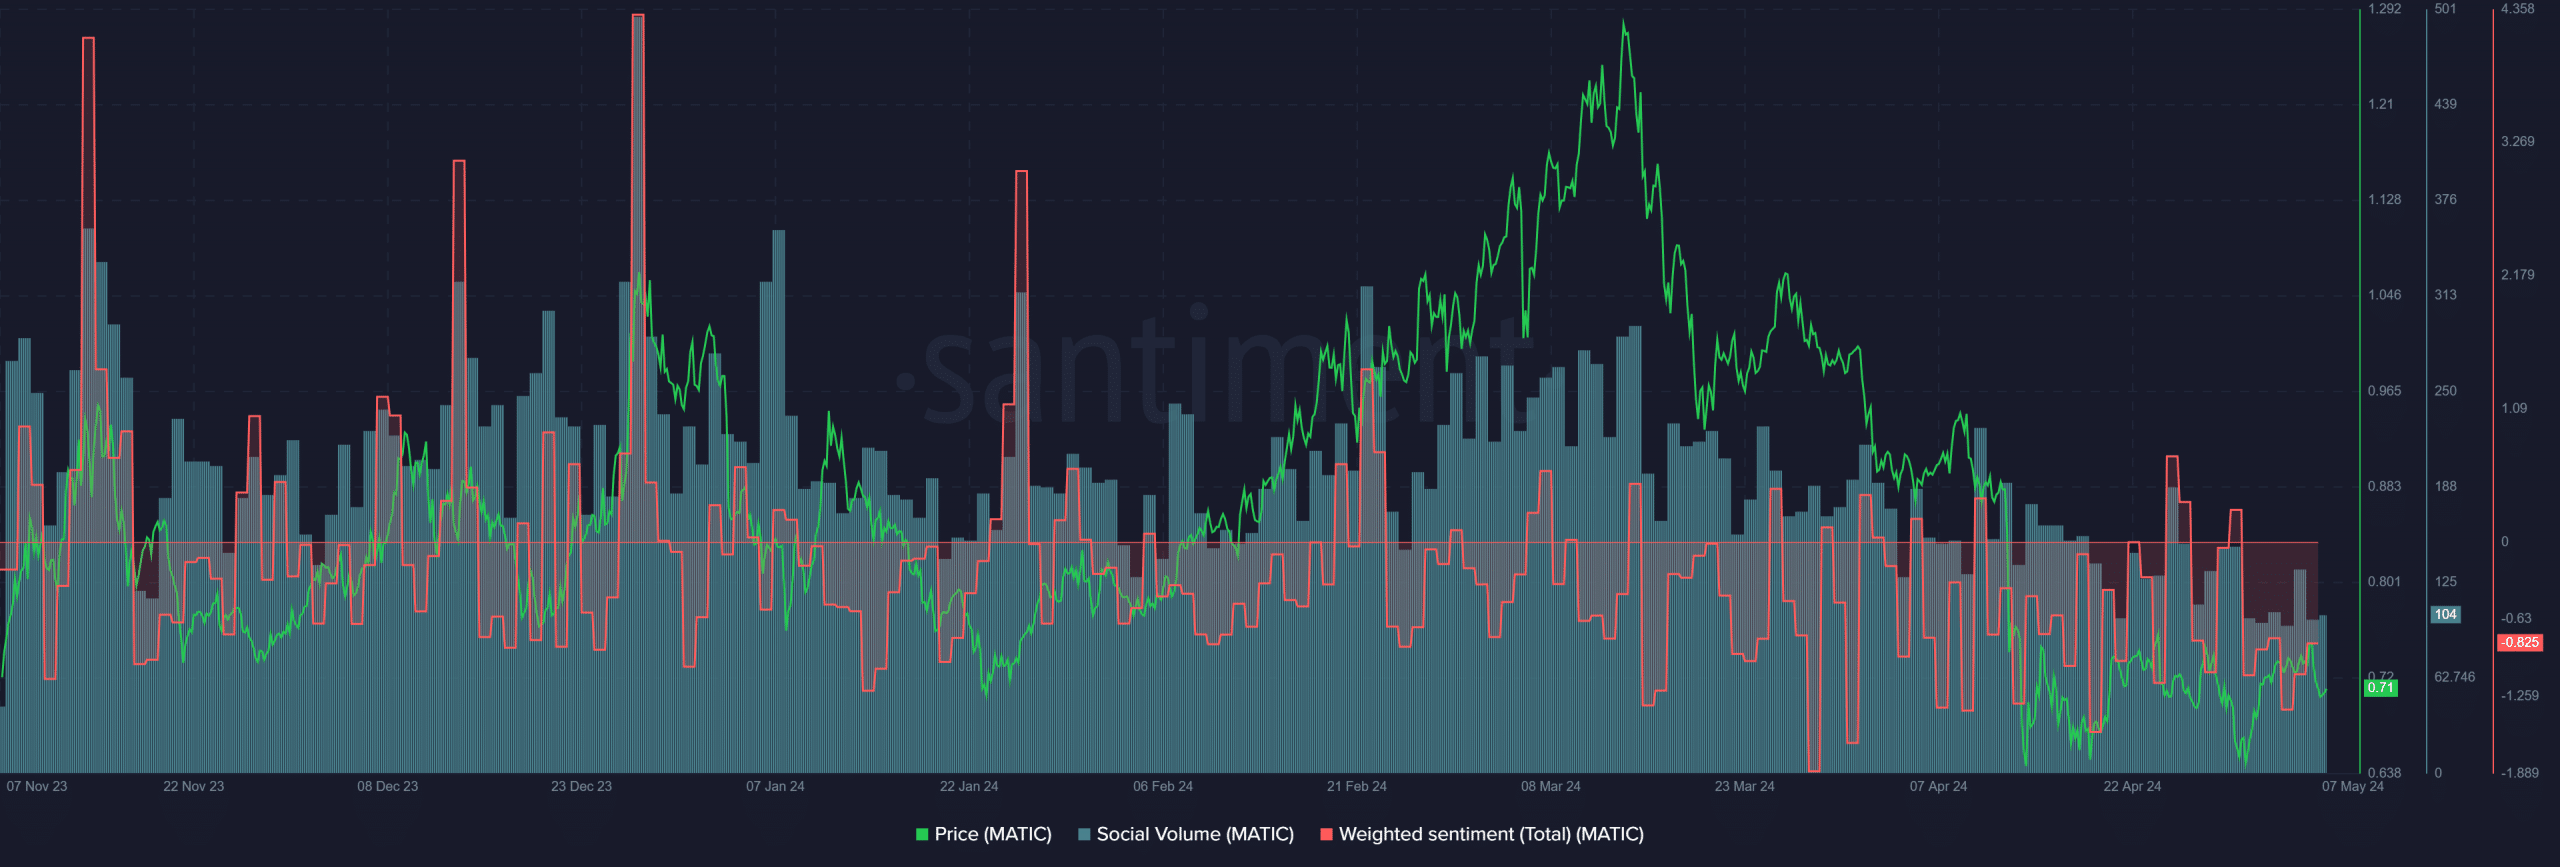
Source: Santiment
Realistic or not, here’s LINK’s market cap in BTC’s terms
It was a similar story in terms of volume for MATIC. Here, too, the social volume has been in decline since the second week of March. However, the difference was that the weighted sentiment was primarily negative.
It only had a handful of days above zero, and even then the sentiment was weak. The accumulation and social media trends indicate that LINK prices would likely perform better than MATIC in the coming weeks.