- Solana’s TVL shot up, reflecting growth in the DeFi ecosystem.
- SOL was only up by 1% last month, and market indicators remained bearish.
Solana [SOL] had an optimistic month in terms of network activity, as it gained a substantial number of users.
However, the same couldn’t be said for the token’s price action., which remained under bears’ influence during this period.
Solana’s network activity is rising
Artemis recently posted a tweet revealing the top blockchains by the largest daily active users in the last month.
Solana did not make it to the top three, which was dominated by Fantom [FTM], Optimism [OP], and Base. However, it boasted a promising 21% month-on-month increase.
Biggest Gainers of Daily Active Users Month Over Month:
1. Fantom
2. Optimism
3. Base
4. Gnosis Chain
5. Solana
6. Polygon zkEVM
7. Bitcoin
8. Near Protocol
9. Aptos
10. Zora NetworkAre you surprised by any of these numbers? pic.twitter.com/F07XjNxcPL
— Artemis (@artemis__xyz) February 5, 2024
To see how other related metrics were last month, AMBCrypto took a closer look at Artemis’ data. As rightly highlighted in the tweet, Solana’s Daily Active Addresses did rise in the last 30 days.
As a result, the blockchain’s Daily Transactions remained high during the same period.
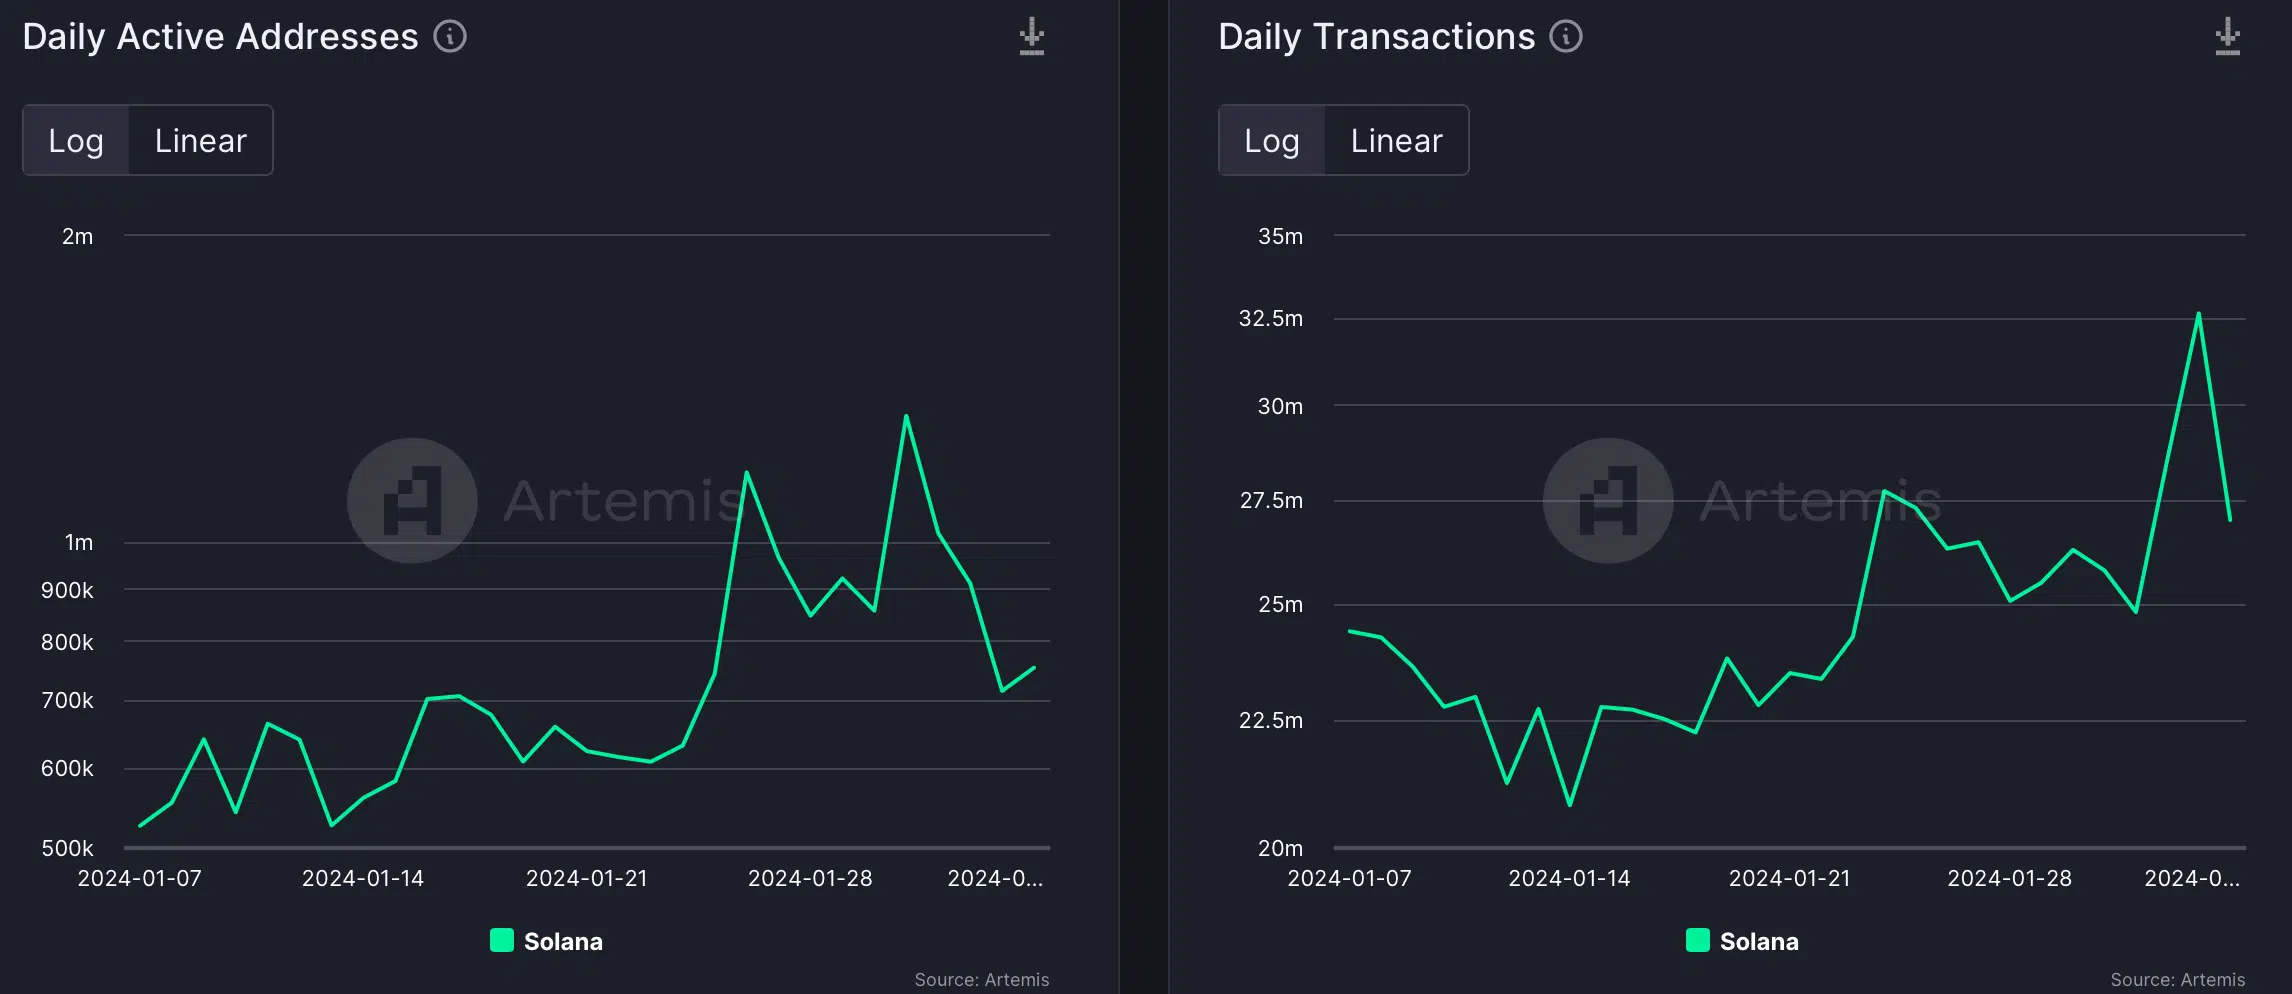
Source: Artemis
Things in terms of captured value also looked optimistic, as suggested by the hike in metrics. For example, booth Solana’s fees and revenue remained high last month, with massive spikes on the 31st of January.
The blockchain’s performance in the DeFi space also improved, which was evident from the substantial rise in its Total Value Locked (TVL). At press time, SOL’s TVL stood at $1.66 billion.
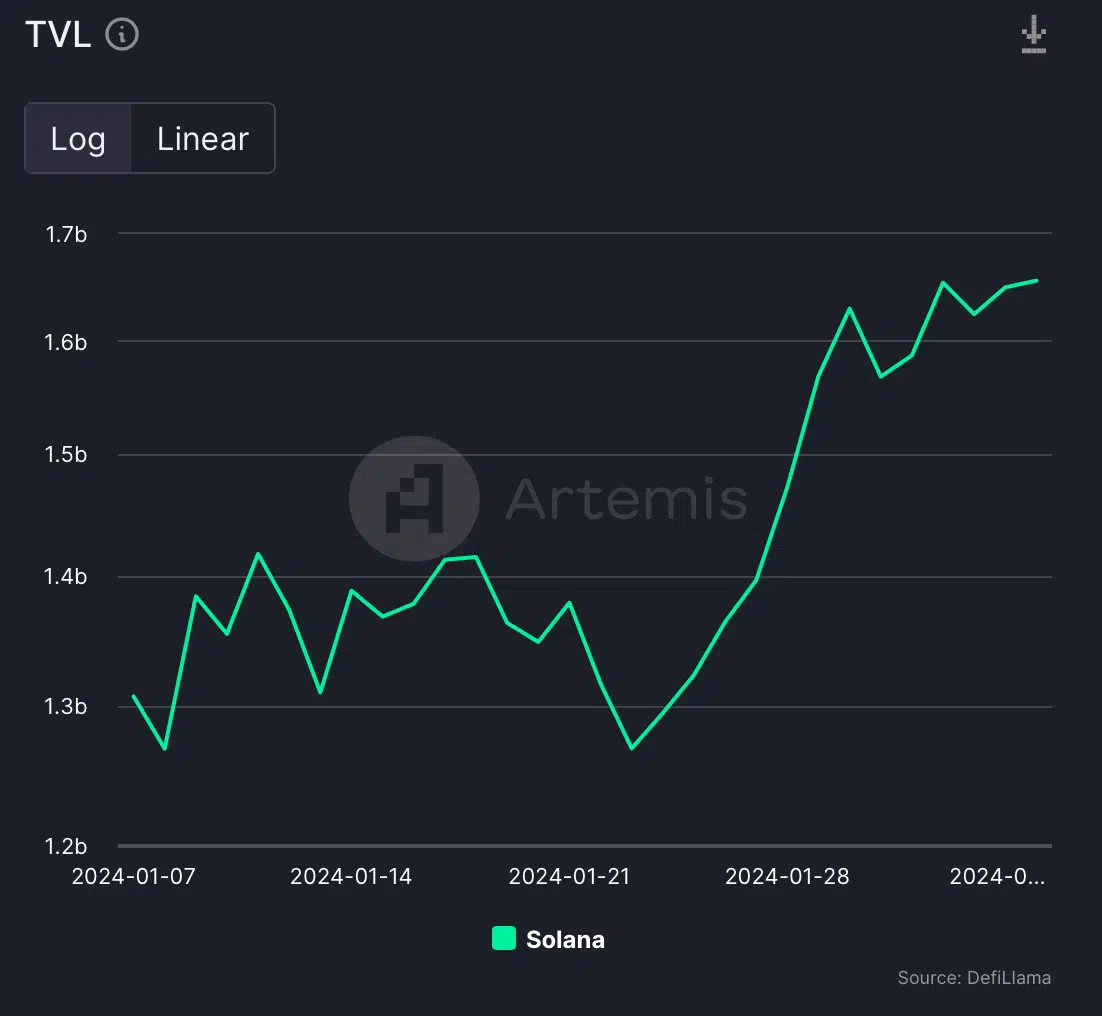
Source: Artemis
Solana investors are not thrilled
Though the blockchain’s network activity was soaring, its native token’s price action did not correspond well.
According to CoinMarketCap, SOL’s price moved sideways in the last month, as prices increased by just over 1%. At the time of writing, SOL was trading at $96.06 with a market capitalization of over $41.9 billion.
To see what went wrong, AMBCrypto checked SOL’s on-chain metrics. We found that SOL’s Weighted Sentiment remained on the negative side for the majority of the days last month.
This indicated that bearish sentiment around Solana was dominant in the market at press time.
Its Binance Funding Rate also remained in the green, meaning that derivatives investors were actively buying SOL as its price volatility remained low.
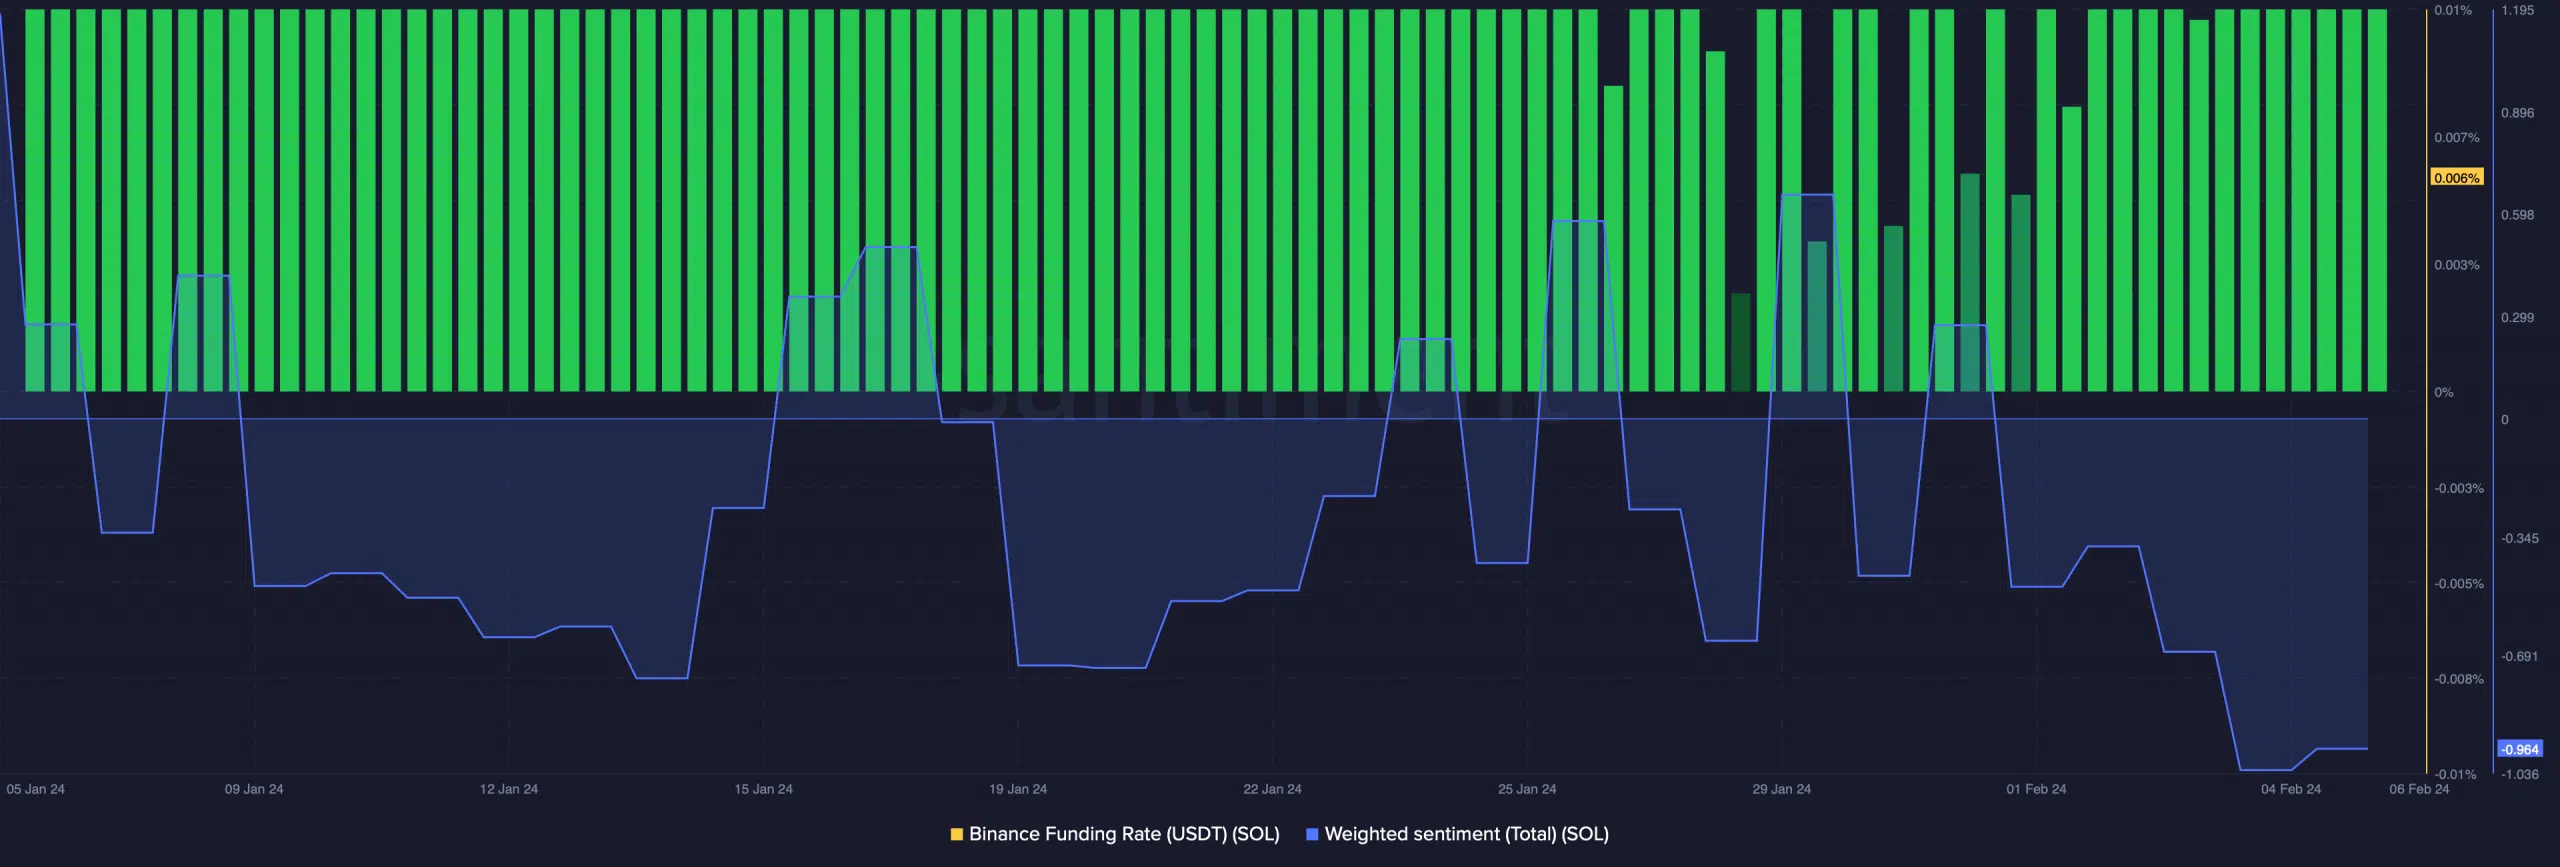
Source: Santiment
Another possible reason for SOL’s sluggish price movement could be the result of whales’ actions.
AMBCrypto had reported earlier how whales transferred SOL to an exchange in quick succession, signifying selling pressure.
Is your portfolio green? Check out the SOL Profit Calculator
Upon a look at Solana’s daily chart, the possibility of a few more slow-moving days seemed likely. Its Bollinger Bands revealed that SOL’s price was in a less volatile zone.
The MACD also displayed the possibility of a bearish crossover. Nonetheless, SOL’s Money Flow Index (MFI) turned bullish as it registered a sharp uptick.
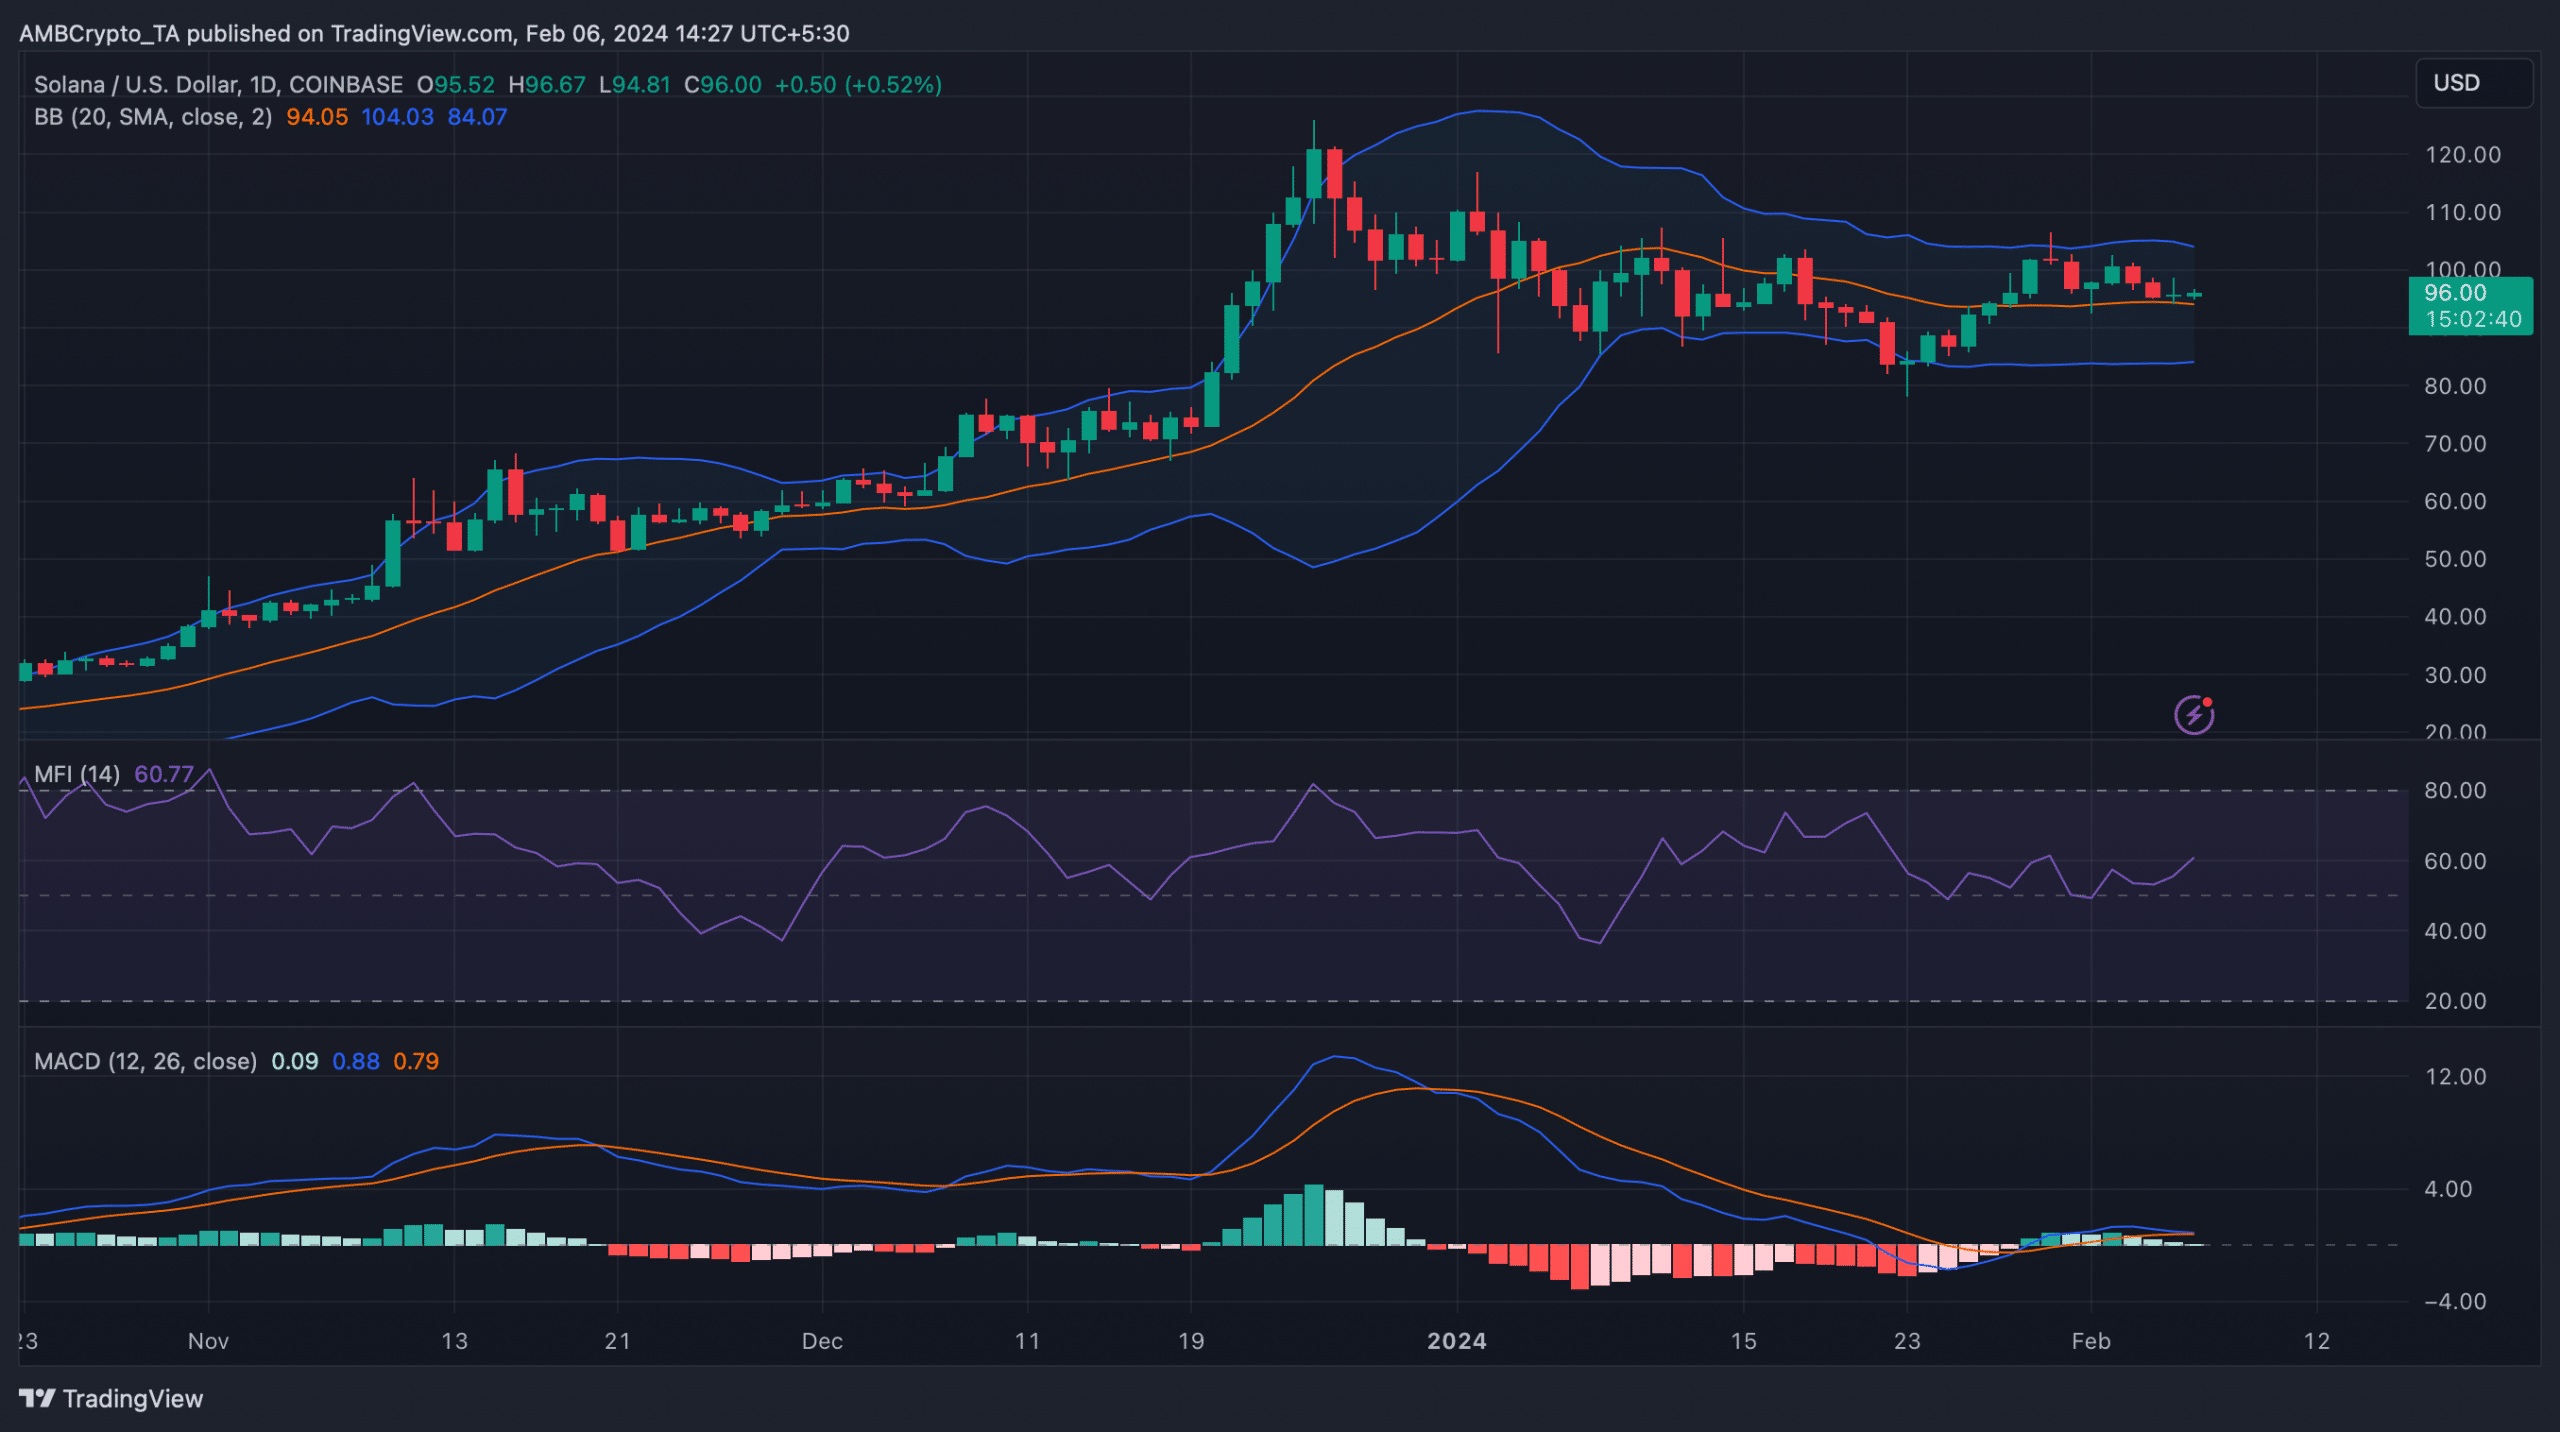
Source: TradingView