
- SOL price has increased by 6% over the last 7 days but is down 17% since the start of the month.
- Indicators flashing mixed signals have resulted in indecisiveness among SOL market speculators.
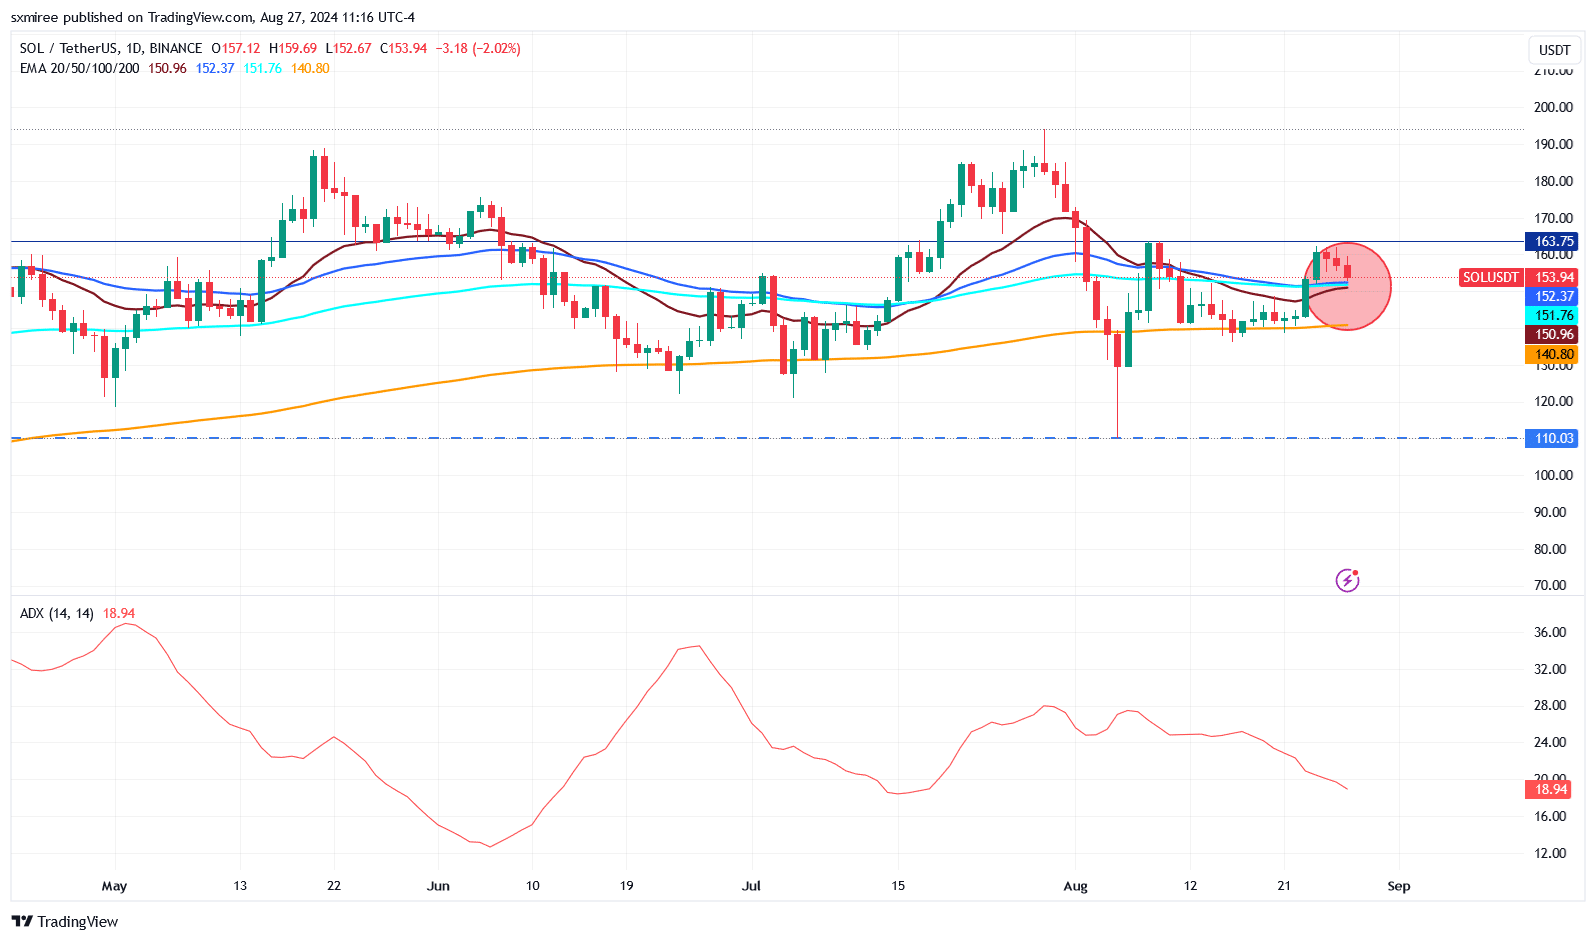
Solana [SOL] price action over the weekend and this week has been characterized by a thwarted uptrend. TradingView data shows SOL/USDT’s 20-, 50-, and 100-day exponential moving averages (EMAs) have come into tight convergence.
This indicated that the difference in momentum across various timeframes has diminished.
Lack a clear trend direction as momentum rebuilds
The Average Directional Index (ADX), used to quantify the strength of a trend in a market, has dropped to low levels on the SOL daily chart implying that the market no longer has a strong directional bias.
A low ADX typically correlates with reduced market volatility and, in Solana’s case, may be an indication that the uptrend has waned and the market is transitioning from a trending phase to consolidation or range-bound activity.
Source: TradingView
TradingView data showed that the ADX for SOL/USDT has consistently dropped from 26 on 6th August to 19 at the time of writing.
This reading is strikingly below the 20-mark threshold. It suggests Solana may be limited to less dramatic price movements in the near term.
Momentum indicators point to uptrend continuation in the near term
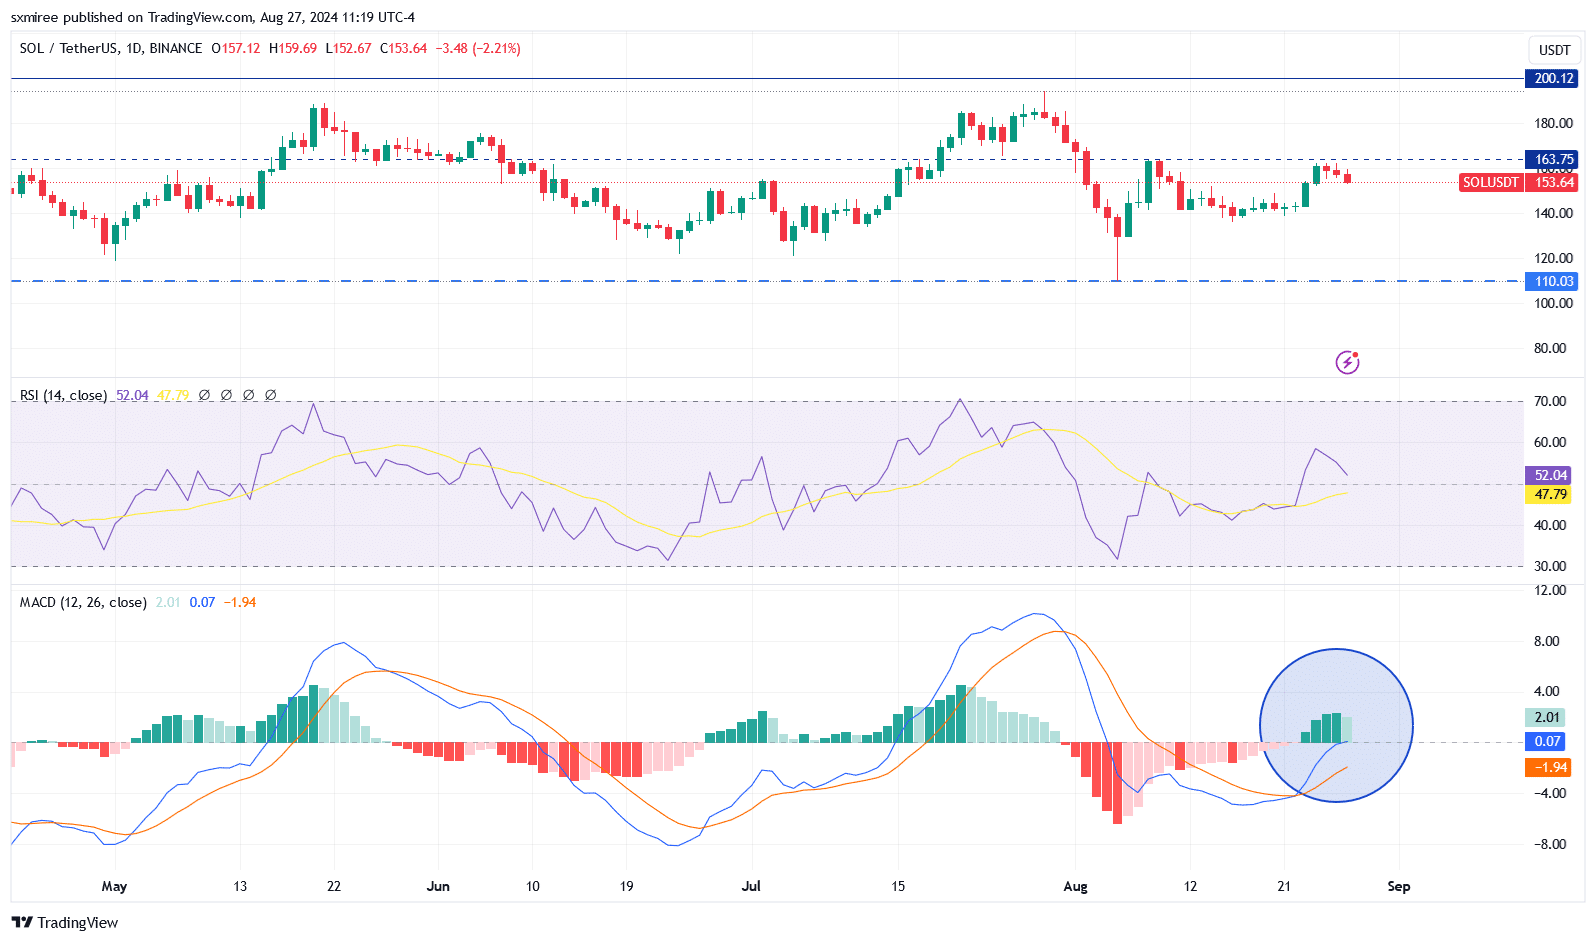
In a low ADX environment, range-bound or mean-reversion strategies become more relevant. On the daily chart, SOL/USDT has printed successive positive Moving Average Convergence Divergence (MACD) histograms for the past five days.
Source: TradingView
In addition to the positive histograms, the MACD line has recently crossed into positive territory though the signal line remains in negative territory.
The MACD overall picture suggests that bullish momentum has been reasserting itself steadily. But the longer-term trend is still catching up.
Source: TradingView
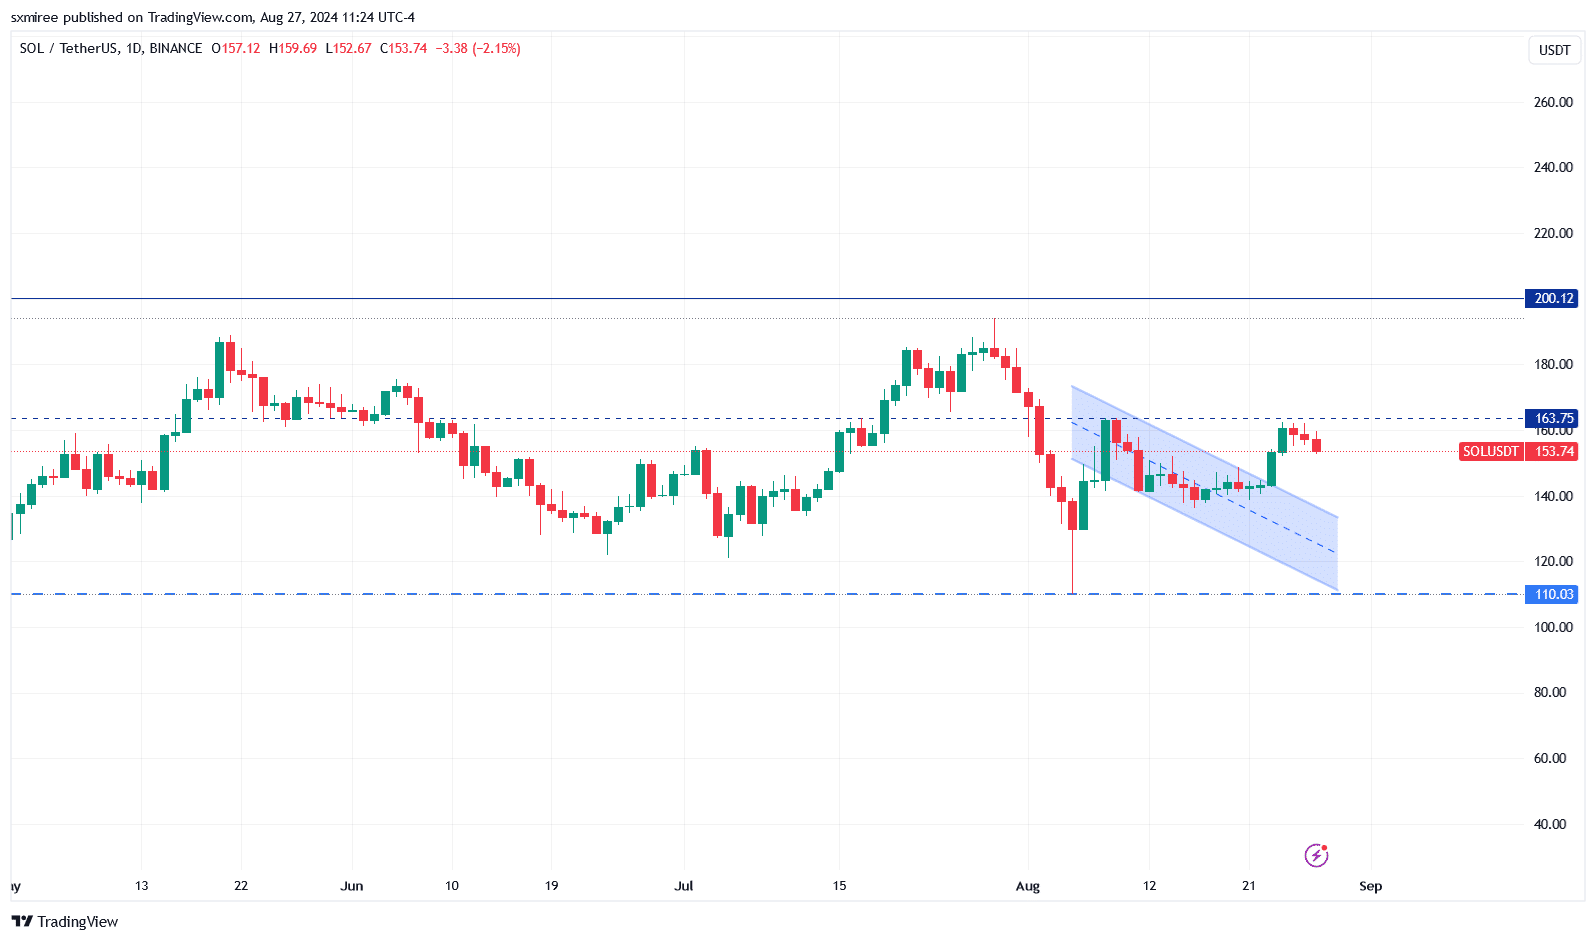
Zooming in, SOL/USDT has broken out of a descending channel. This signaled the end of a correction trend that persisted over recent weeks and the onset of a upward trend.
This breakout is confirmed by increasing buying pressure in the form of candles outside the upper channel bounds.
Read Solana’s [SOL] Price Prediction 2024–2025
On-chain metrics indicate a slowdown in network usage
At the network level, Solana’s total transaction fees currently hover near the lowest levels seen early May.
This decline in daily transaction fees suggests reduced activity on the network resulting from fizzling enthusiasm around Solana-based meme coins like Dogwifhat, Popcat and Bonk, whose popularity has been influential to SOL’s recent success in the spot market.