Why the Asian session holds the key to Bitcoin’s price drop

Bitcoin’s price seemed to have recuperated as it bounced off the yearly open at $28,956. However, on-chain indicators are suggesting that this expansion was a fluke. In fact, buyers with no real volume or momentum are trying to push the price higher on the charts.
The first sign of resistance weakened these buyers’ already weak momentum, with the same contributing to a continuation of the downtrend. More of these sell-offs might be on their way due to two reasons,
- On-chain indicators
- The start of the Asian session
Bitcoin’s On-chain indicators
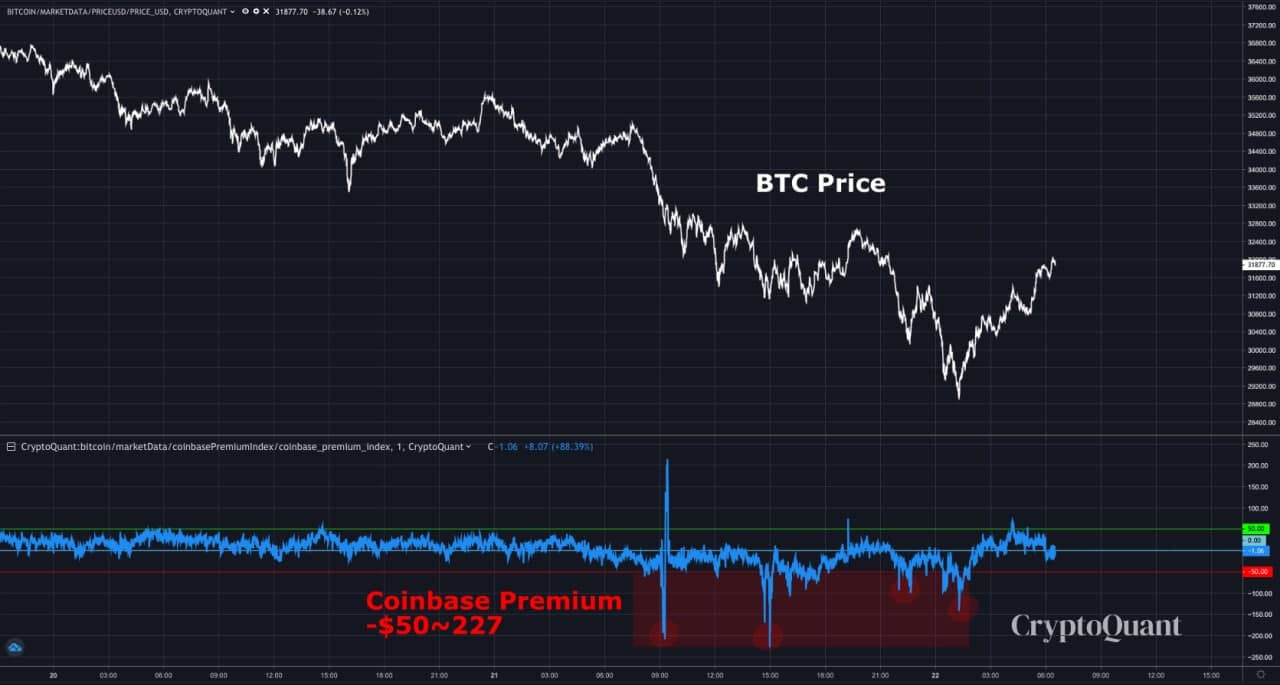
As mentioned in yesterday’s article, Bitcoin was due for a correction and retest of the yearly open. Now, on-chain indicators, more specifically, CryptoQuant’s Coinbase Premium indicator, is pointing to more drops for the market’s pioneer cryptocurrency.
“Coinbase premium” is an on-chain metric that is the ratio of Coinbase’s BTC/USD price and Binance’s BTC/USDT price. This ratio helps determine if BTC is trading at a premium or not.

Source: CryptoQuant
A high premium highlights high spot inflows and suggests that investors want to buy, thus, it is a bullish sign. At press time, despite bouncing off the yearly low, this premium hadn’t increased and was still in the negative, hinting that the sellers were still in control of the market and that the drop wasn’t done yet.
CryptoQuant CEO Ki Young Ju commented on this premium too, stating,
“Was always above +$50 when BTC was about to break 20k, 30k, and 40k, meaning there were huge spot inflows from high net-worth individuals and institutional investors in Coinbase.”
Bitcoin: Technical point of view

Source: BTCUSDT on TradingView
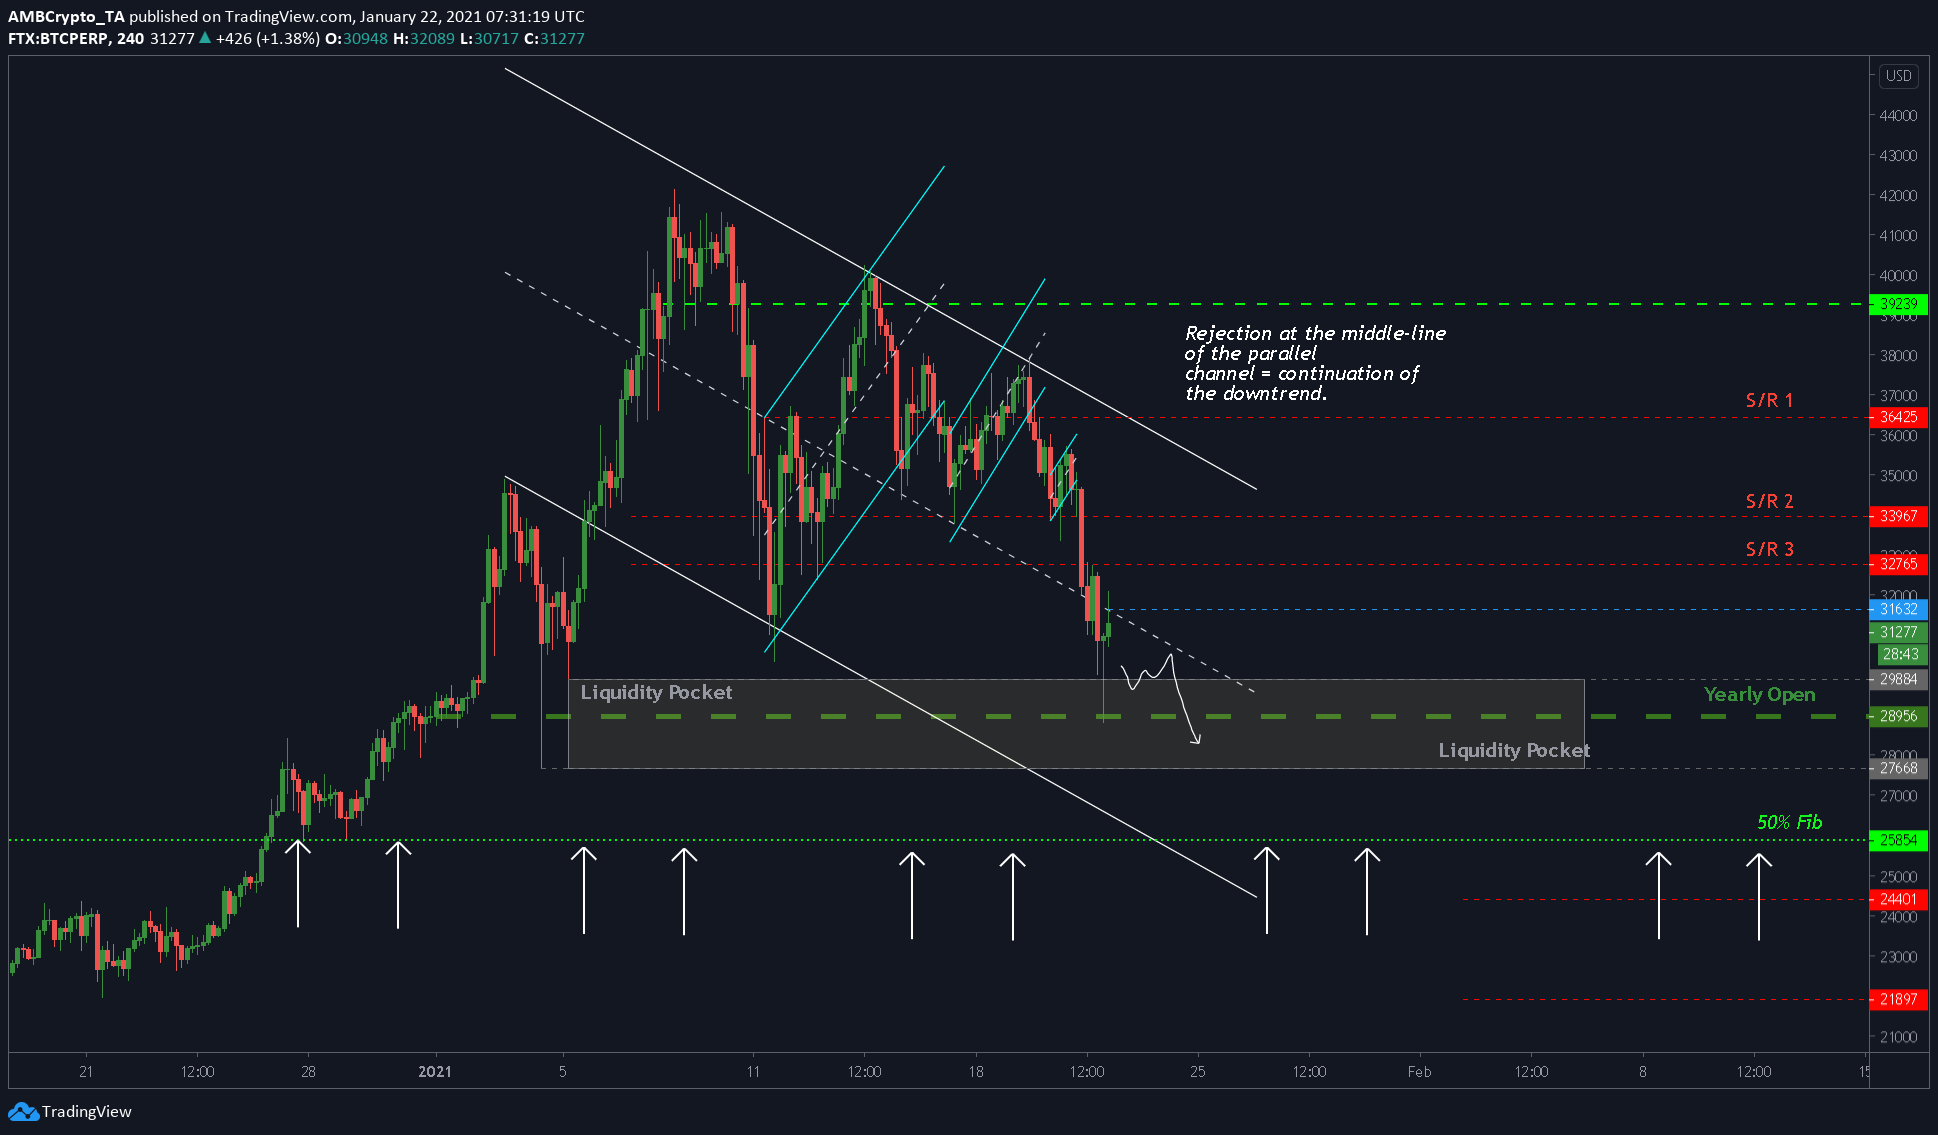
As mentioned above, the first sight of resistance was the middle-line of the parallel channel. A rejection here sets up the price for another tap of the yearly open at $28,956. This further supported the on-chain metric’s bearish view.
A bearish case will be the breach of the immediate support at $28,956, which would open up the price to drops to $20,000 in an extremely bearish scenario.
Other supports that can prevent the price from dropping to $20,000 include the liquidity pocket ranging from $29,800 to $27,600. Following this range is the 50% Fibonacci level at $25,850, a level that seems to be the major area of support and the next destination for Bitcoin’s drop.
The Asian session
Asian sessions ranging from 23:00 GMT to 8:00 GMT are when traders in the east start trading. Hence, high volatility is usually experienced during this time. Moreover, the Asian session is known for being extremely bearish and most drops occur during this session.
In light of the fact that yesterday’s drop came accompanied the U.S session, Bitcoin can be expected to drop more as the Asian session is in full swing, further supporting the bearish outlook on the charts.


