Why the ongoing bear market may be far better than you realize…

Cryptocurrencies have suffered from a brutal sell-off the past few months considering the Terra fiasco. But the last fortnight has been especially bad for investors as they lost a significant chunk of their savings. However, a bearish run is a part and parcel of this niche yet emerging asset class.
Thus given instances of the past, how severe is the ongoing bear market?
The grass is greener than you think
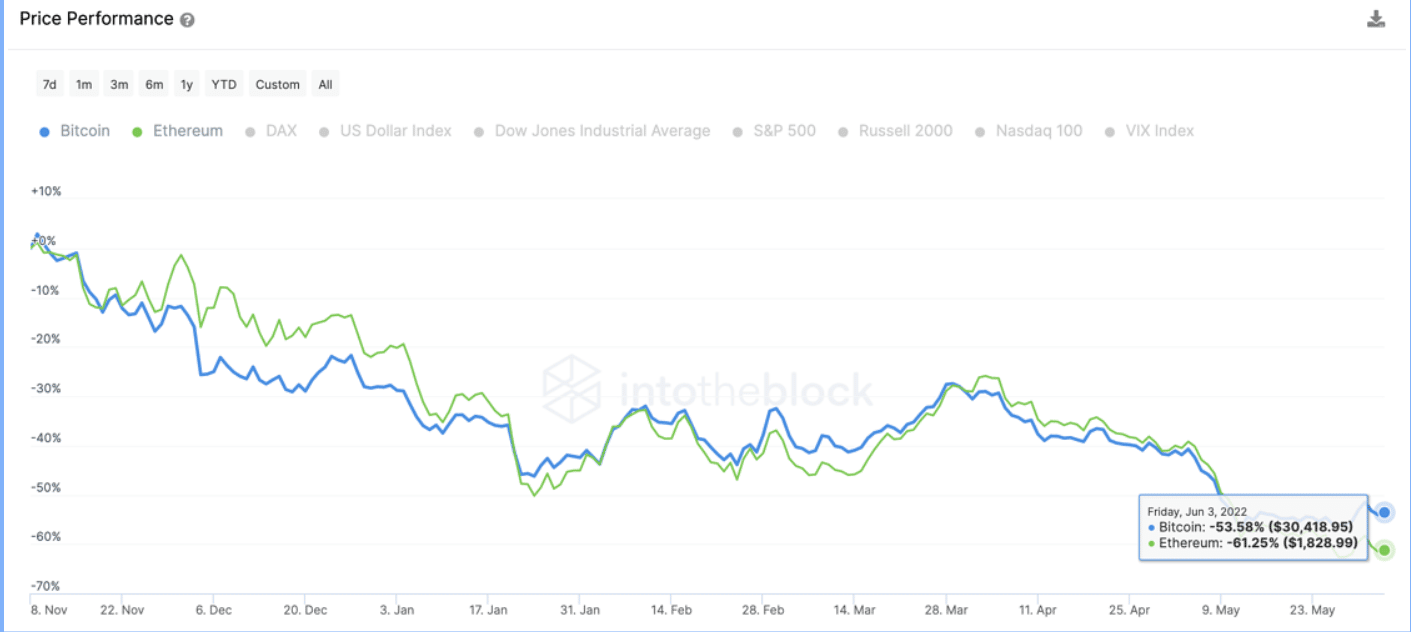
The ongoing correction period saw the crypto market drop by more than 60%, from a high of $3.07 trillion to $1.23 trillion at press time. The prices of Bitcoin [BTC] and Ethereum [ETH] are down by approximately 60% from their highs and many smaller assets have also dropped over 80%. On-chain activity for most assets has witnessed the same fate, leaving many investors in a state of concern.
That said, certain on-chain indicators suggest the crypto market’s current downtrend may not end up being as brutal as past bear markets. Lucas Outumuro, head of research at analytics firm IntoTheBlock, asserted this viewpoint in a blog post on 4 June. He also stated that looking at key indicators from a long-term perspective, this time may be different from other bear markets.
So what’s different, this time?
The crypto market has experienced severe downfalls since its inception where it had even deeper bear markets and emerged stronger a few years later.
“Crashes of 80%+ are a staple in crypto bear markets, but there are arguments to be made for less sharp losses in the future,” the blog added.
Consider a few fundamental indicators. Transaction fees for instance, here (2021-2022) it dropped less than in previous bear markets (2017-2018).
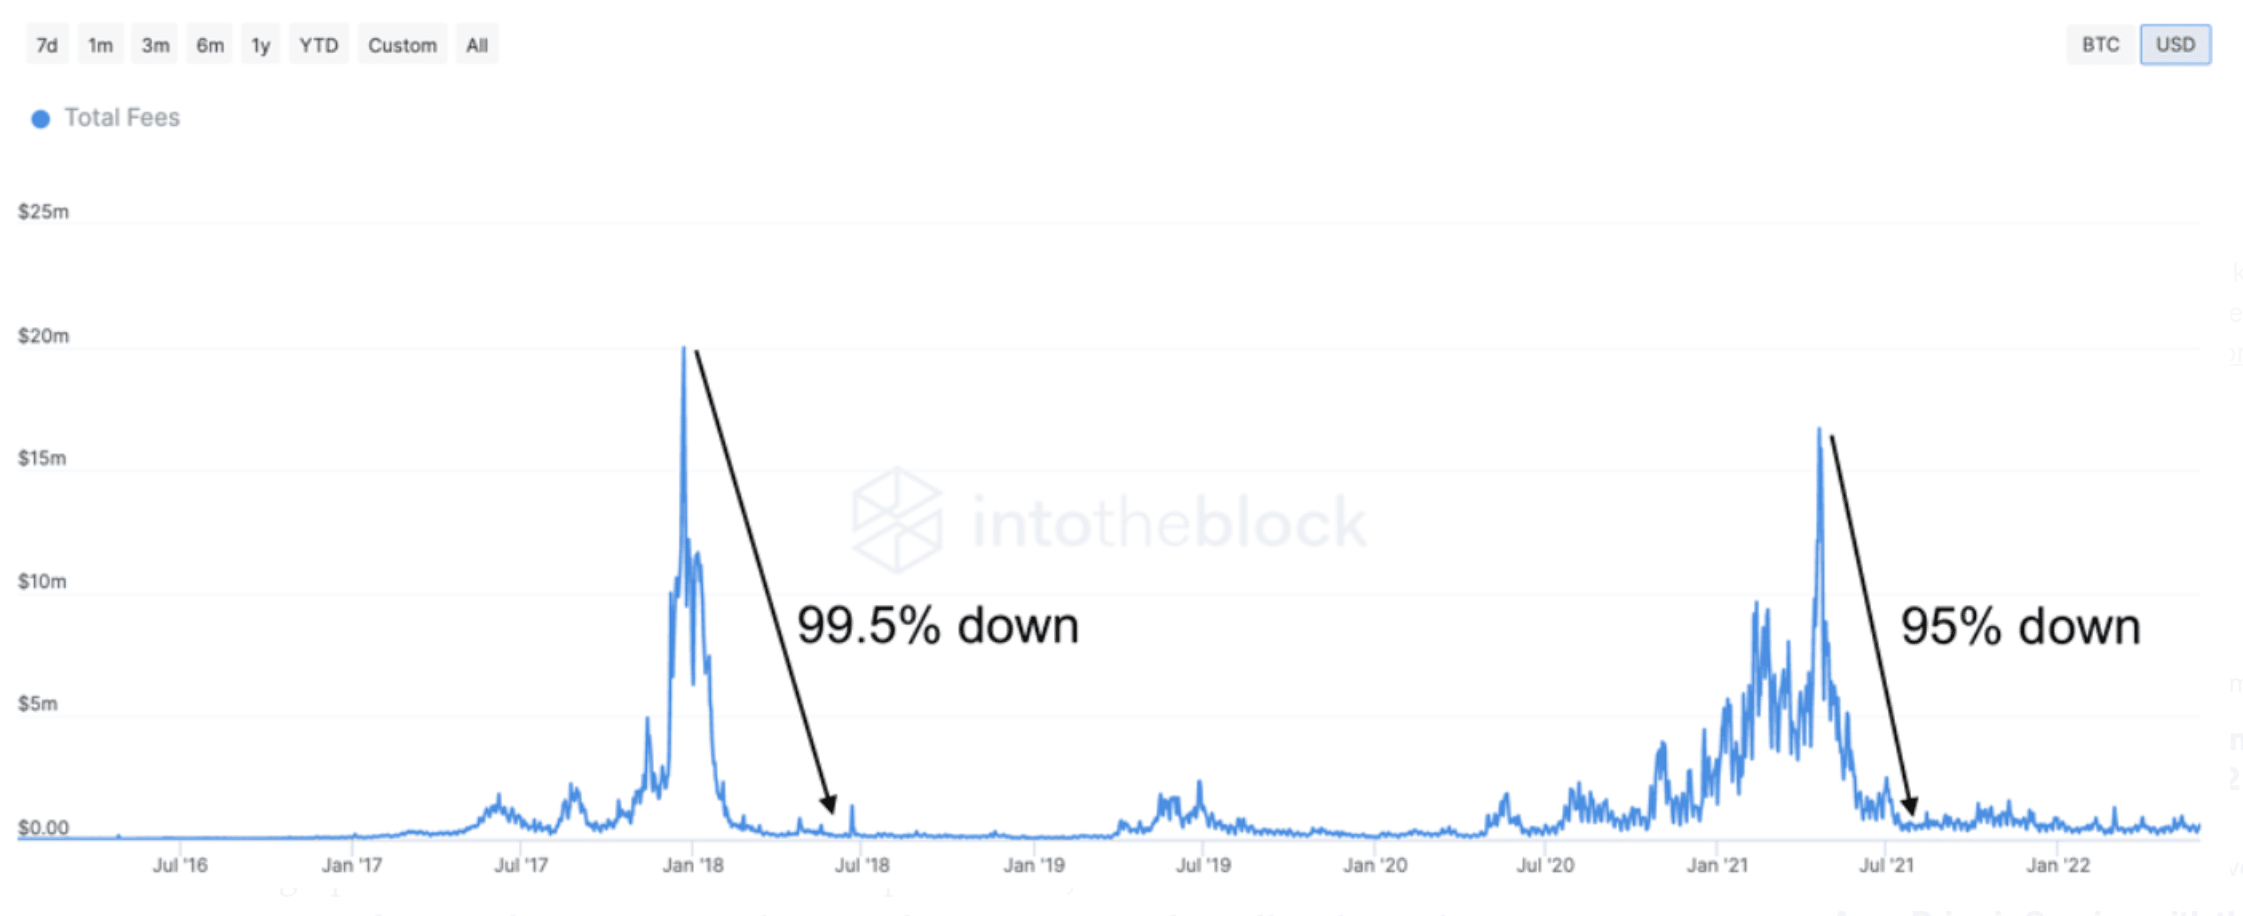
The blog stated:
“As a high portion of demand comes from speculation, it is normal for transaction fees to plummet severely as trading sentiment dwindles through bear markets.”
Bitcoin has been averaging above $500,000 in daily transaction [fees] in May 2022, as compared to $130,000 in May 2018. Ethereum and other crypto assets also mirror this same pattern. In fact, these assets had less pronounced drops in their on-chain activity upon comparing them to the previous bear markets.
Moving on to another indicator, Bitcoin and Ethereum both show consistent progress in their development activity regardless of the ongoing price action. Commits to the Bitcoin network grew by over 50% in the past two years as shown in the graph below.
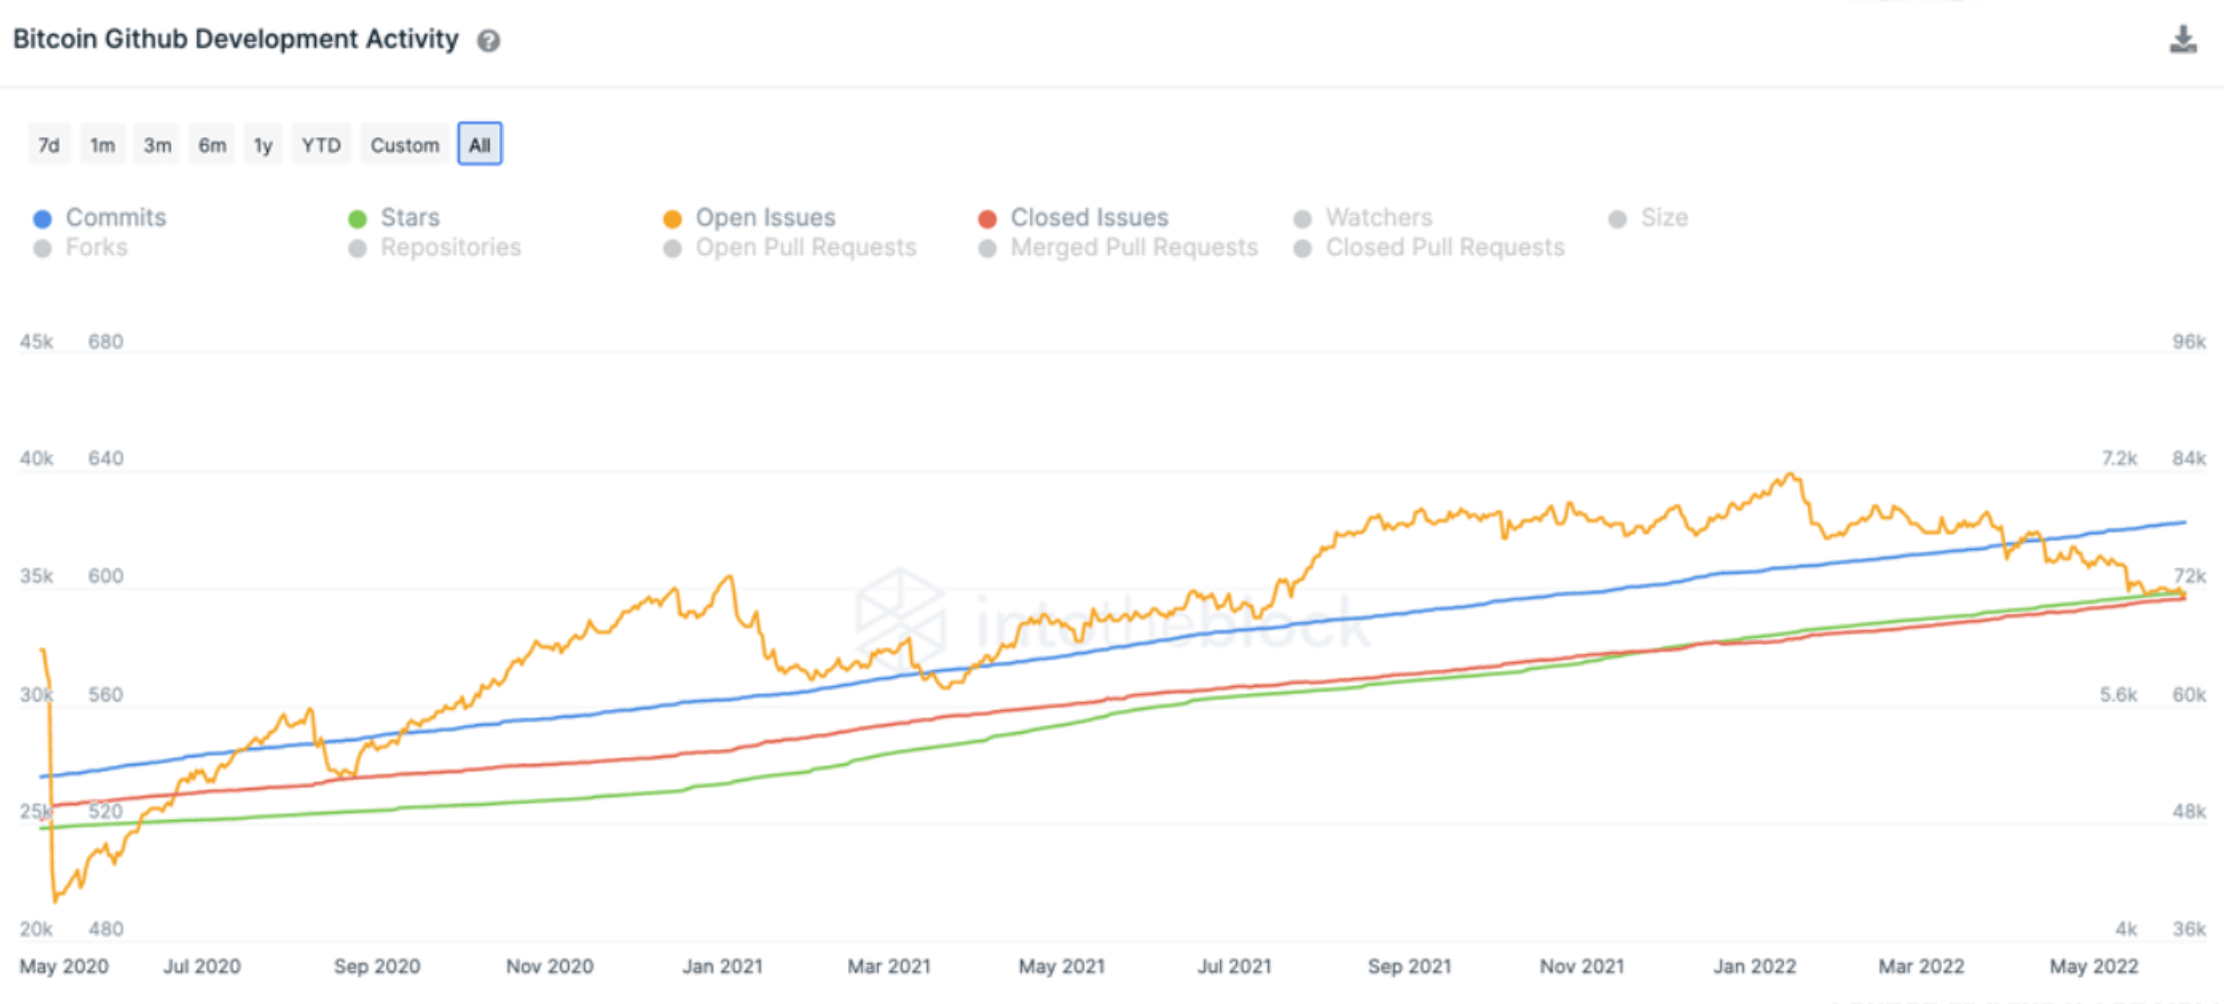
The indicator showcases a positive sign of growth in the crypto market, that is it relied on developers globally contributing to sustained improvement of these networks.
Doubling down
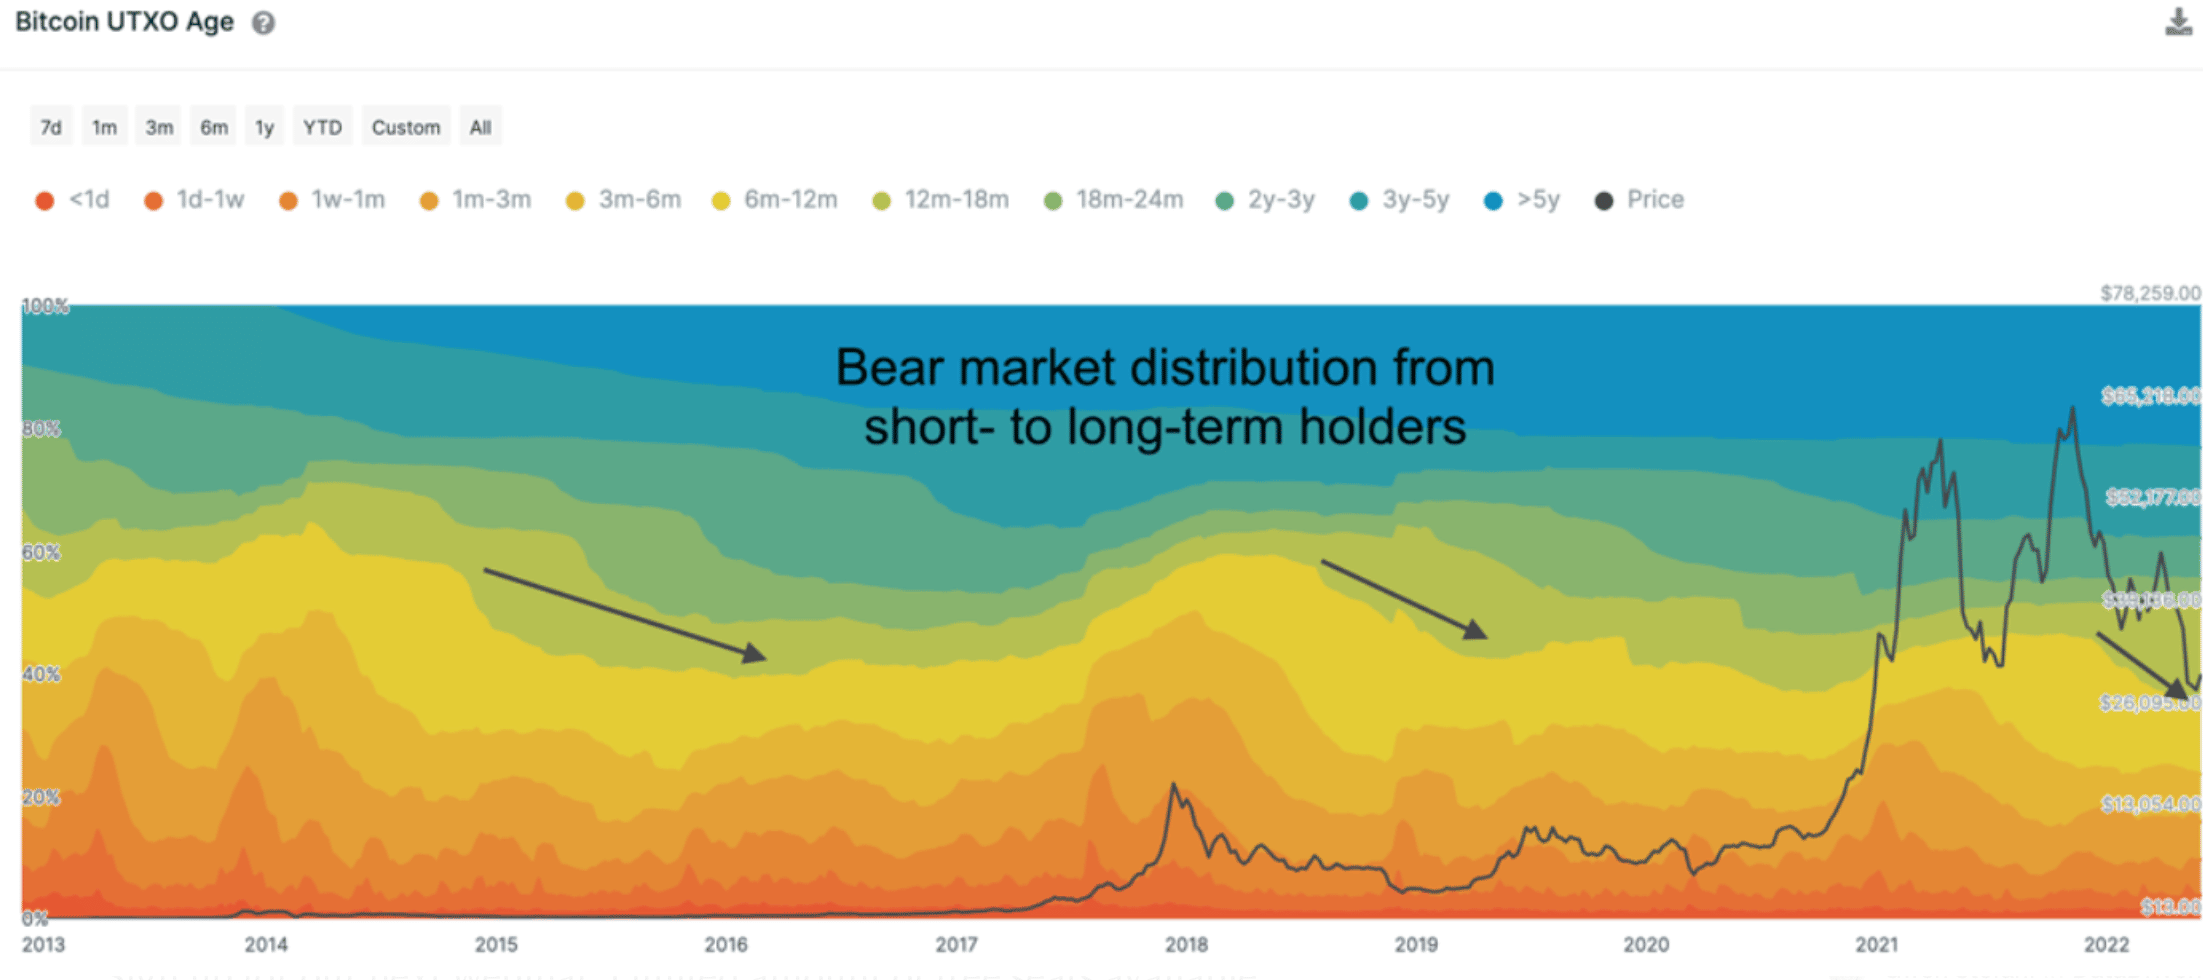
Both BTC and ETH HODLers have played a vital part to help grow the respective ecosystem. Investors with long-term horizons grew their holdings during bear markets. Consider the graph below that highlights BTC’s UTXO age.
As observed here, the percentage of Bitcoin owned by addresses holding one year or longer (green to blue colors) has expanded in previous bear markets.
Even for the largest altcoin, holders showcased strength by holding the coin rather than sending it to different exchanges with the intention to sell.