Why these Bitcoin metrics remain a ’cause for concern’

Bitcoin’s price recovery over the past week had been absolutely amusing, to say the least. The coin registered gains close to 23% during this time, with a 12% hike in the last 24 hours. It strongly held above the $35k price range since last night even as it had begun to move sideways.
Even as speculators seemed hopeful about the price rally, on-chain metrics regarding the coin’s activity remained largely dull over the week. The positive price movement seemed to have little impact on the on-chain data, which didn’t indicate signs of increased activity or rising demand. Contrastingly, dormancy had been evident on the chain as traders remained fearful of the top coin’s actions.
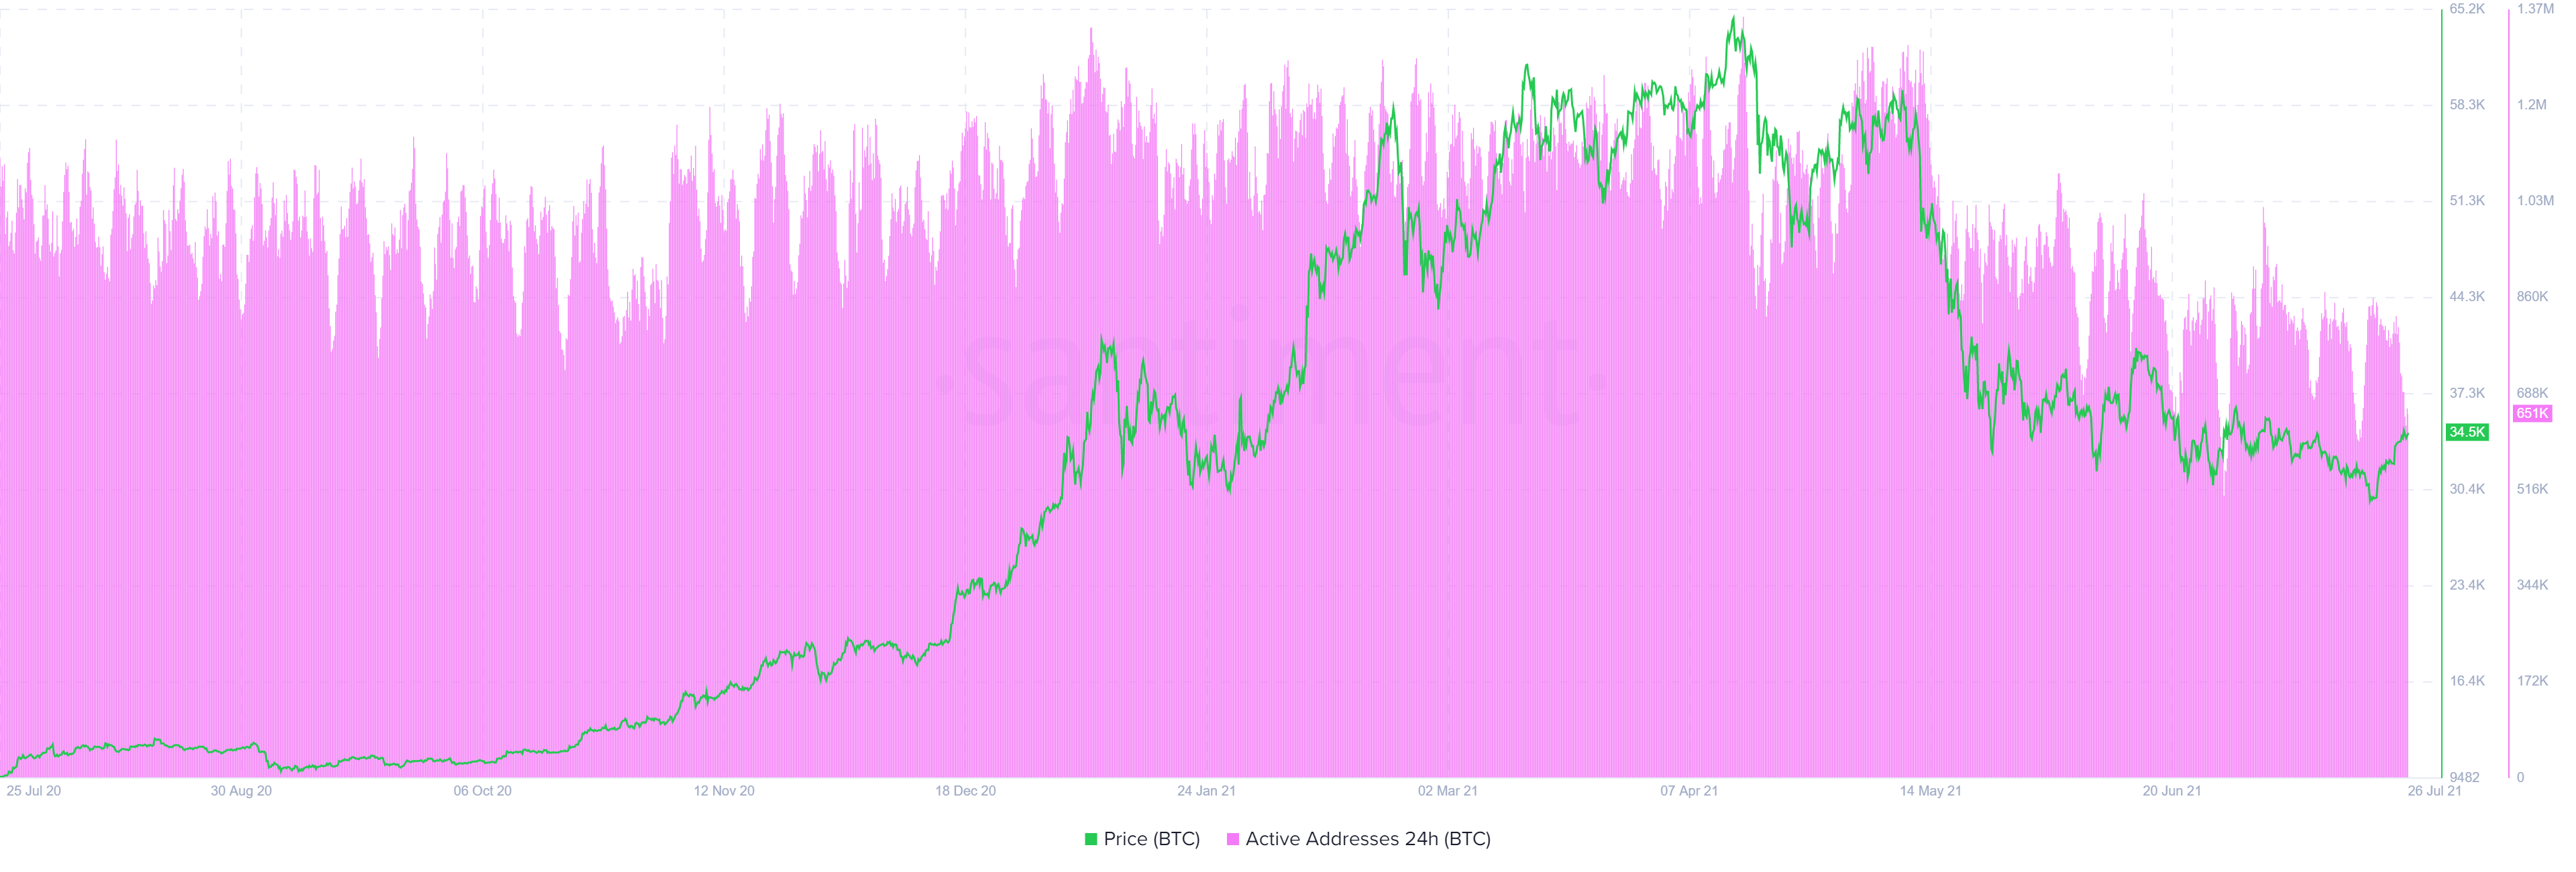
Firstly, the number of addresses interacting with BTC saw a steady decline throughout the week, falling by almost 26% to 632K yesterday. However, a recovery was seen in the past day, in which the active addresses rose up to 770k, although it was not coherent with the much-awaited price rise.
This decline in active BTC addresses, which now lagged behind its price, pictured a potential bearish divergence. Even as Bitcoin appeared bullish over the past day, an increase in network-level activity is a necessity for such rallies to be sustained, as it is often considered an indication for demand, according to a report by Santiment.
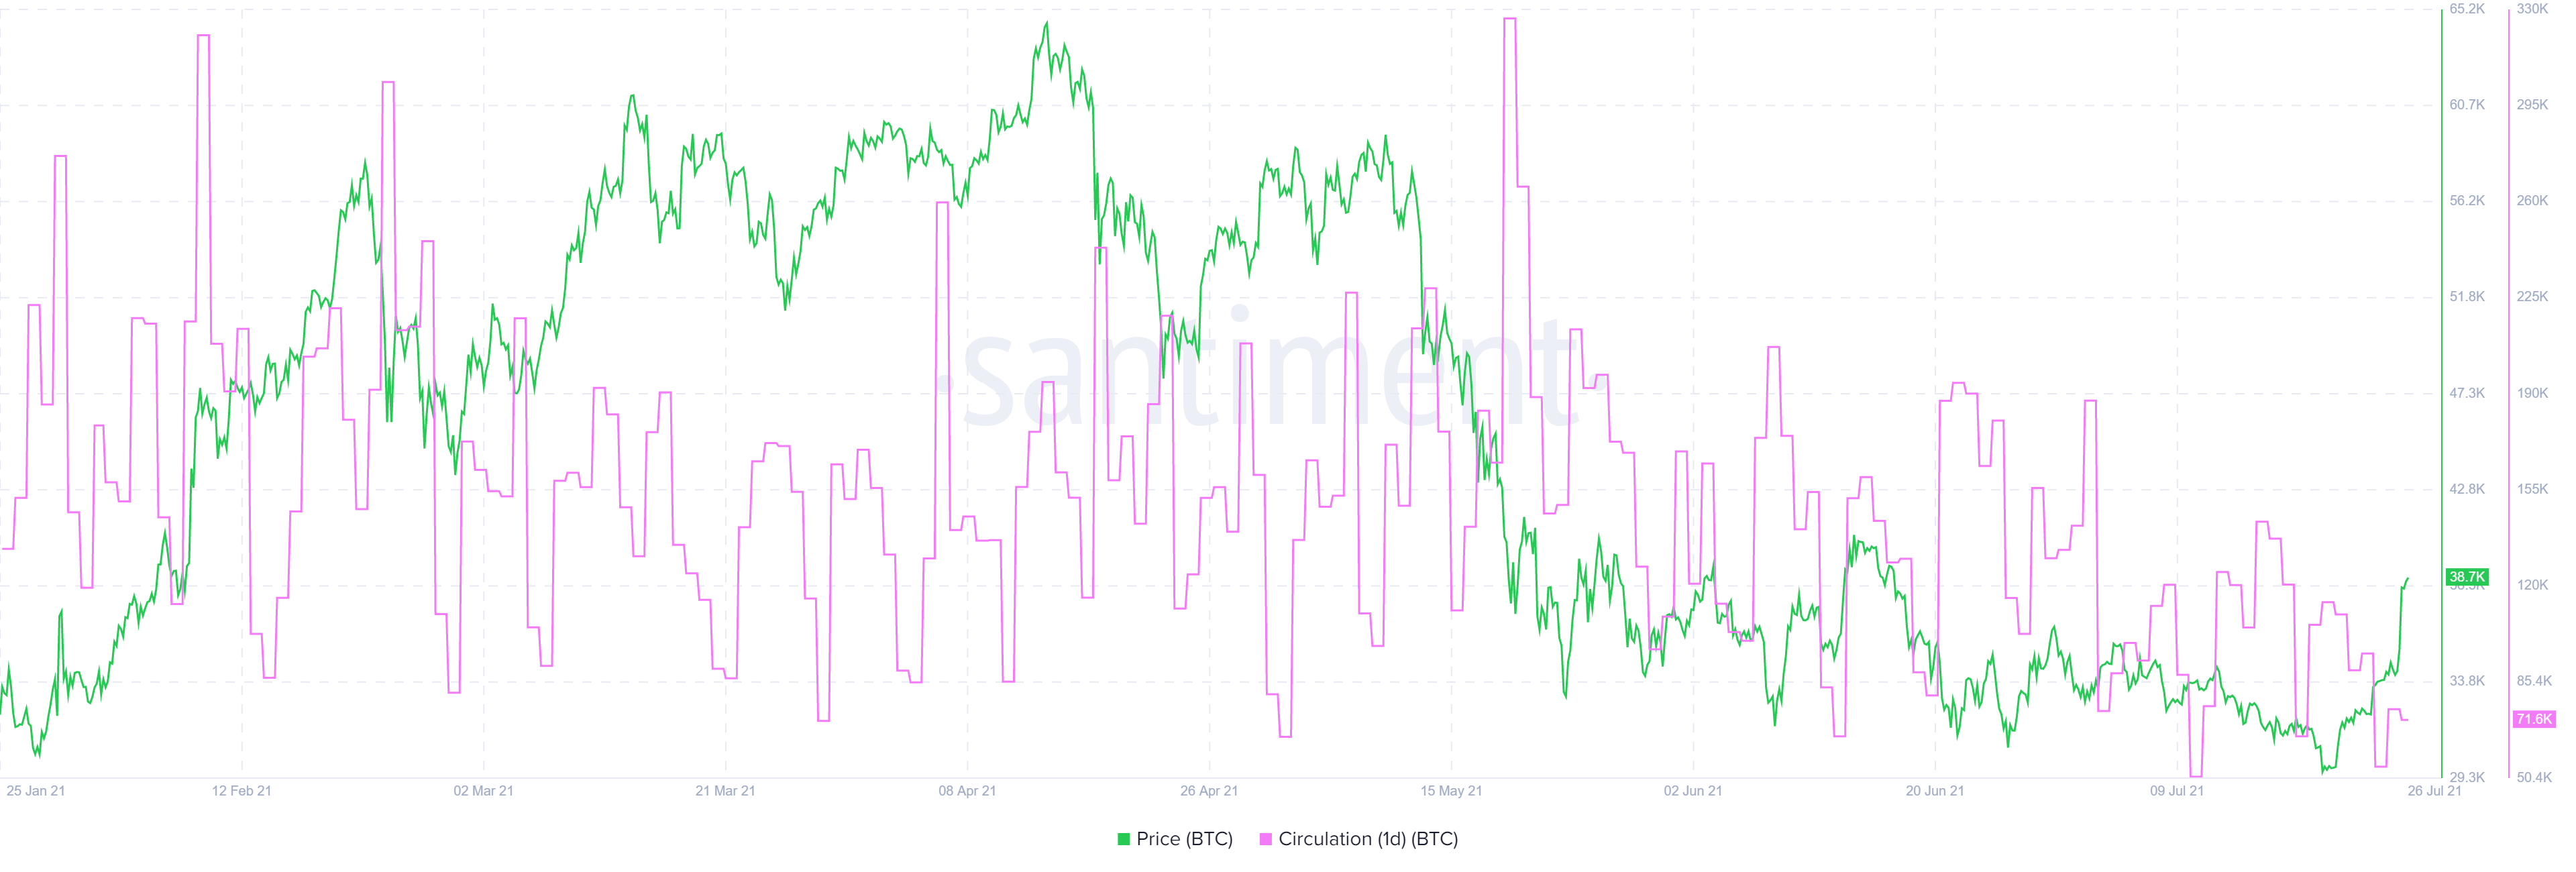
Moreover, the amount of unique Bitcoin moving on-chain daily itself saw a continued downtrend throughout the week. It was hovering at 71.6k at the time of writing, noting a slight uptick since last night. While this might sound like a lot, it was a far cry from the mid-May peak at 328k coins.
The fact that BTC’s circulation had been noting continued drop since the beginning of the correction phase suggested that holders were turning increasingly dormant while the total ‘value’ being moved was constantly declining.
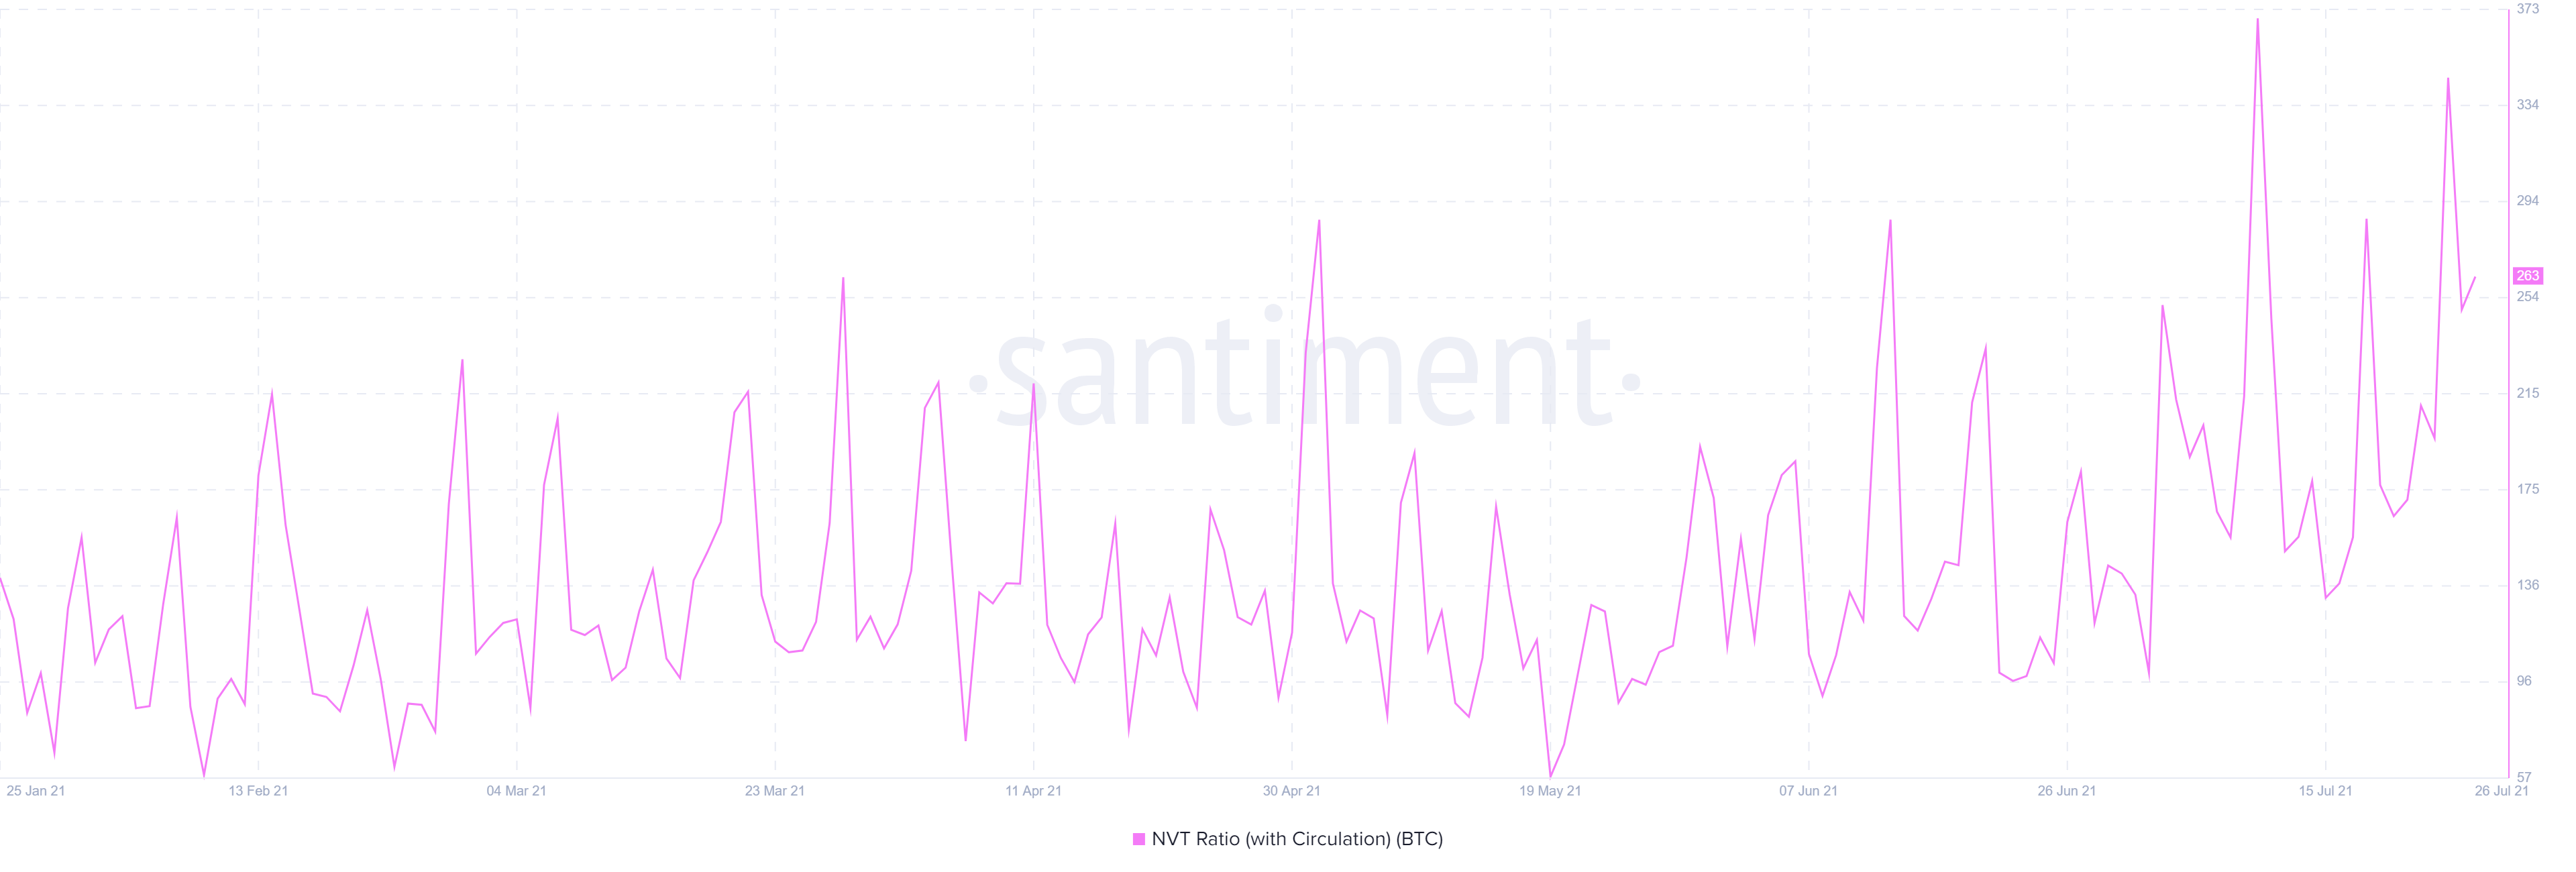
The aforementioned report also talked about Bitcoin’s NVT ratio, which continued to be in the red since late March. This ratio is derived from dividing BTC’s market cap with the number of coins moving on-chain. Since this ratio came out to be high, it meant that the coin might be overvalued.
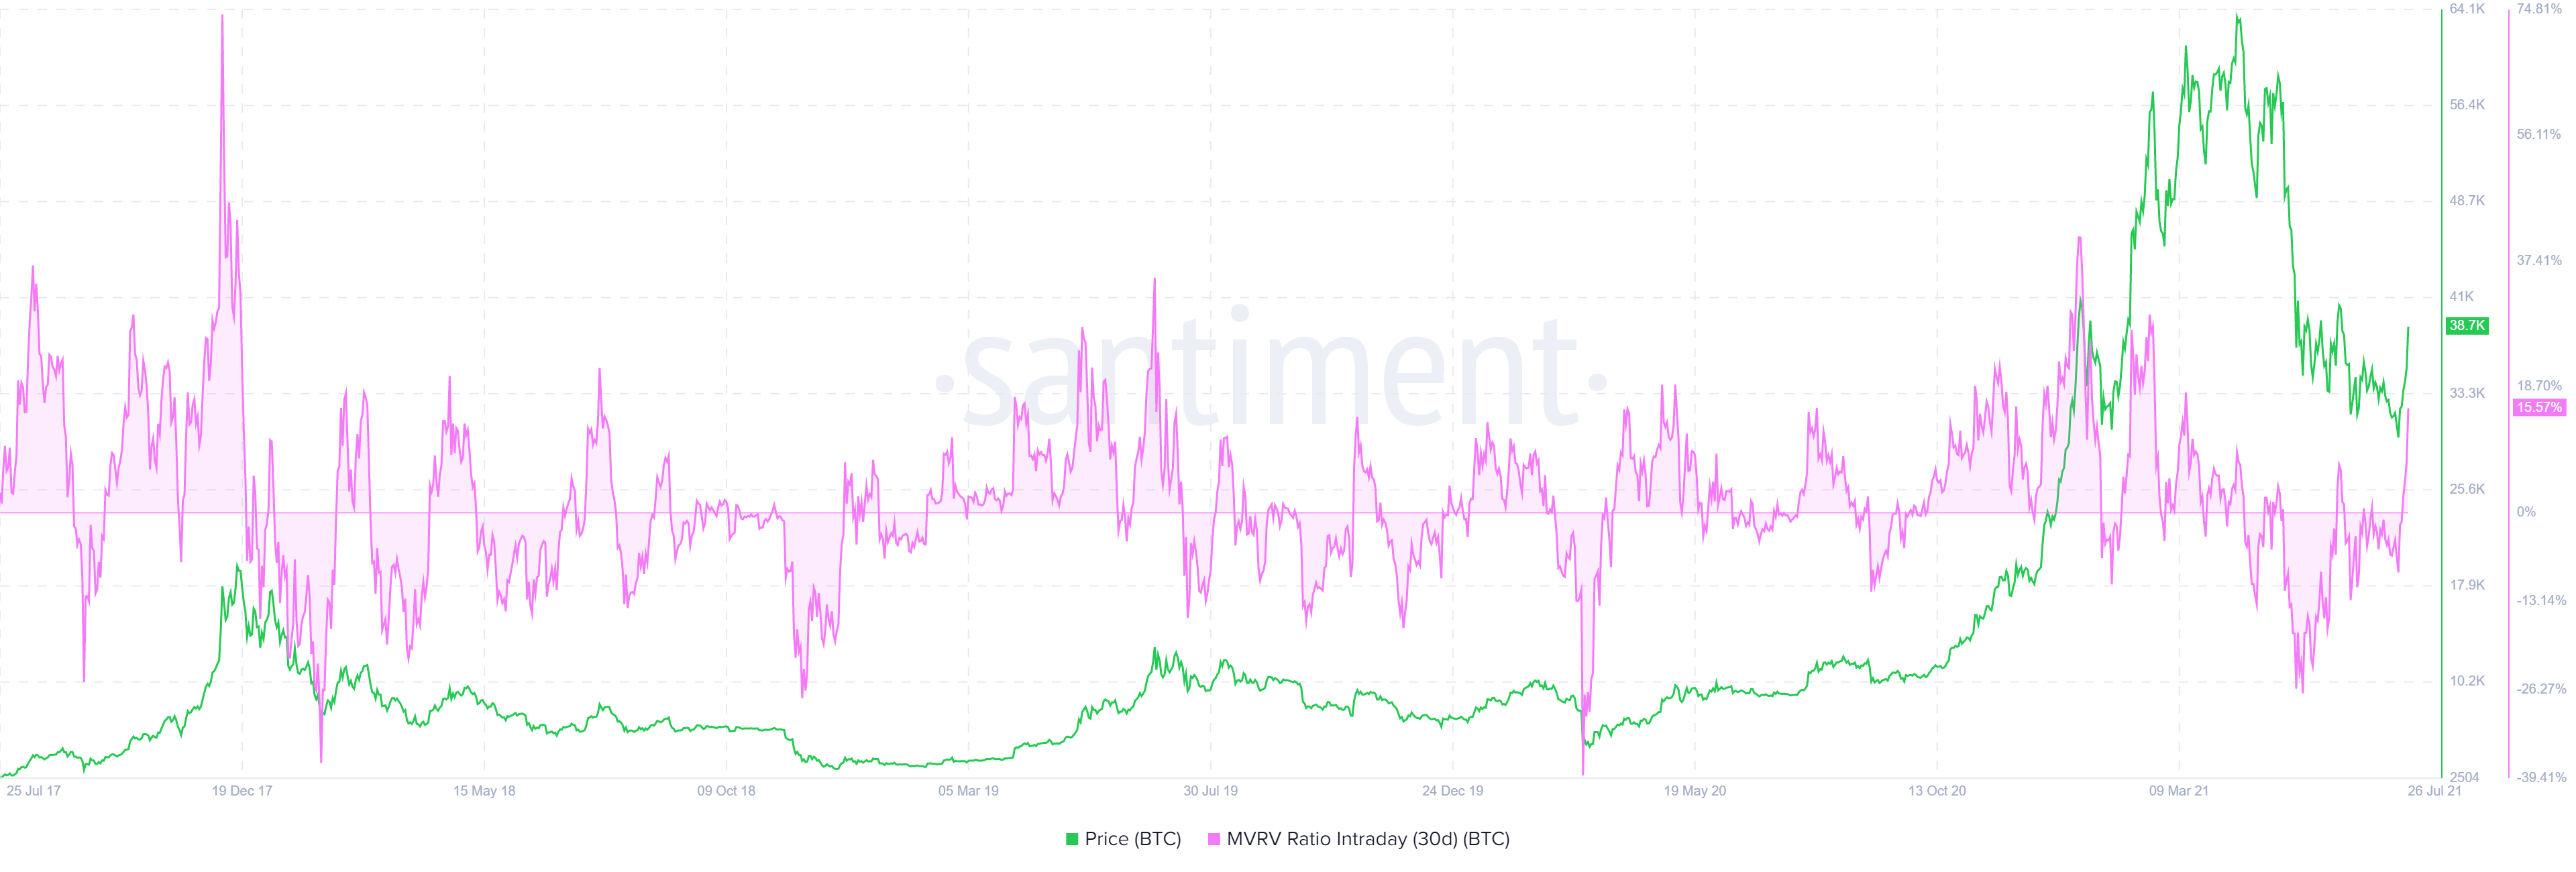
Lastly, looking at the top asset’s market-value-to-realized-value (MVRV) ratio presented another supporting argument. The ratio sat at +4.095% at the time of writing, which meant that the average profit of all addresses that have acquired BTC in the previous month was +4.095.
An increase in the MRVR ratio is directly proportional to the unclaimed profits on-chain, which itself is directly linked to holders selling out their coins to reduce their exposure. As is visible in the chart, Bitcoin’s 30-day MVRV ratio grew considerably by over 22% in the past week, and such highs have indicated ‘overvalued’ conditions for the coin in the past. It entered the typical danger zones, which have a tendency to peak between 15% to 25%, signalling the need for short term stabilization.
Even while these lethargic indicators remained a “cause for concern”, it might take a while for the latest rally to reflect on-chain. However, continued lower network activity going forward could prove to be a hindrance to the top coin’s recovery and growing price action going forward.


