Why traders could eye sub-$1,300 Ethereum targets if Bitcoin slumps below $60,000
The Coinbase Premium Index and the price trends both showed that Ethereum sellers might be in control for now.

The Glamsterdam Ethereum [ETH] upgrade is set to be rolled out in Q3 of 2026. The upgrade’s focus will be on processing transactions and allowing the handling of multiple transactions simultaneously, while also updating the fee rules to support higher network capacity.
Improved speed, capacity, and efficiency will be a great outcome for one of the largest Layer-1 networks in crypto. However, it might also have very little immediate impact on the altcoin’s price.
Despite Ethereum being able to attract institutional buyers, the market-wide selling has not eased significantly yet.
Sidelined dry powder could supercharge an Ethereum recovery
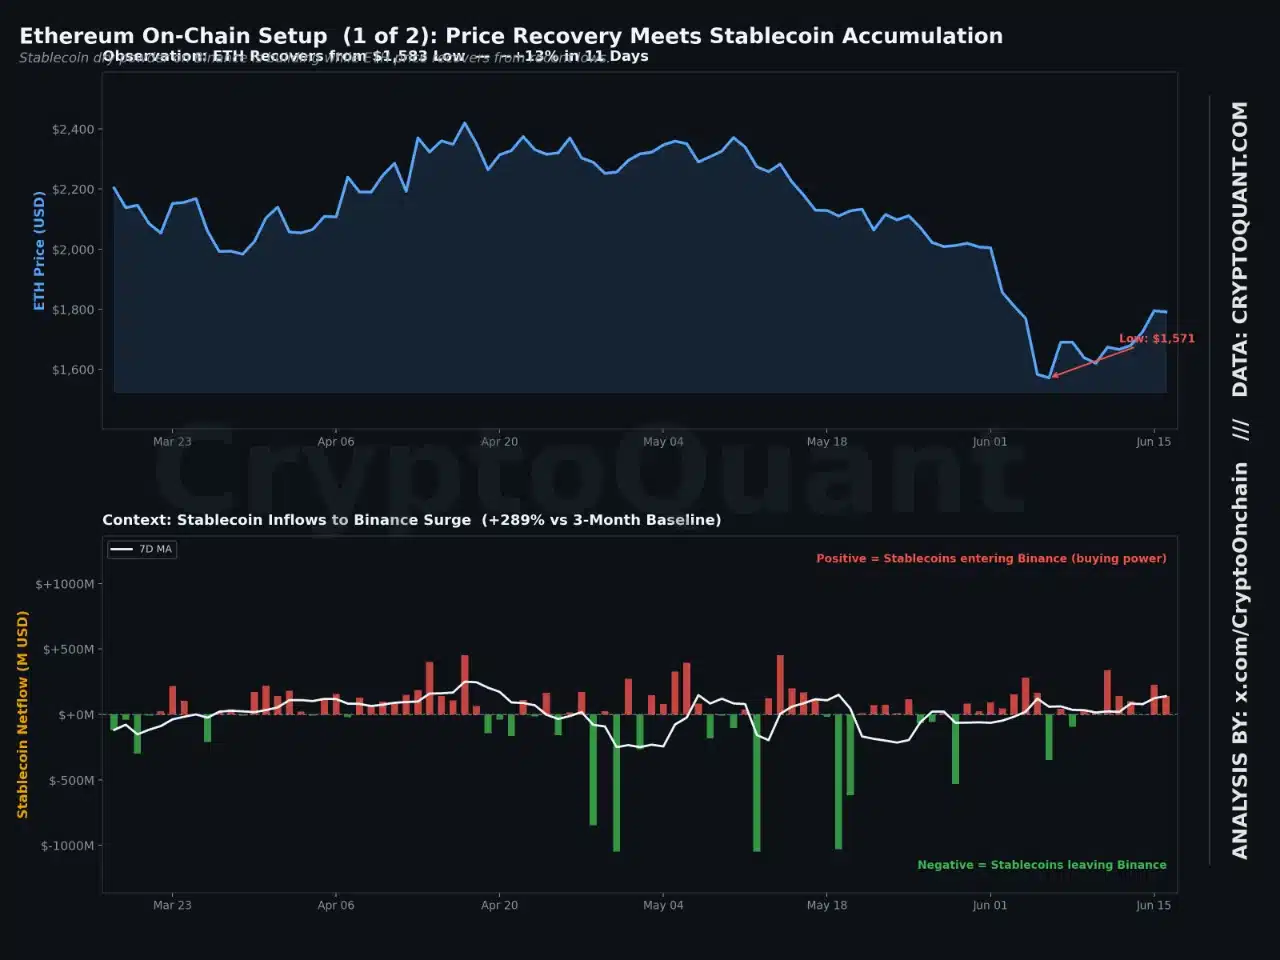
Posting on CryptoQuant Insights, analyst CryptoOnChain drew attention to the rising stablecoin net inflows to Binance.
At the same time, ETH has been flowing out of exchanges, leading to falling reserves.
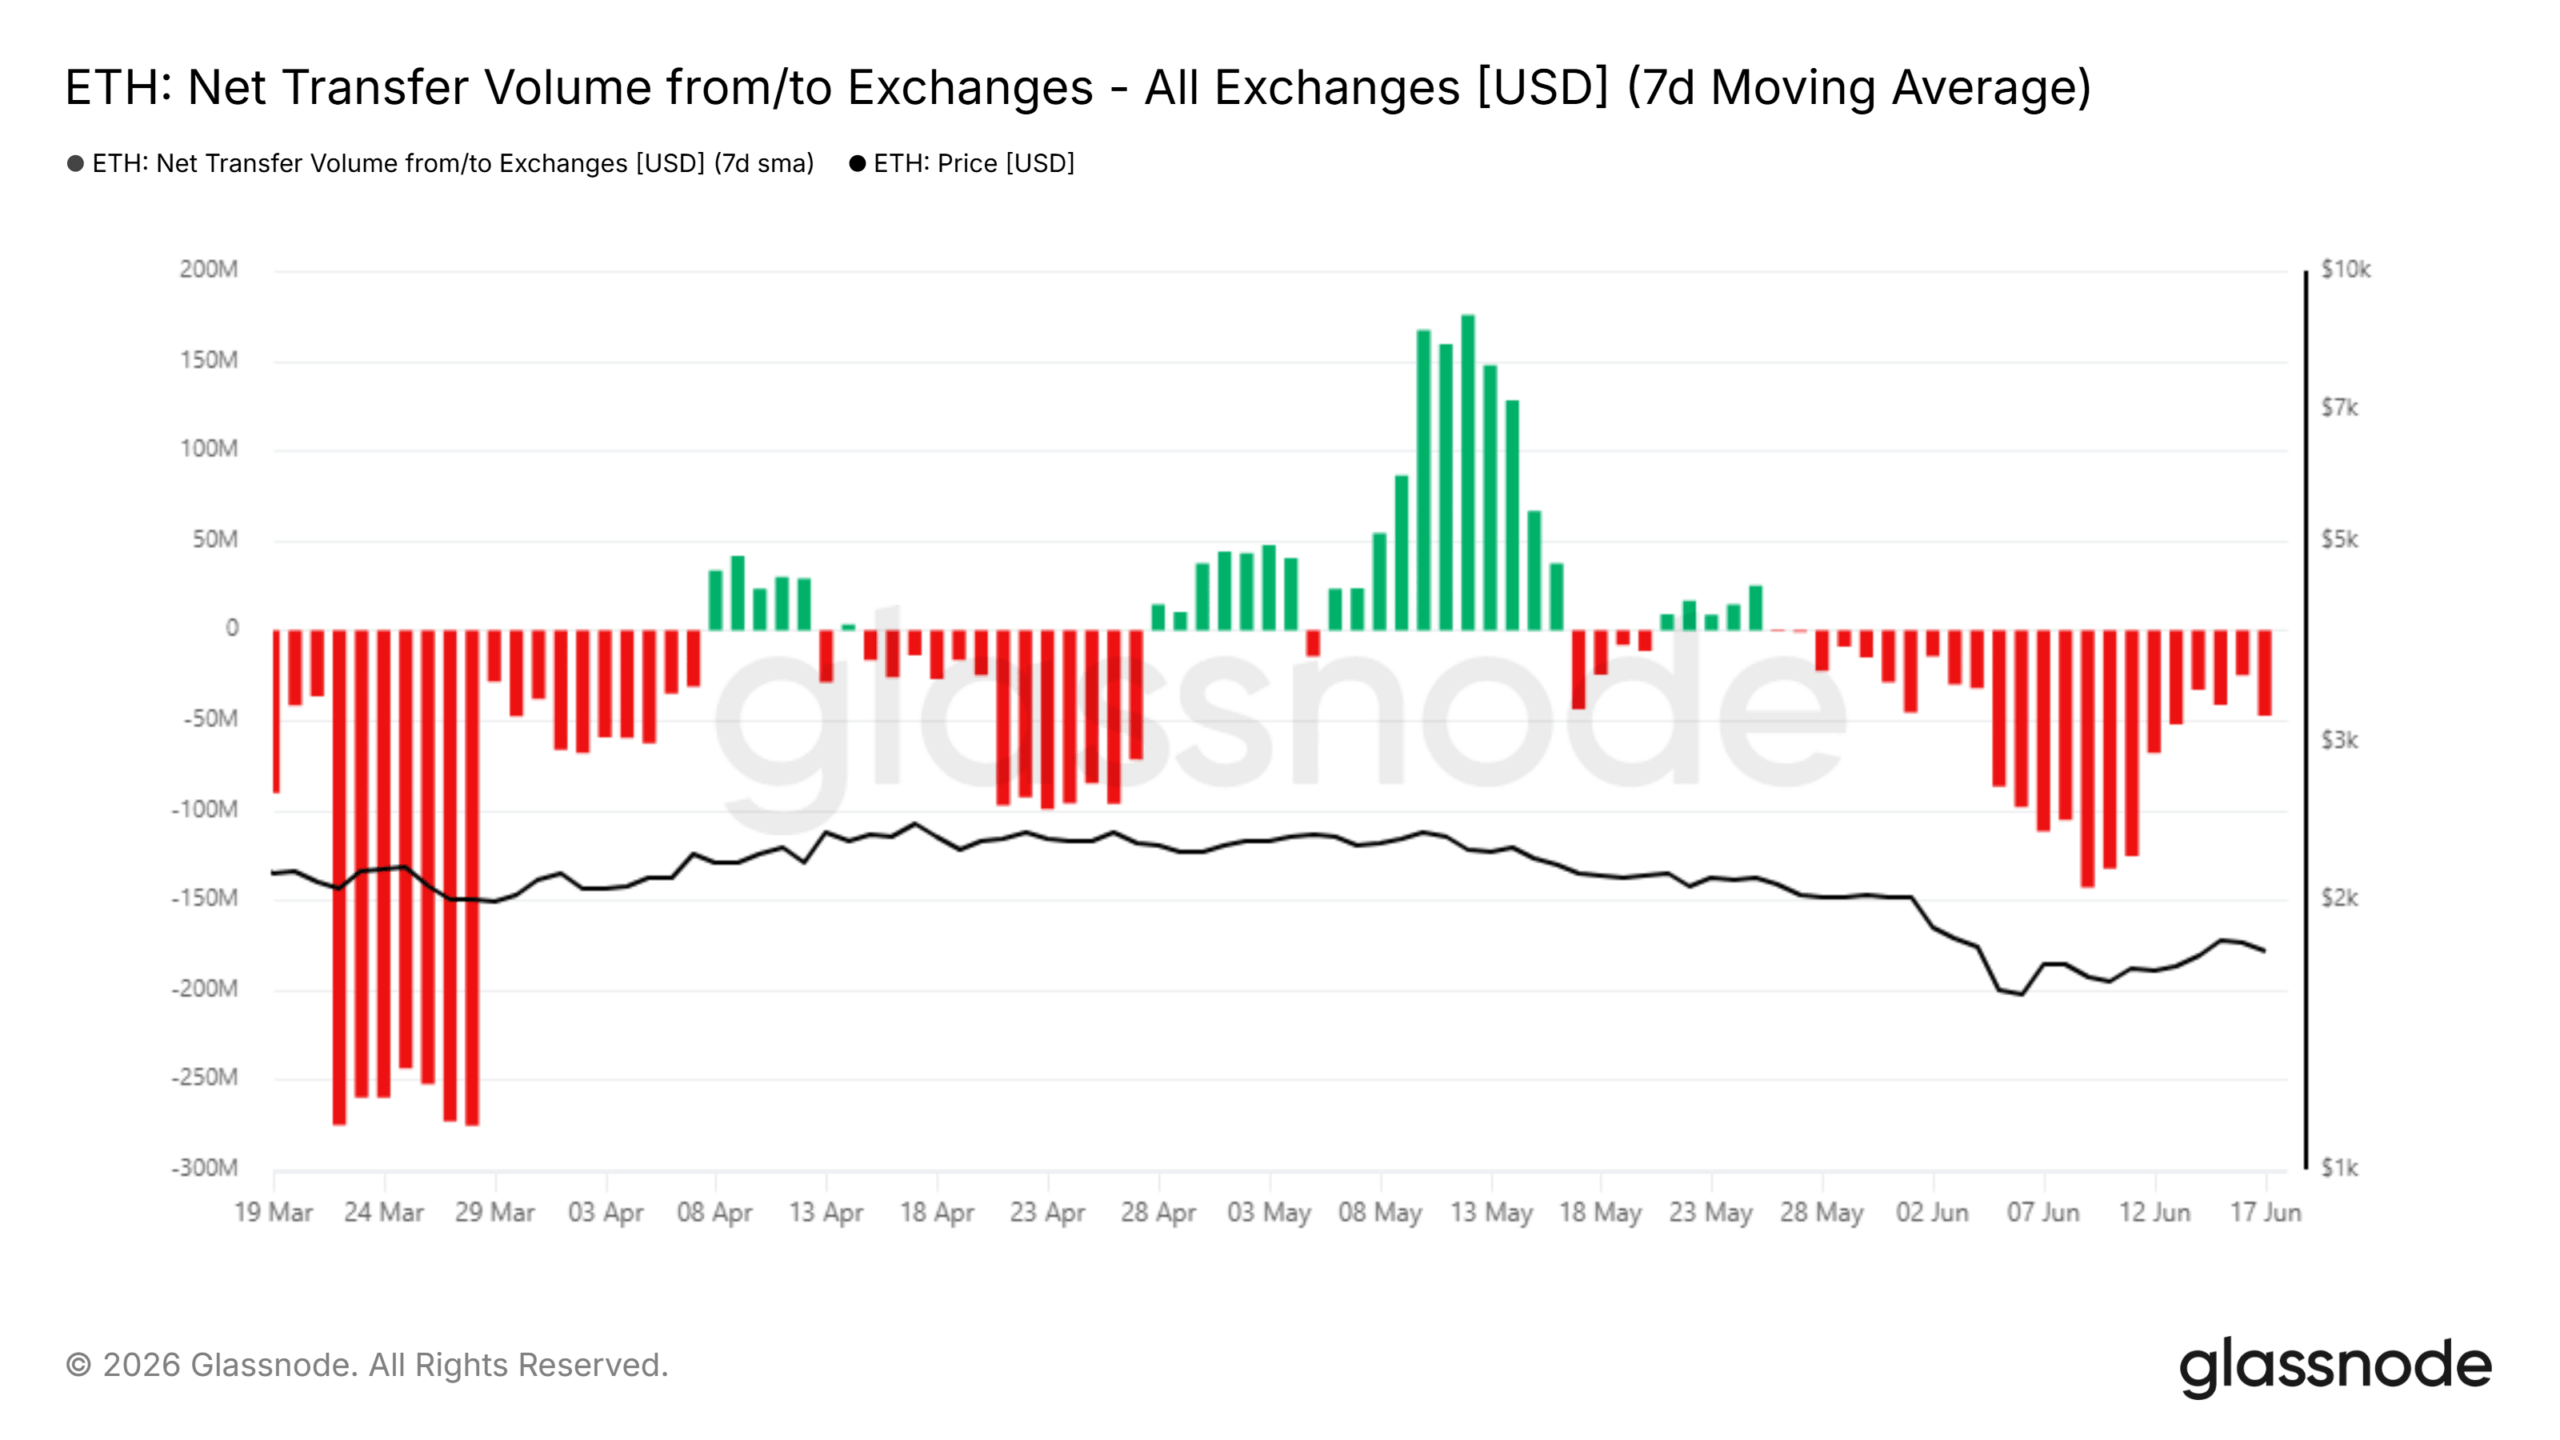
Rising stablecoin deposits on exchanges represent buying power waiting on the sidelines. The negative 7-day net transfer volume agreed with the ETH flow out of exchanges.
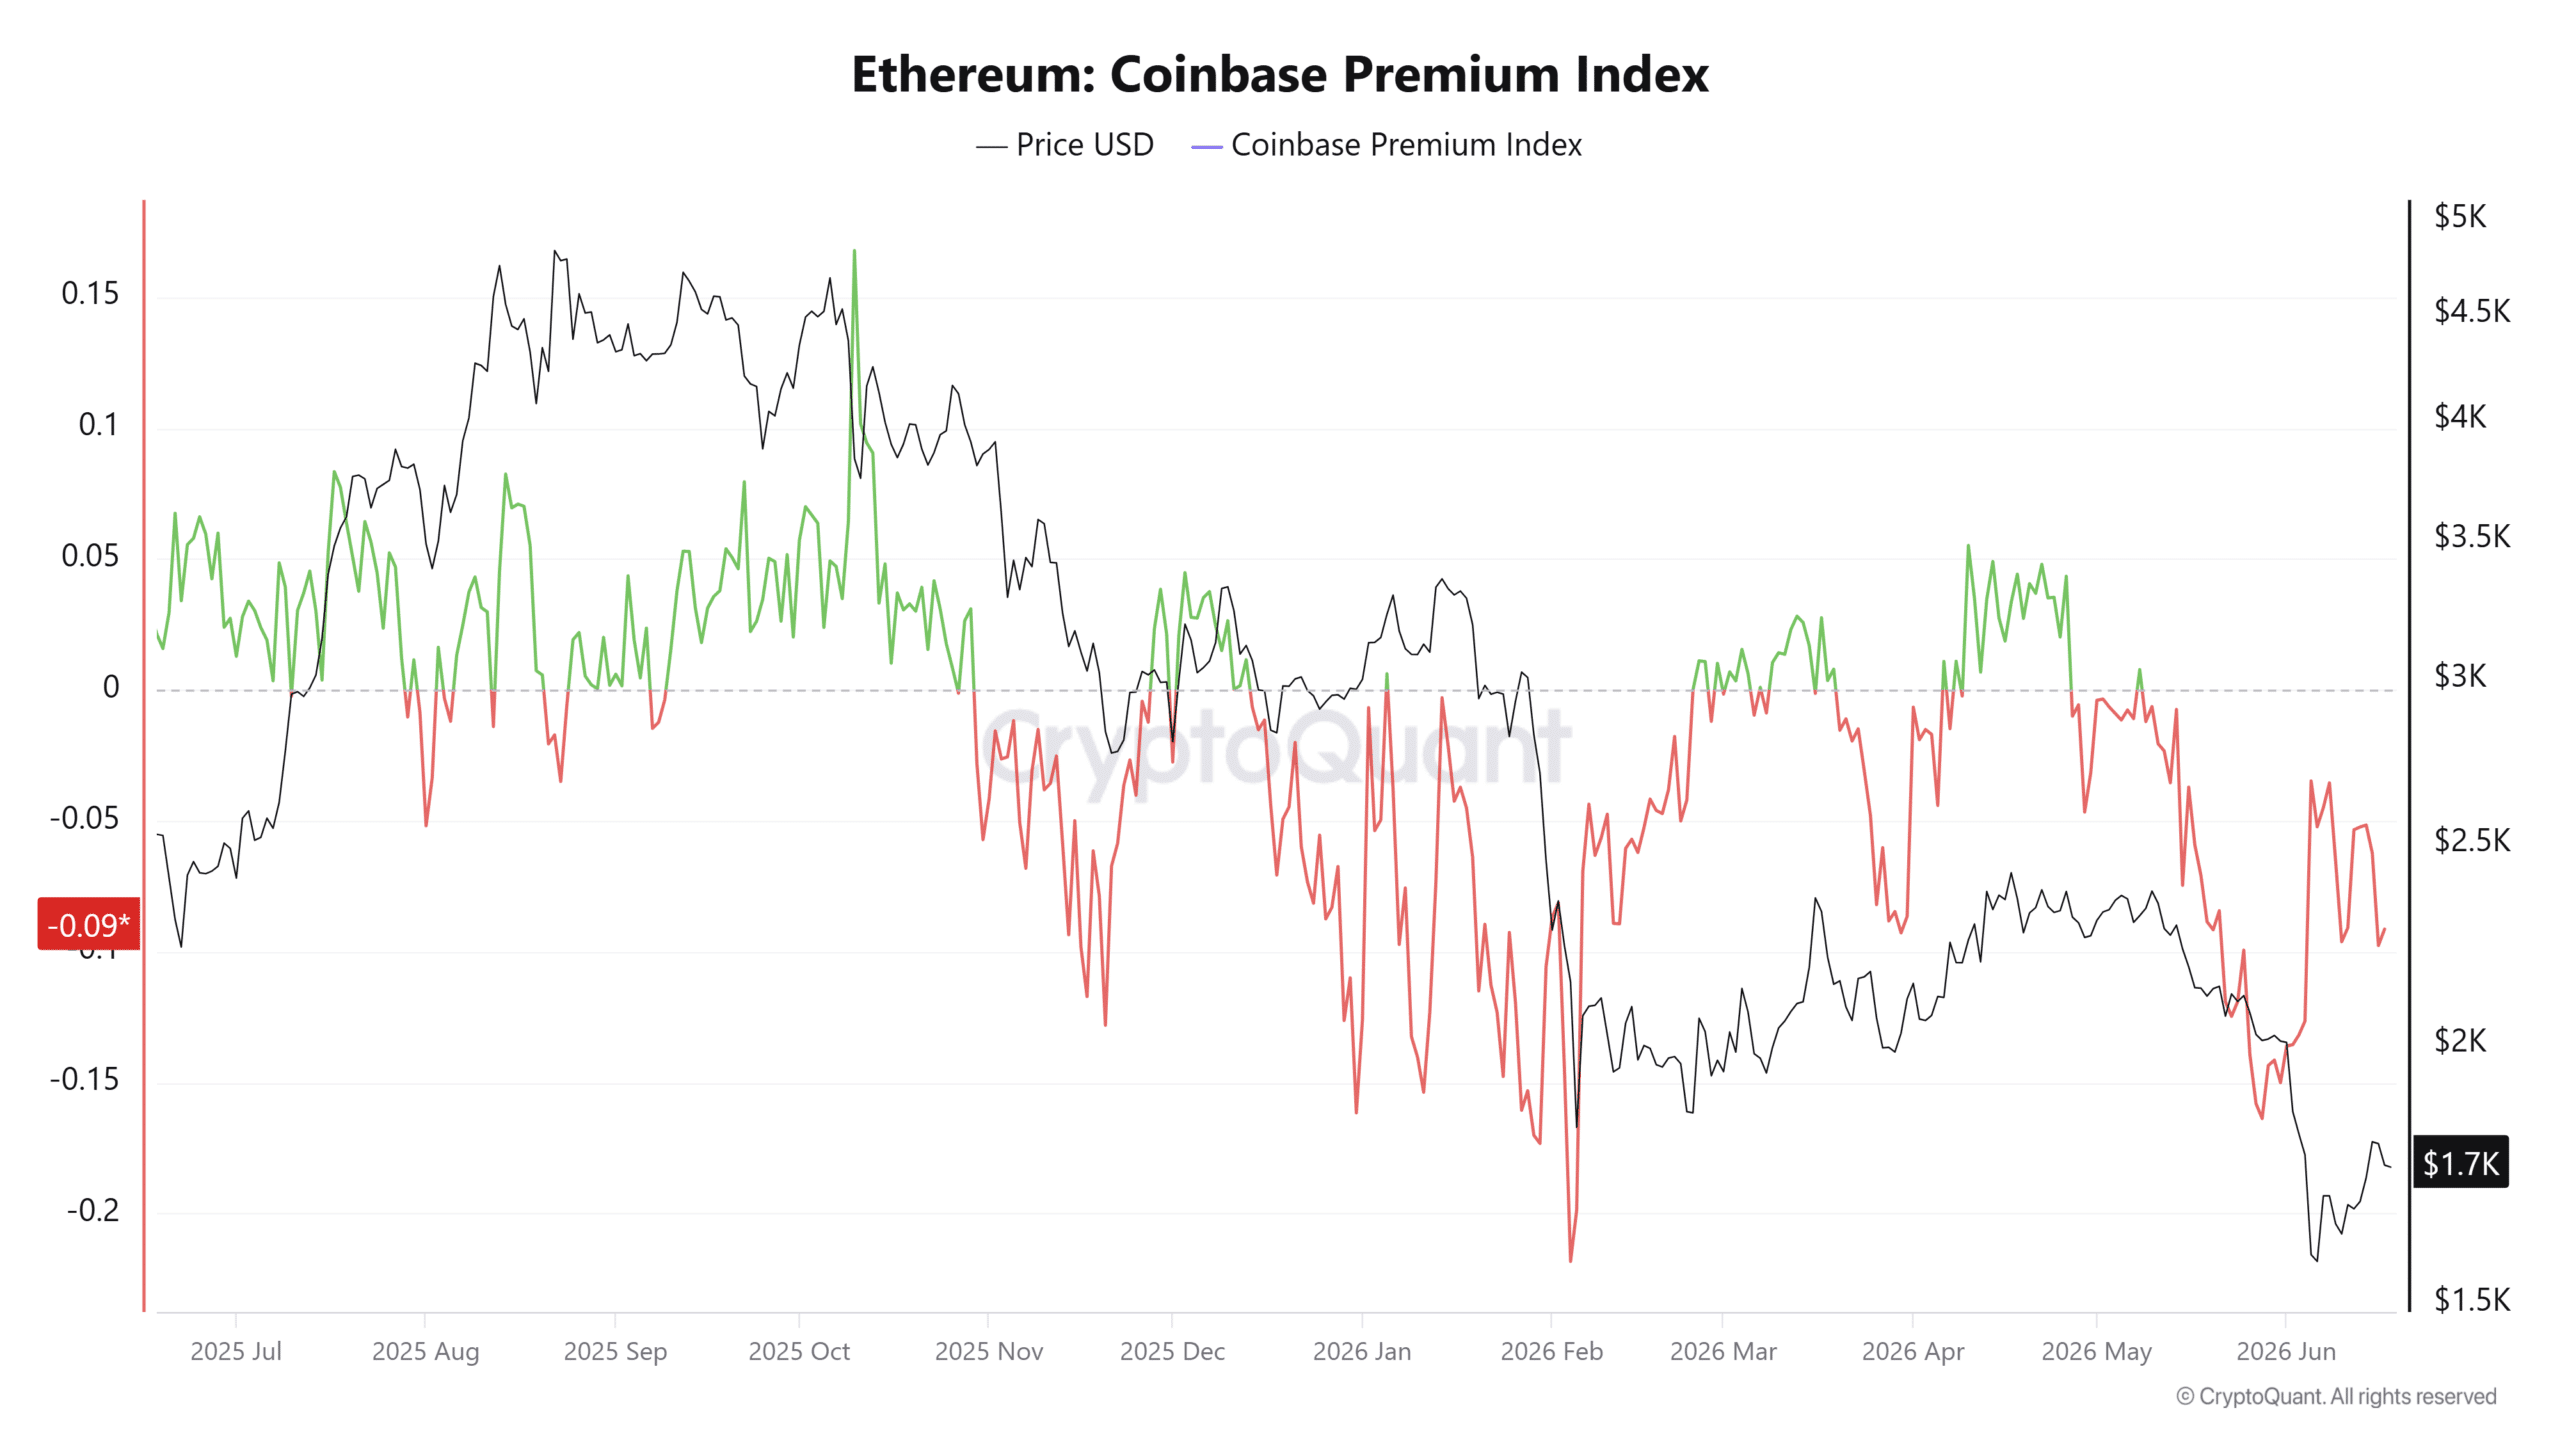
However, the Coinbase Premium has been falling in recent weeks – Evidence of how U.S-based investors might not yet be willing to bet on a price recovery.
These metrics set up the conditions for sharp price volatility in either direction. Another sell-off might be necessary before smart money chooses to stop waiting and enter with sizeable capital.
Dissecting the conflicting Ethereum signals
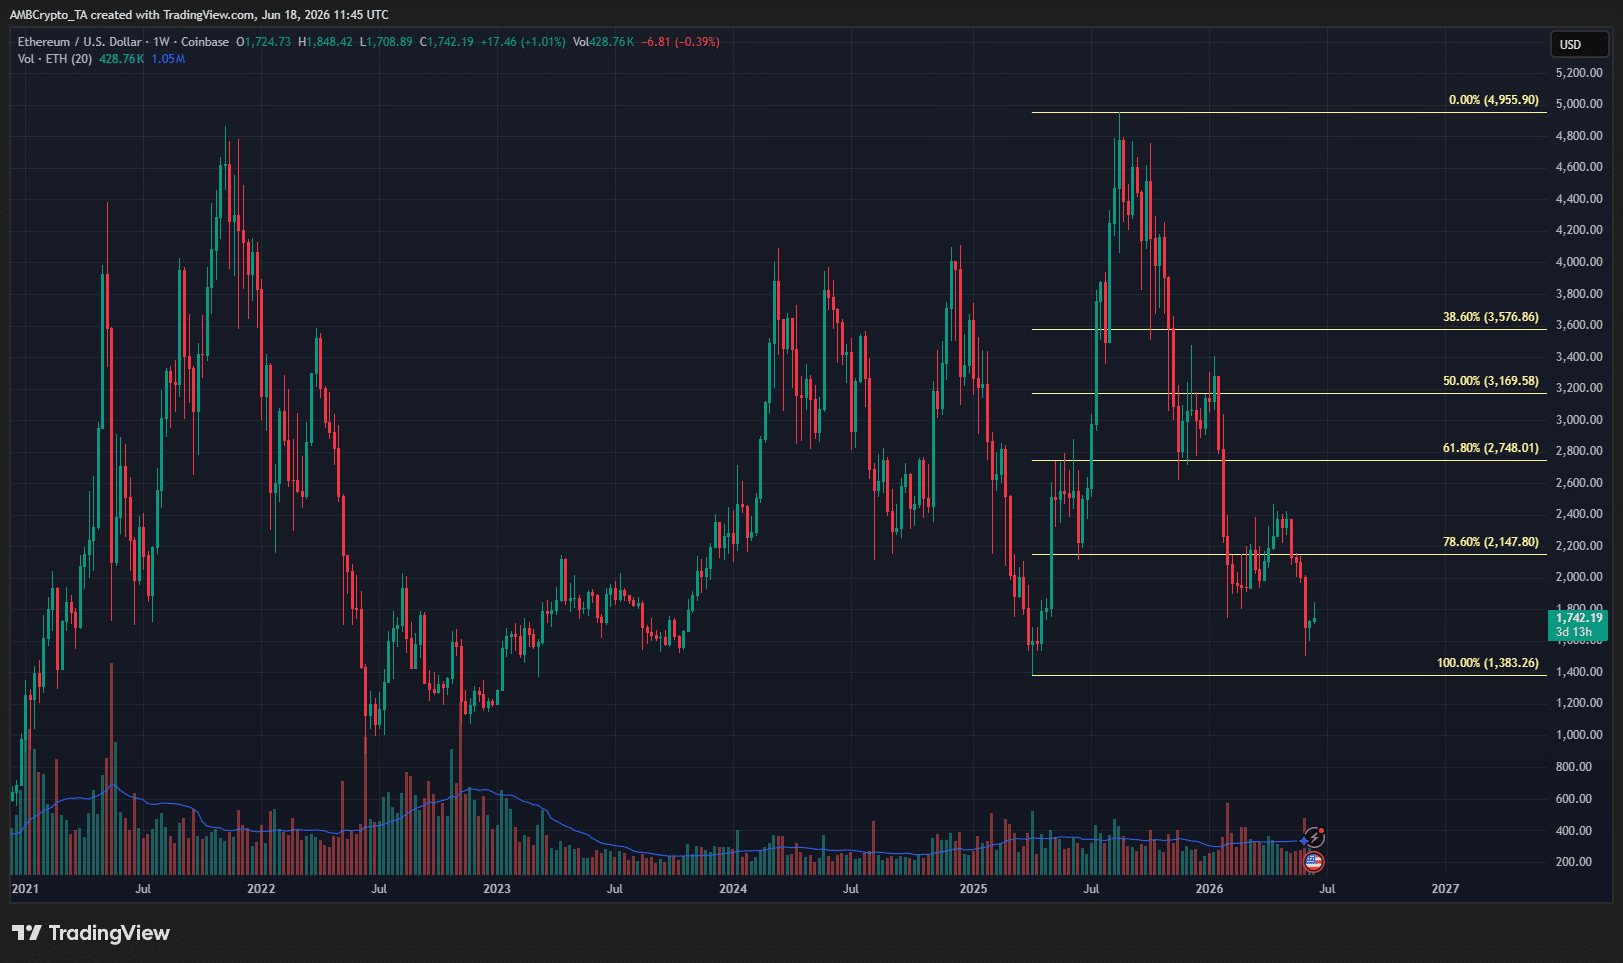
At press time, the weekly Ethereum chart exhibited a bullish swing structure.
Crucially, the 78.6% retracement level at $2,147 had been breached too. The internal structure was bearish, especially after the sellers were in control for nearly 10 months.
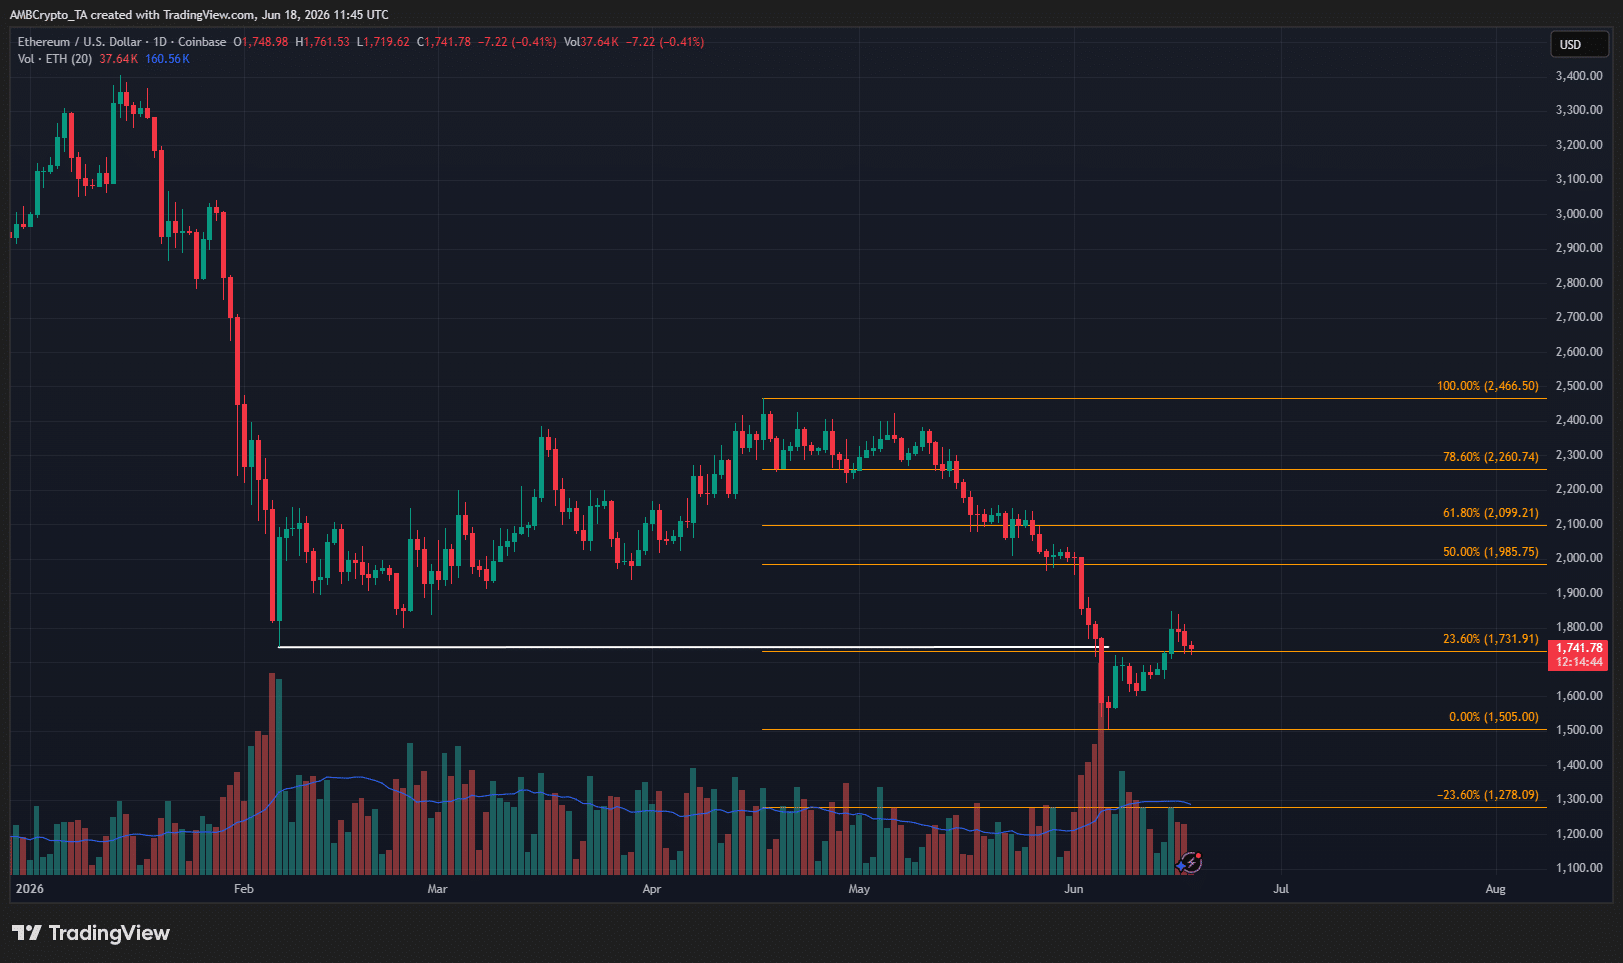
They did not seem likely to relinquish their grip on the markets anytime soon. In fact, the 1-day chart had a bearish structure and had fallen below the February lows earlier this month. This breakdown could be evidence of a bearish continuation.
Technically, a bounce to the key retracement levels at $2.1K and $2.26K is possible, but unlikely if Bitcoin [BTC] slumps below $60K once again.
Therefore, traders and investors can anticipate a move towards the southward extension level at $1,278 next.
Final Summary
- Ethereum exchange outflows represented accumulation while stablecoin supplies climbed on the charts.
- Coinbase Premium Index and price trends both suggested sellers may be in control for now.