Why XLM [Stellar] traders should prepare for this move

Since reaching its multi-year high last year, Stellar (XLM) dropped south toward its long-term $0.16 floor. The recent falling wedge (white, dashed) breakout gave XLM the much-needed hike to topple its long-term trend.
A sustained close above its near-term liquidity range (Point of Control/POC) would position XLM for a test of its southbound 20 EMA near the $0.2-zone. At press time, XLM traded at $0.1952.
XLM Daily Chart

Since XLM struck the $0.8-level, it plunged to consolidate between the $0.19-$0.39 range for over eight months. The previous bearish phase marked a down-channel (white) on its daily chart as the alt lost nearly 63.4% (from 10 November) and hit its 13-month low on 24 February.
Meanwhile, the 50 EMA (red) was a strong selling point that shunned most bullish recovery attempts. However, the mid-March bullish revival propelled a much-desired hike that halted at the $0.23-level. Since then, the sellers have reignited their sway whilst the 20 EMA jumped below the long-term EMA’s.
A potential break above the $0.2 resistance would be possible if the buyers reclaim their supremacy above the POC. But before that, it would likely continue to be in a tight phase near its liquidity range. On the flip side, a fall below the $0.190-mark would lead to a delayed recovery towards the $0.2-zone.
Rationale
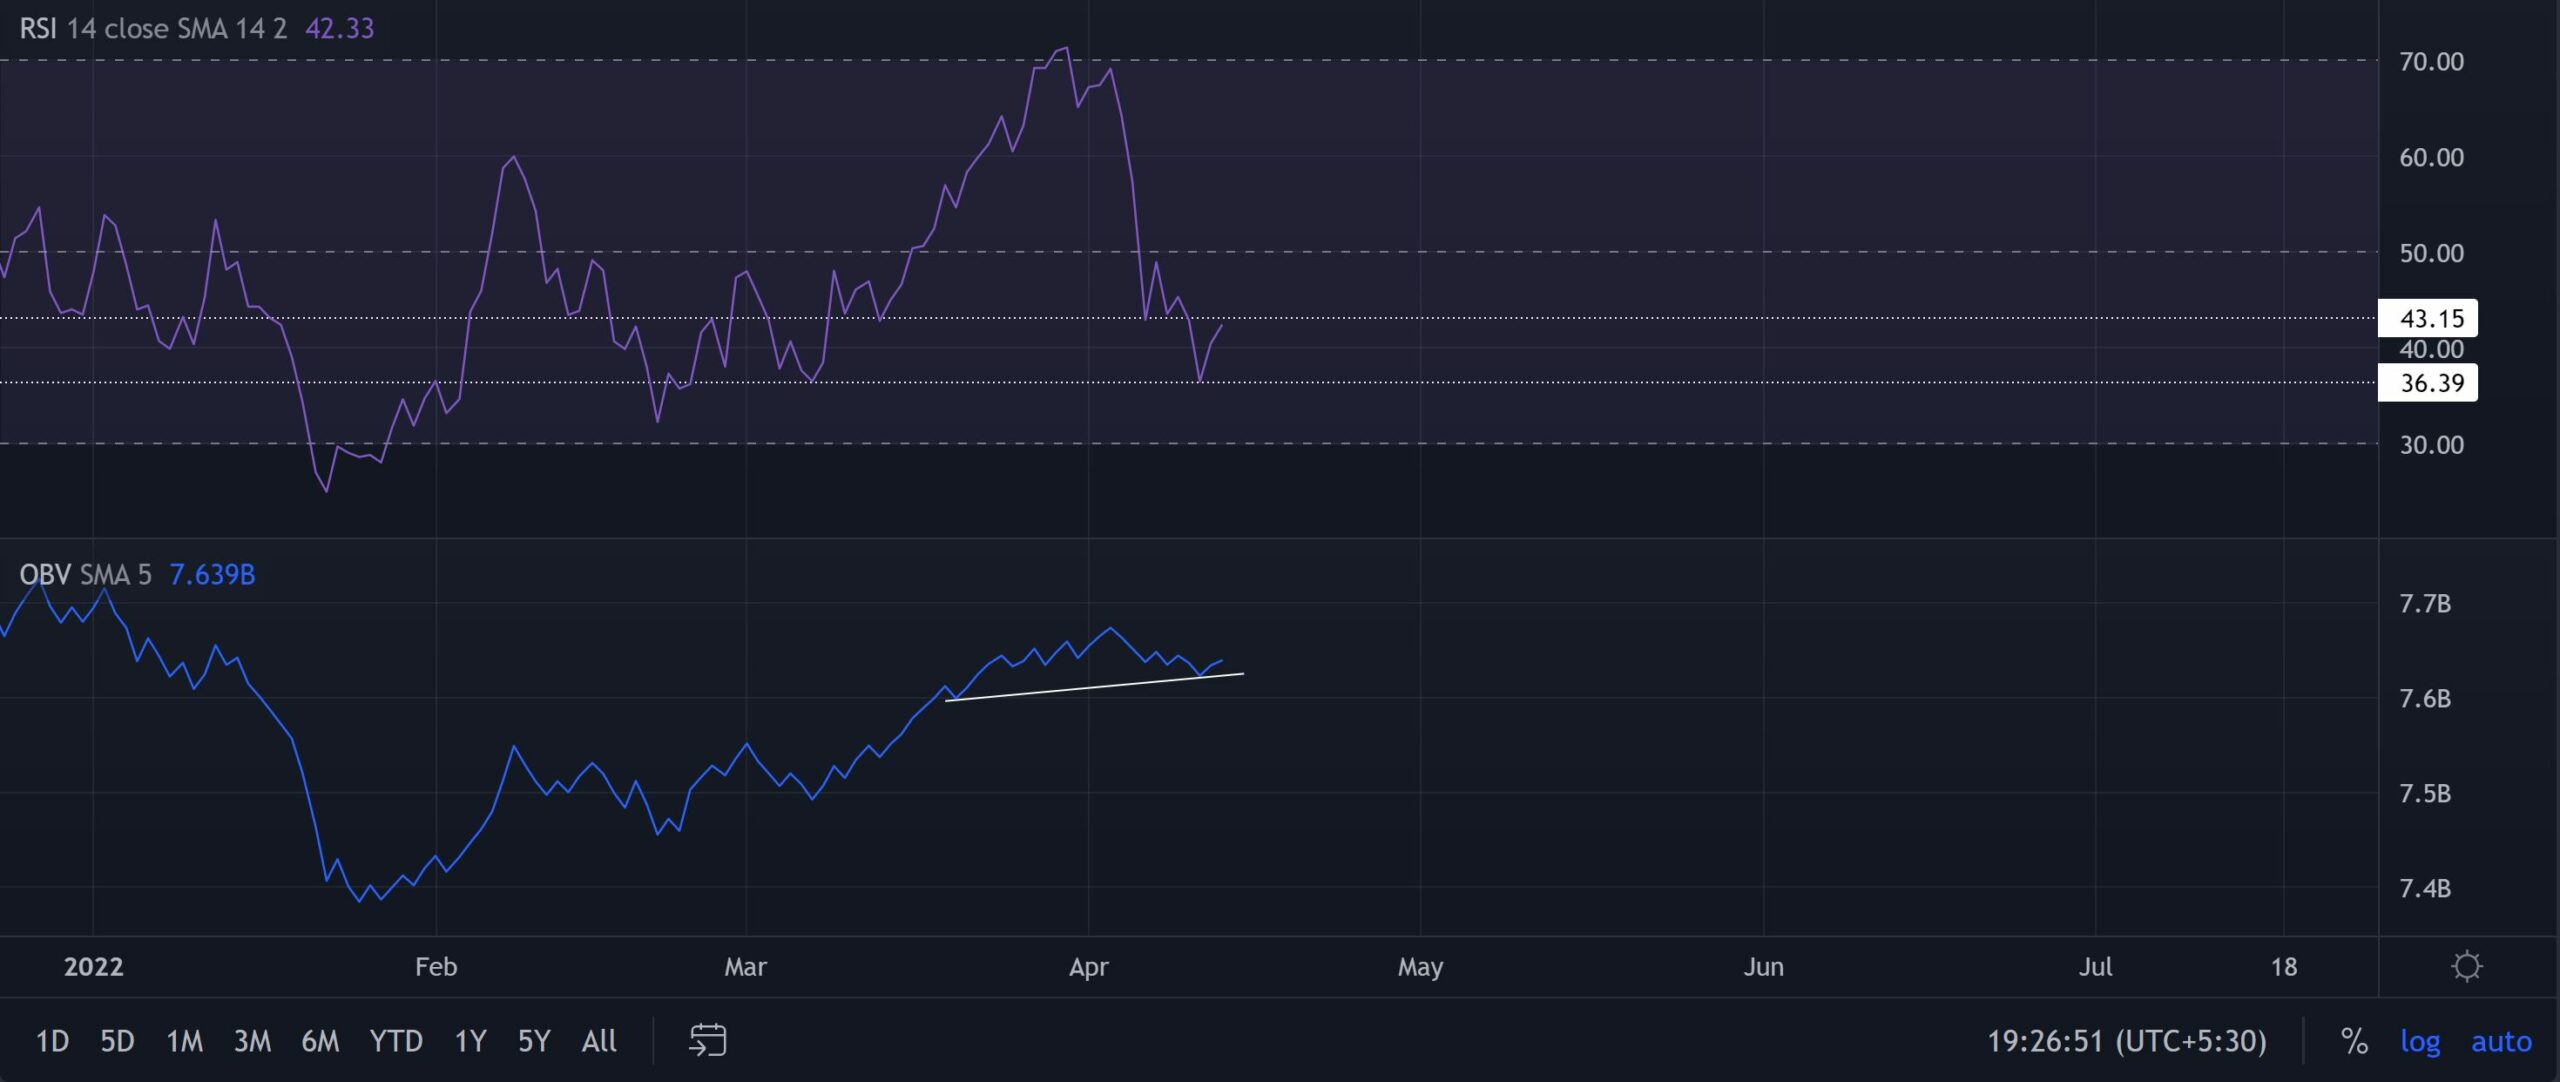
The RSI found a strong base at its seven-week support at the 36-mark. A close above the 43-level would be essential in sustaining a price recovery towards the $0.2-mark.
Furthermore, the OBV marked bullish trendline support over the last few days while the price found newer lows. This trajectory revealed and affirmed a bullish divergence with the price on the daily timeframe.
Conclusion
A close above the POC supported by a bullish OBV divergence is just what the buyers would need to test and eventually break open the $0.2-resistance. But with the 20 EMA looking south, the alt would likely see a slide towards its POC and before a trend commital move.
Besides, the investors/traders should factor in the broader market sentiment and the on-chain developments to make a profitable move.