WIF price prediction – How far will memecoin fall on the charts now?
WIF's OBV offered long-term buyers some hope and yet...

- WIF formed a bearish structure break after its fall below $2.32
- Momentum remained bearish, but the OBV gave buyers some hope
dogwifhat [WIF] posted losses of 38.4% over the past week. It had a bullish outlook two weeks ago when the memecoin bulls achieved a bullish structure break. However, Bitcoin’s [BTC] sharp price losses since Monday, 29 July, have hurt the altcoin market.
There is a chance that the recent losses do not represent the entire picture though. The volume indicator offered some hope that the recovery would be quick. Even so, at the time of writing, sentiment did not favor the bulls in the short term.
More volatility, but WIF recovery is still possible
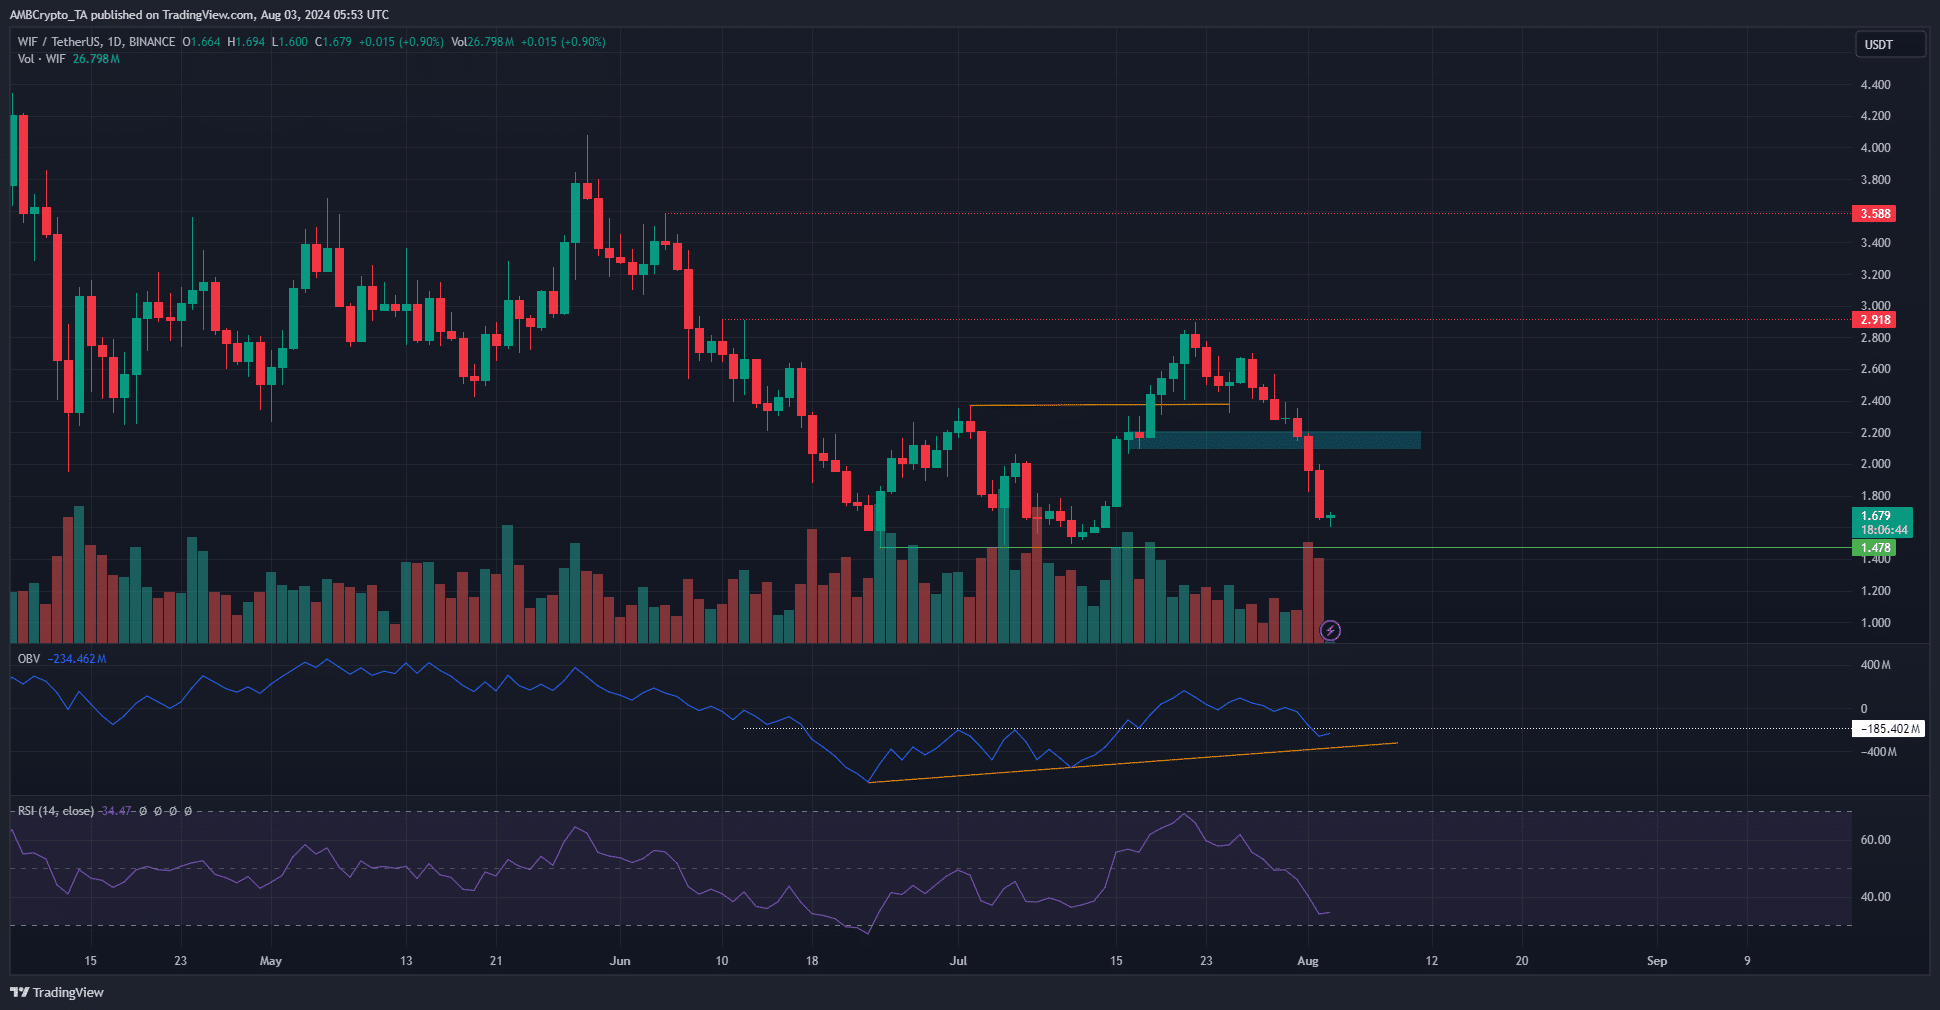
The plunge below the $2.32 and $2.15 levels reinforced the bearish momentum of WIF. The daily RSI fell below neutral 50 when the $2.32 level was lost, marking a momentum shift. The reading of 34 on the RSI signaled that bears were still dominant.
It seemed likely that the lows from June and July at $1.47 would be tested as support once again. Once the lows are reached, a recovery might be quick.
This, because the OBV has been trending higher over the past six weeks. At press time, it was just below the early July highs. And yet, the steady buying volume when prices climbed past $2 have not been overshadowed by the selling volume of the past ten days.
WIF bulls can hold on to this slight encouragement to gain belief in the coming days, which would likely see losses.
Liquidation heatmap supported price move below $1.5
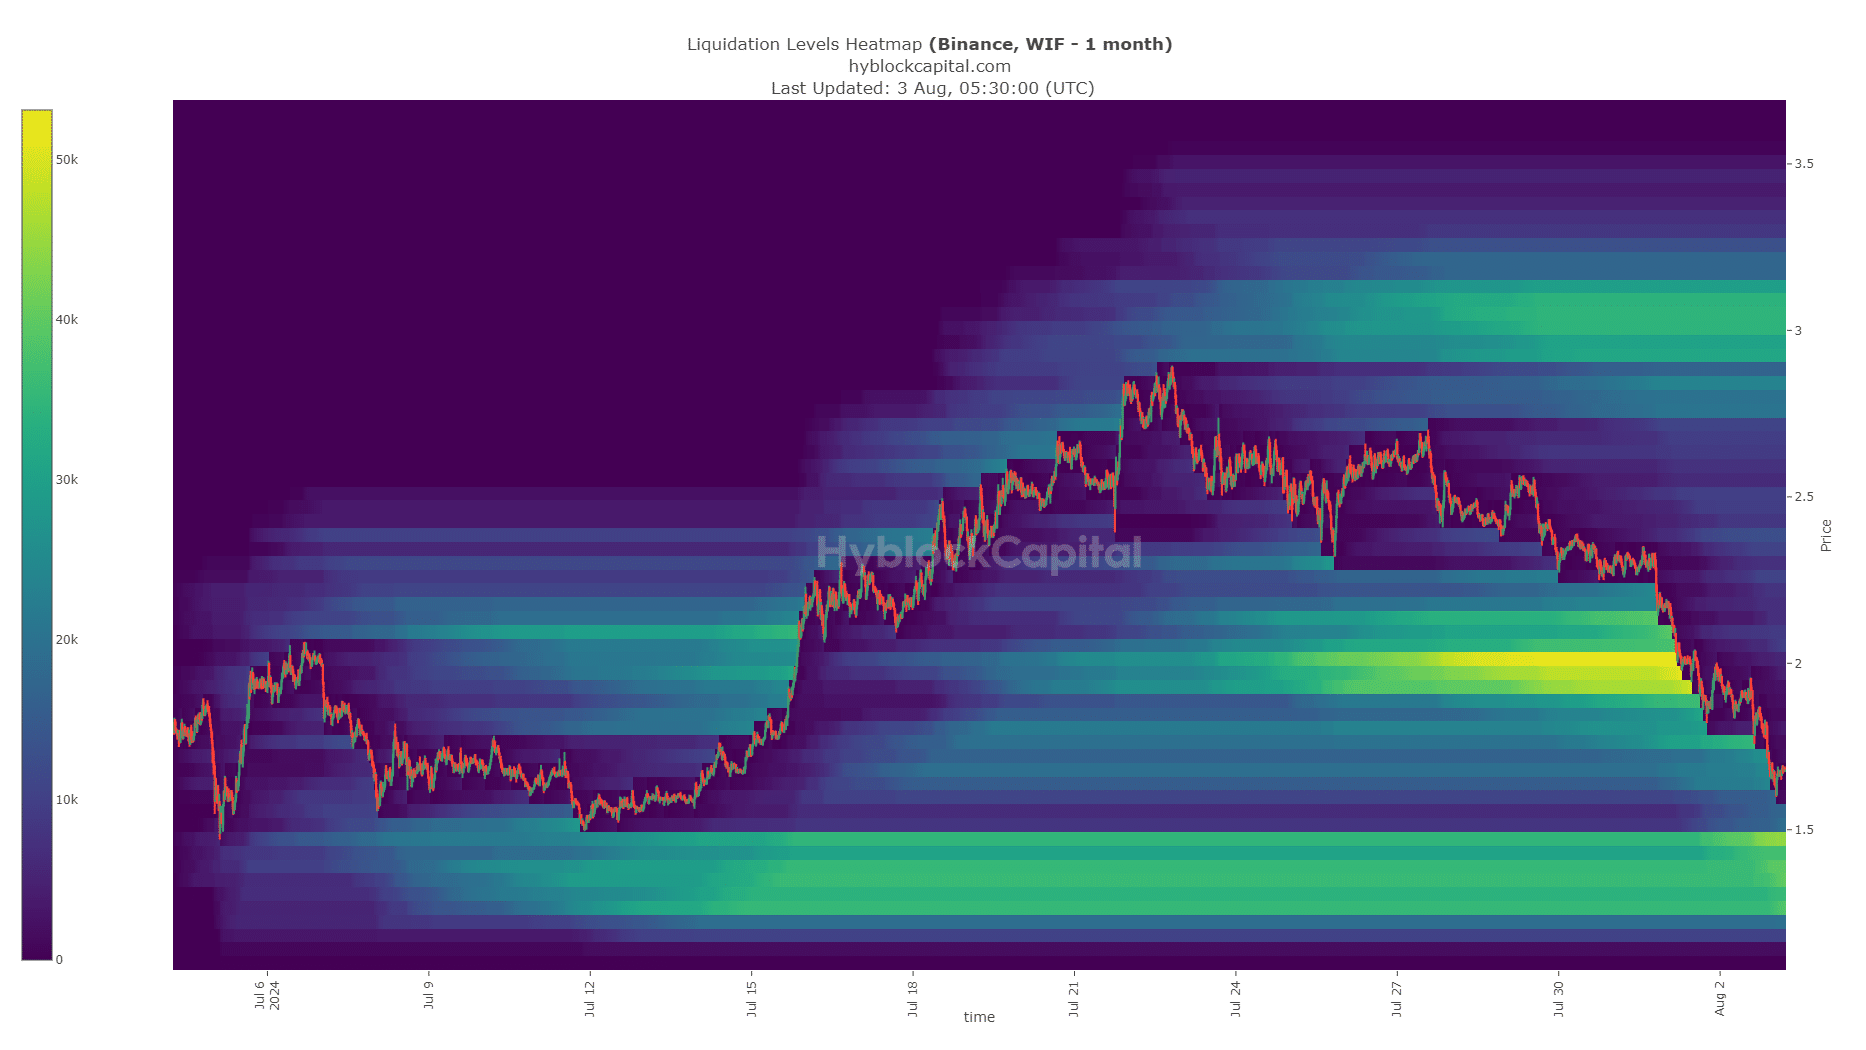
The large cluster of liquidation levels at $2 failed to keep the bears at bay. The persistent negative mood across the market saw WIF drop towards the next liquidity pool at $1.4-$1.5.
Realistic or not, here’s WIF’s market cap in BTC’s terms
This zone has confluence with the support level highlighted previously. It is possible that a bullish reversal would commence from this zone, provided Bitcoin manages to hold on to the $60k demand zone.
Disclaimer: The information presented does not constitute financial, investment, trading, or other types of advice and is solely the writer’s opinion.


