WIF’s liquidity pools mark $2.25 as key level for traders – All the details
The 3-month liquidation heatmap highlighted the $2.25 zone as a strong magnetic zone and the next price target.

- WIF to target the local highs set earlier this month
- A short-term dip to $1.7 could offer a buying opportunity
At press time, dogwifhat [WIF] remained in a downtrend on the daily chart. Despite the sustained losses for the memecoin, there seemed to be some potential for recovery though. In fact, technical analysis pointed to a bullish momentum divergence. Also, while the liquidation heatmaps outlined a price target above $2 for WIF, the buying pressure was lacking.
Can the bulls drive a recovery, or will it result in a failure to surpass its local highs?
WIF beginning to recover, or preparing for further losses?
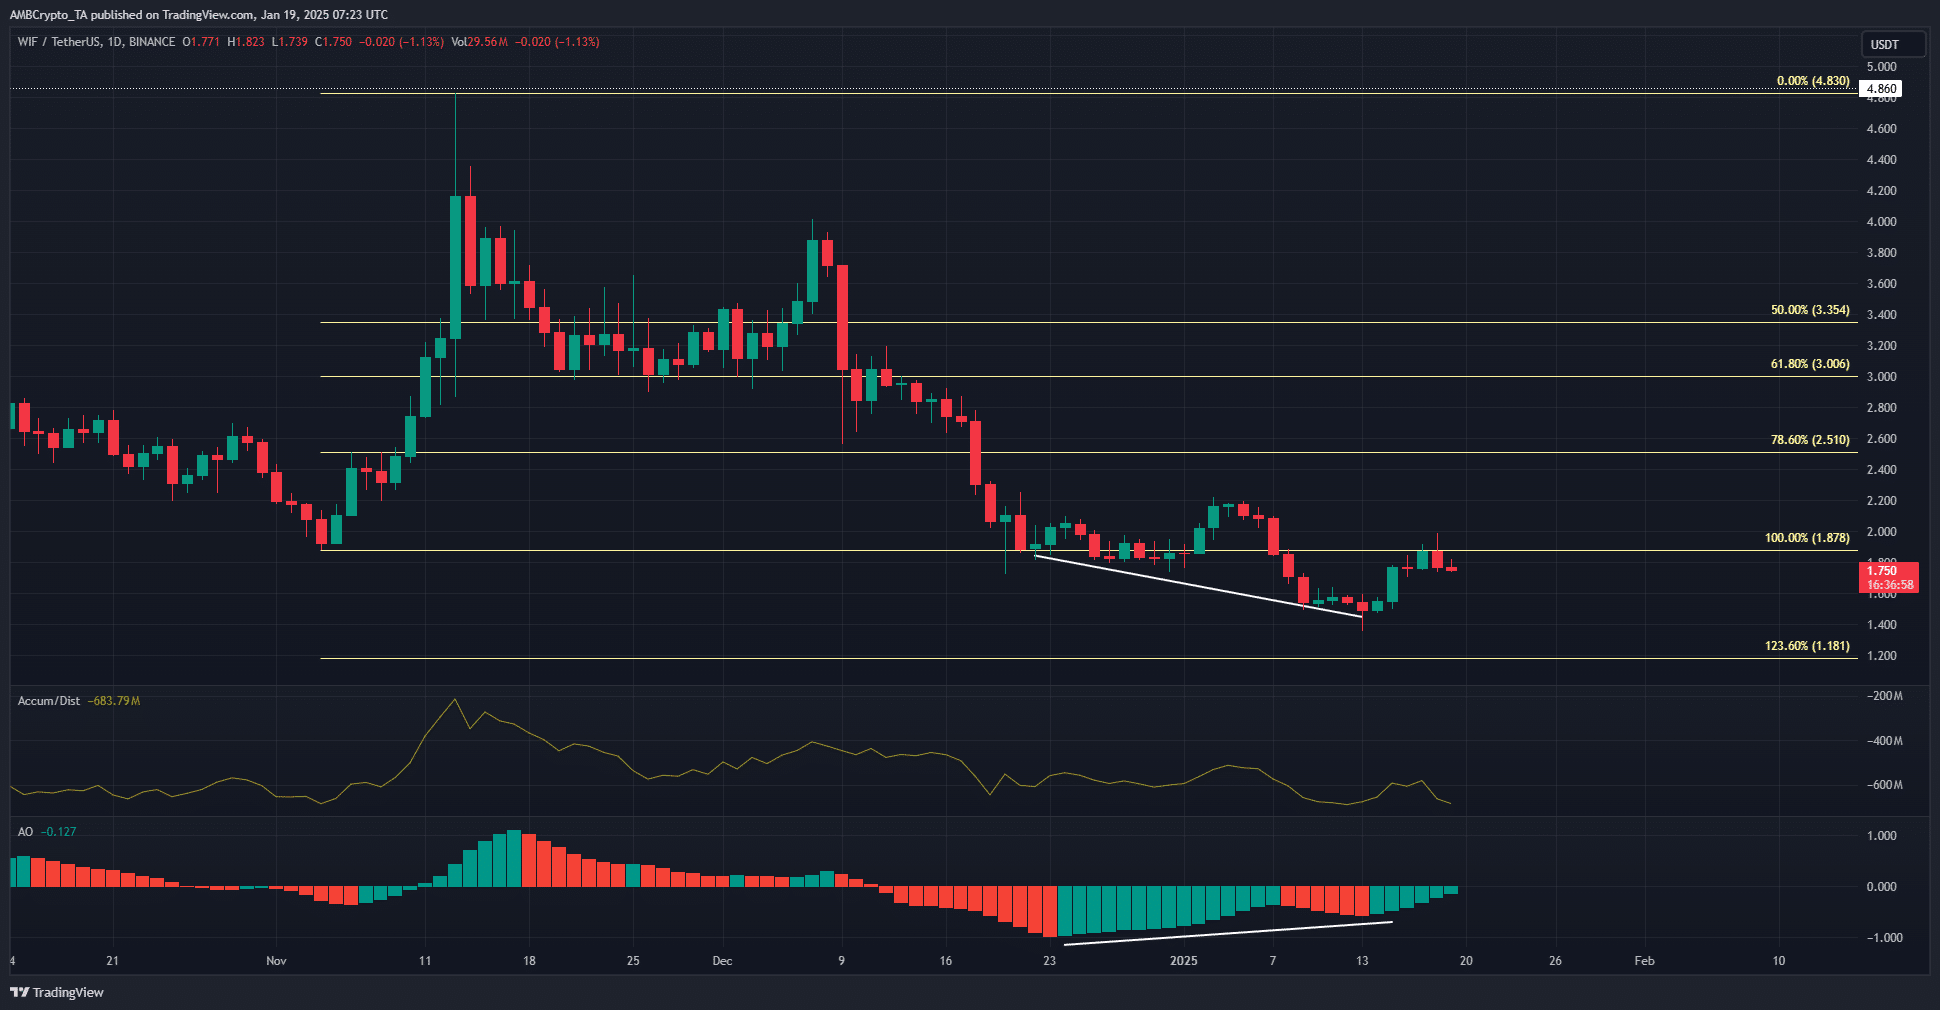
The latest lower high for WIF on the daily chart was set at $2.22 earlier this month. Since then, it has made a lower low and bounced to retest the $1.878 resistance level, maintaining its bearish trend.
The A/D indicator was also in decline, showing selling pressure was dominant. The Awesome Oscillator remained below the neutral line to indicate bearish momentum was prevalent. And yet, the AO formed a bullish divergence with the price.
This suggested that dogwifhat might be nearing the end of its downtrend since November. However, unless capital inflows pick up, traders must remain cautious.
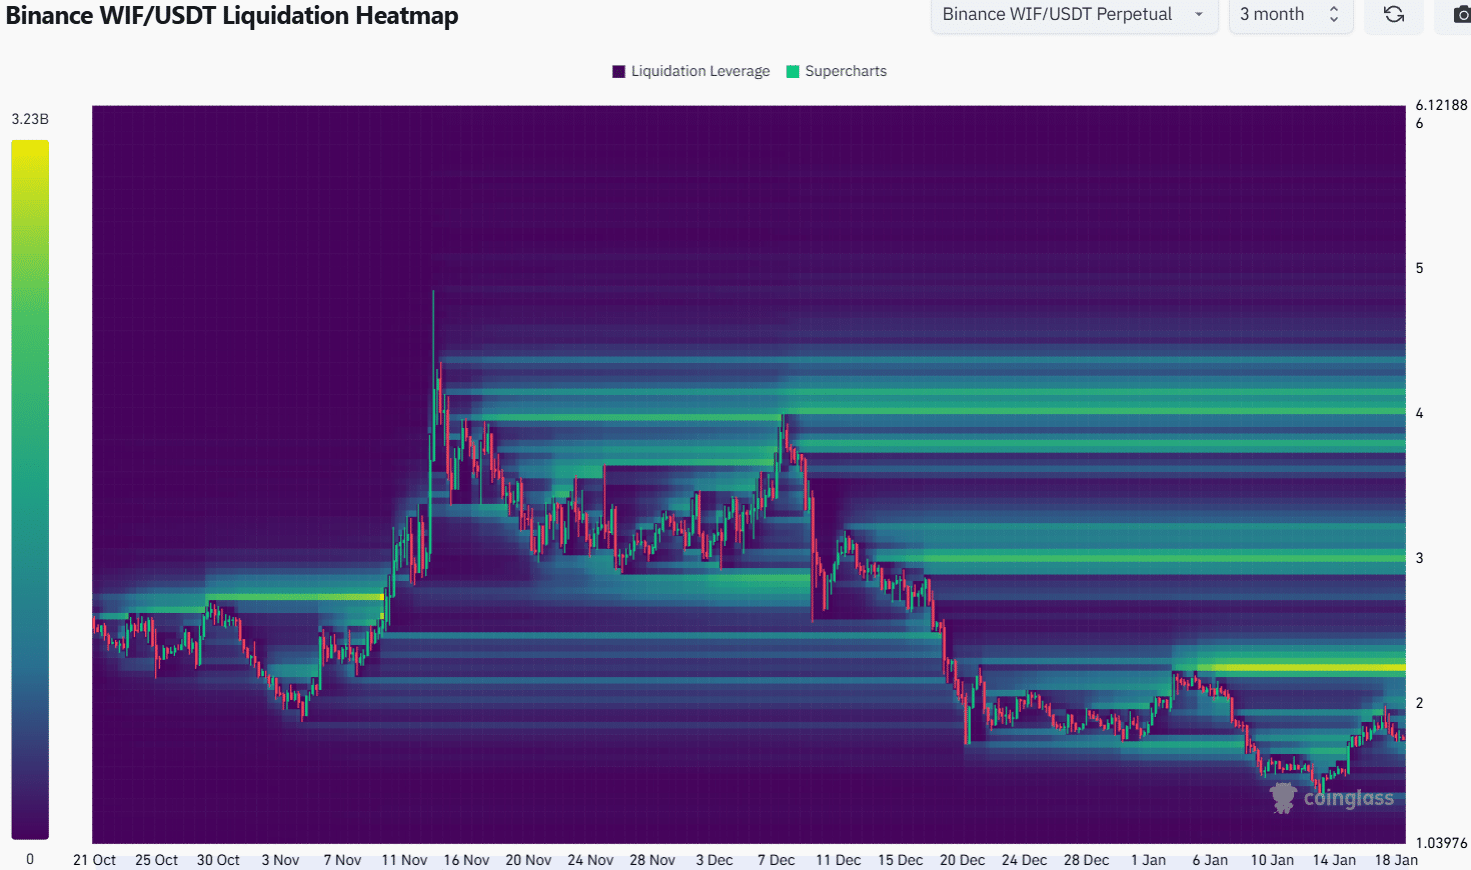
The 3-month liquidation heatmap highlighted the $2.25 zone as a strong magnetic zone. The local highs from earlier in January have collected a sizeable number of liquidation levels, making it a target since price is attracted to liquidity.
Beyond $2.3, the $3 zone would be the next medium-term target.
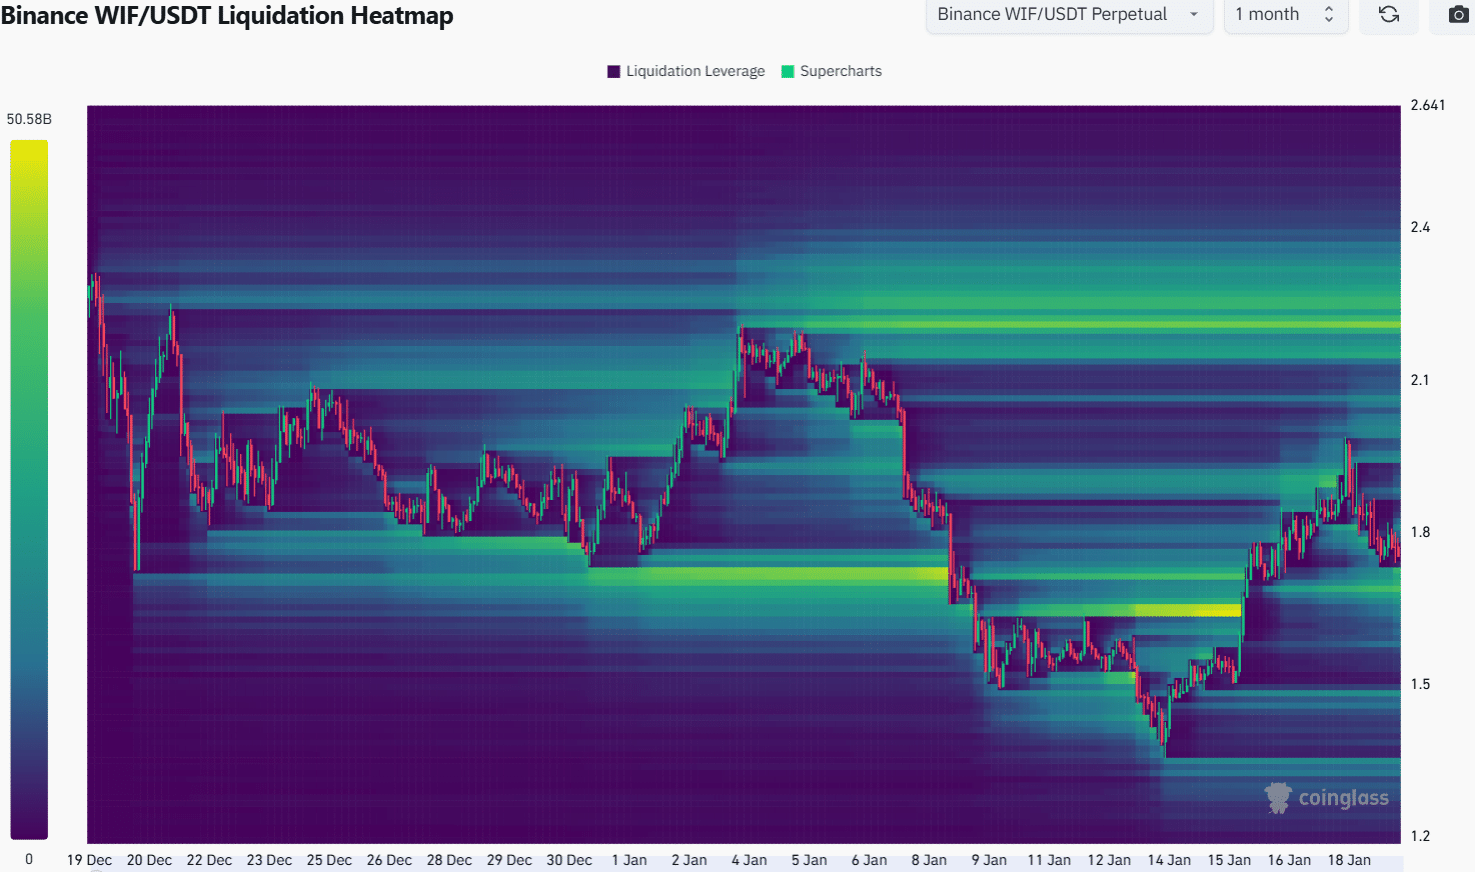
The past month’s liquidation data also noted the importance of the $2.25 zone as a liquidity pool. To the south, the $1.7-level could be of interest to traders.
Realistic or not, here’s WIF’s market cap in BTC’s terms
It is possible that WIF sees a price dip to $1.7, before moving higher towards $2.25. A breakout beyond $2.25 did not appear likely as things stand due to the lack of buying pressure. This could change over the coming weeks.
Disclaimer: The information presented does not constitute financial, investment, trading, or other types of advice and is solely the writer’s opinion