Will $0.609 be FTM’s last stand? Key metrics suggest that may be so!

- FTM’s MVRV ratio at -4.64% suggested investors may be hesitant to sell at a loss
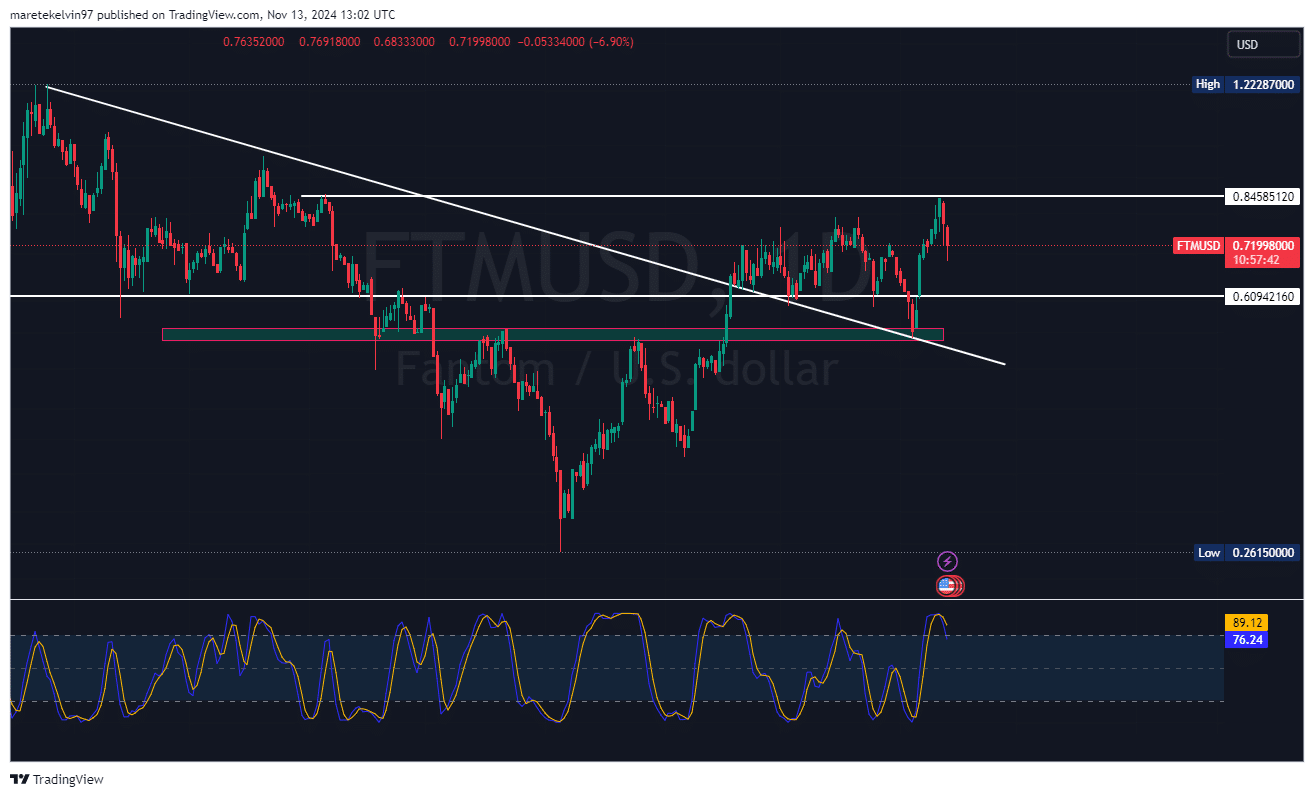
- Next critical support level at $0.609 after a 14% decline to decide the market direction
Fantom’s (FTM) price action lately can be best described as volatile, with the altcoin moving up and down the charts despite the broader market’s consistent uptrend. What next though? Well, investors and analysts are currently keenly observing the next key support level as various on-chain metrics offered insights into its potential reversal trajectory.
Will the $0.609-level hold the line?
On the daily charts, FTM registered a sharp 14% decline in price over the last 2 days. This decline captured the attention of both short-term traders and long-term investors. Besides, this decline has placed the spotlight on whether FTM can hold its ground at the next major support level at $0.609.
If this support wall falls, further downside movements may follow.
Elon Musk’s influence
The next critical support at $0.609 is in line with FTM’s historical price behavior and areas where buying pressure has shown up in the past. This key sentiment comes at a time when the market is also reacting to the buzz generated by influential figures’ appointments in the crypto space.
For example – Elon Musk’s recent endorsement for a government efficiency department appointment by Trump.
FTM’s key metrics back a potential reversal
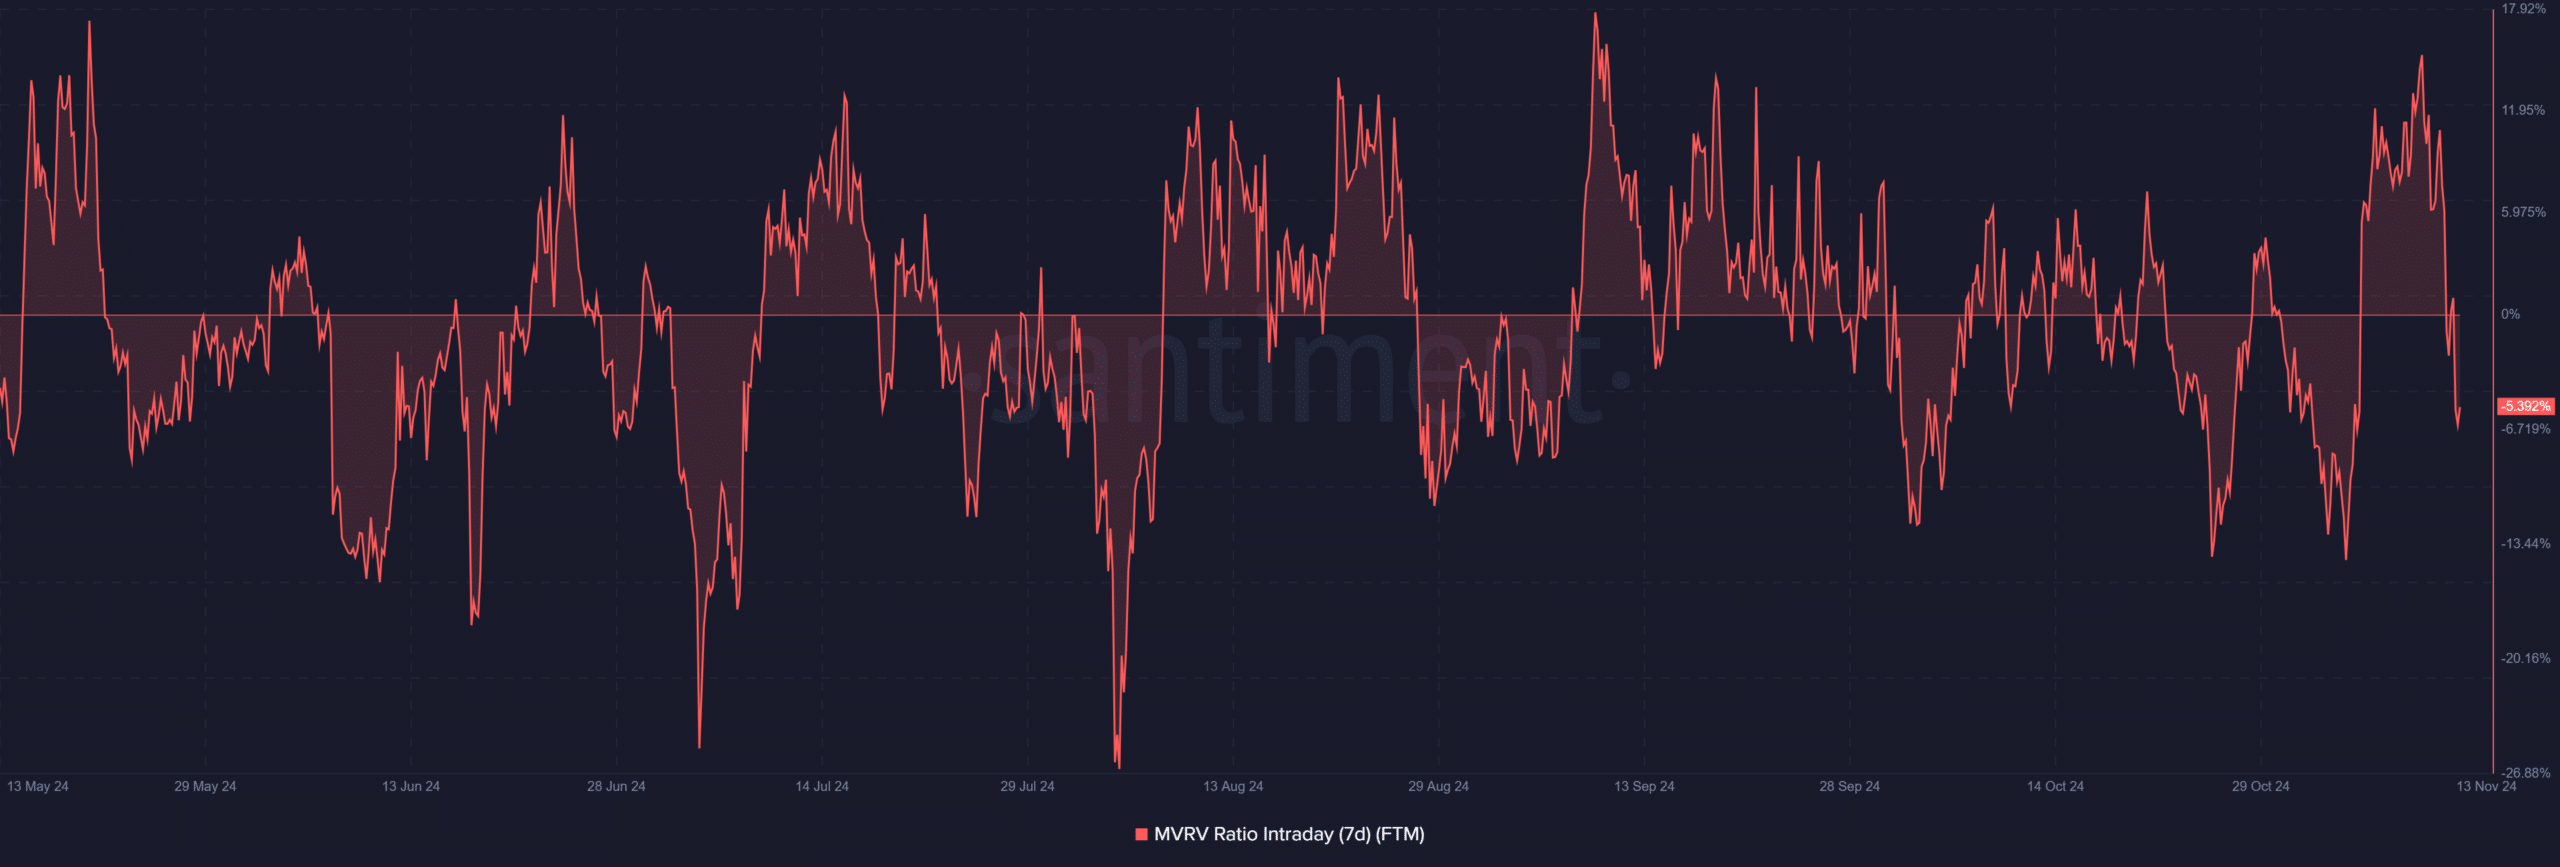
The altcoin’s current price action is not without context though. In fact, on-chain metrics’ assessment has been pivotal to our analysis. At the time of writing, for instance, Santiment’s MVRV ratio stood at -4.64%, suggesting that its market price is below its average realized value.
Historically, a negative MVRV ratio means that a bottom might be in the making since holders tend to wait out periods of underperformance rather than sell at a loss.
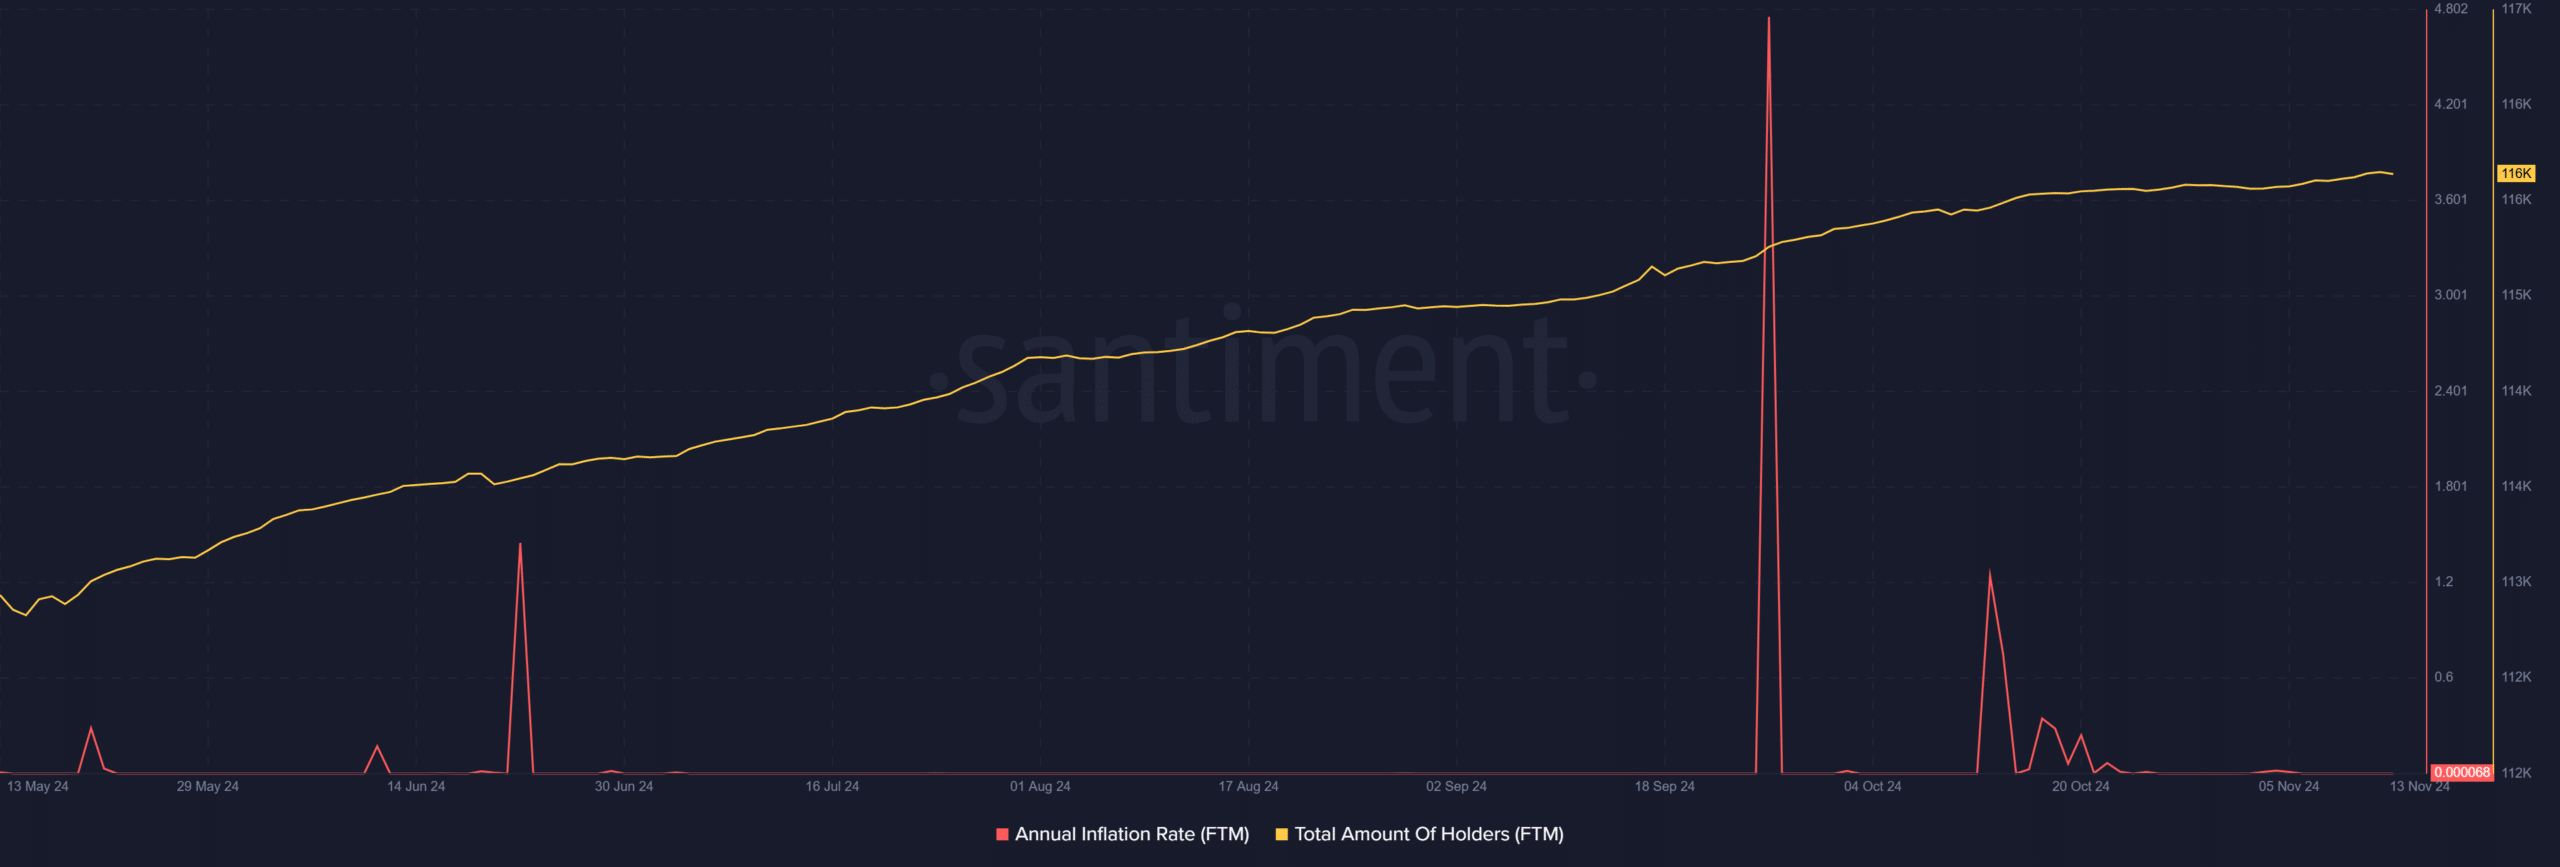
Also, the holder data from Santiment seemed to mirror an increasing number of FTM holders, despite its recent price drop. The trend implied that investor confidence is still intact and large investors believe in the token’s long-term potential.
More holders may provide a stable base, supporting the price during these periods of volatility.
AMBCrypto further analysed the long/short ratio data to assess the short-term market direction. The long/short ratio indicated a slight decline, with the short position takers controlling 52.87% of the market – A sign of cautious optimism among traders.
This slight difference in the proportion of longs, relative to shorts, could mean that traders are expecting a reversal or stabilization at the $0.609 level.
What next for FTM?
FTM’s recent 14% decline set the stage for a critical test at the $0.609 level. Its press time MVRV ratio, growing number of holders, and long/short ratio all signaled a potential reversal at its key support level.


