
Last week, 1inch outperformed several cryptos with its higher market capitalization, gaining by over 4% in 7 days. The altcoin’s price movement was not unexpected, however, as several developments in its ecosystem accelerated its incline. In fact, according to Messari, 1inch accounted for more than 60% of Synthetix’s trade volume prior to full integration. Kwenta nabbed the second spot, accounting for 34% of transfer volume.
For more, explore @dunleavy89's report on @Synthetix_io: Re-evaluating an OG DeFi Protocol.https://t.co/4wE2drSae6
— Messari (@MessariCrypto) September 2, 2022
This development also corresponded with 1inch’s price, as its 7-day chart was painted mostly green. At the time of writing, 1inch was trading at $0.6894 with a market capitalization of $400,641,696.
What do metrics have to say?
Recently, 1inch was named the coin of the day in terms of social activity, with its 24-hour social engagement hitting 13.3 million on the charts. Additionally, LunarCrush has 1inch listed in its current top 10 coins on its AltRank list. All these developments, when merged together, add immense value to 1inch’s Network. These may have contributed to an appreciation in the crypto’s price.
The current top 10 coins by LunarCrush AltRank™:
1️⃣ $sys
2️⃣ $cel
3️⃣ #1inch
4️⃣ $uft
5️⃣ $matic
6️⃣ $chz
7️⃣ $hdrn
8️⃣ $atom
9️⃣ $tsuka
? $culthttps://t.co/y2zLZONvot pic.twitter.com/YbNlaceT04— LunarCrush (@LunarCrush) September 2, 2022
Several on-chain metrics of 1inch have also registered positive signs lately. For instance, 1inch’s MVRV Ratio noted an uptrend after hitting a bottom in late August, suggesting a further spike in price over the coming days. Moreover, the recent price hike was also backed by high volume, increasing the legitimacy of the surge.
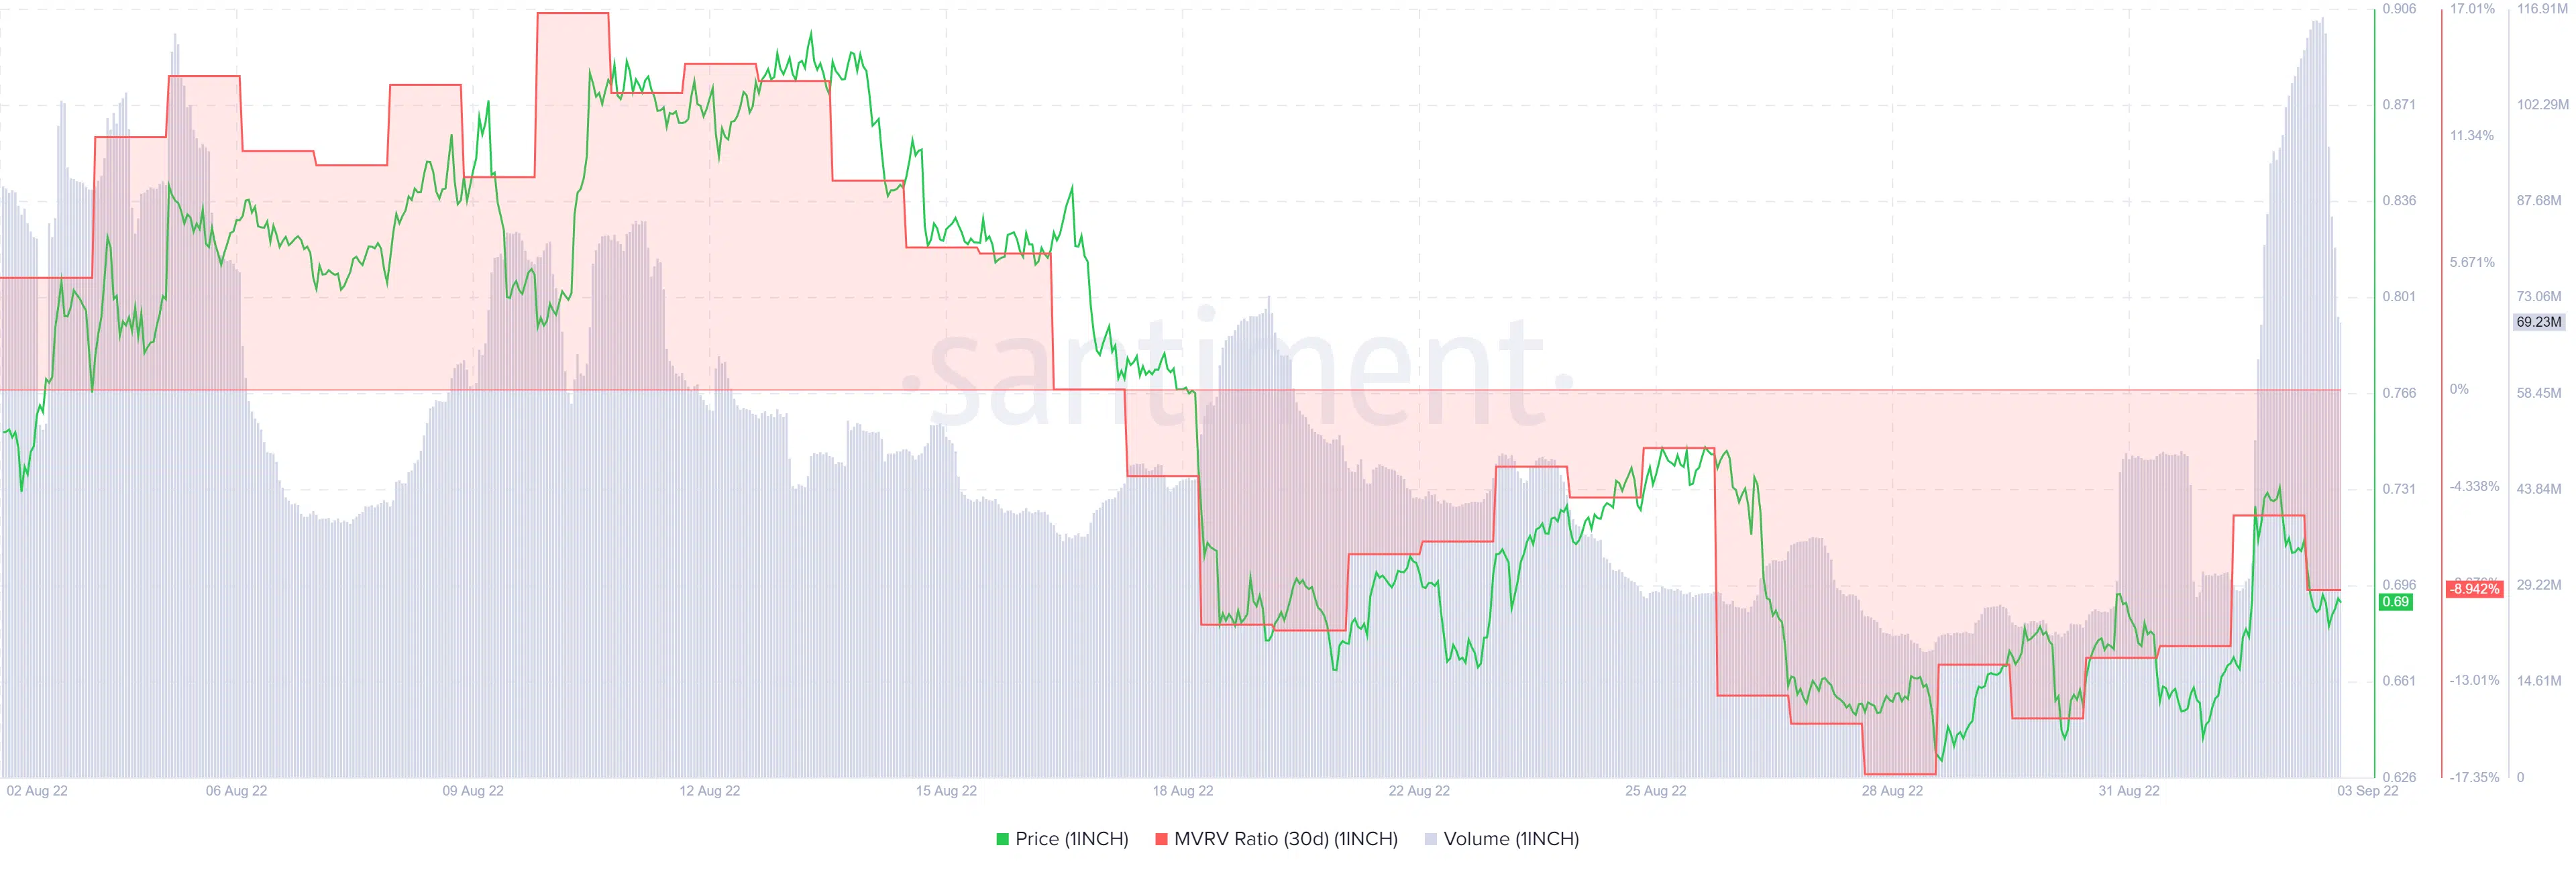
Source: Santiment
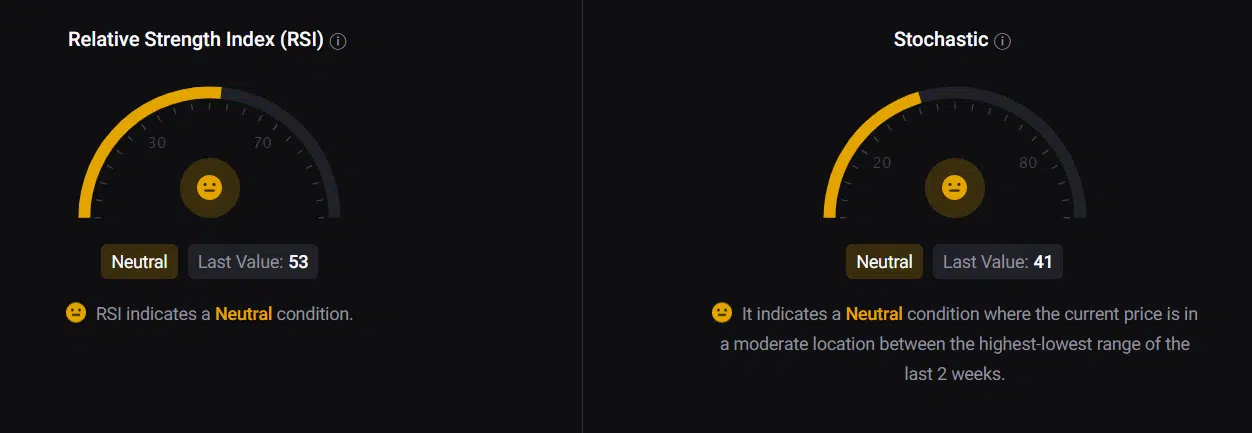
According to CryptoQuant’s data, 1inch’s exchange reserve also fell, which is a positive sign as it indicates lower selling pressure. The RSI suggested that the market was somewhat in a neutral position, so it could go in any direction.
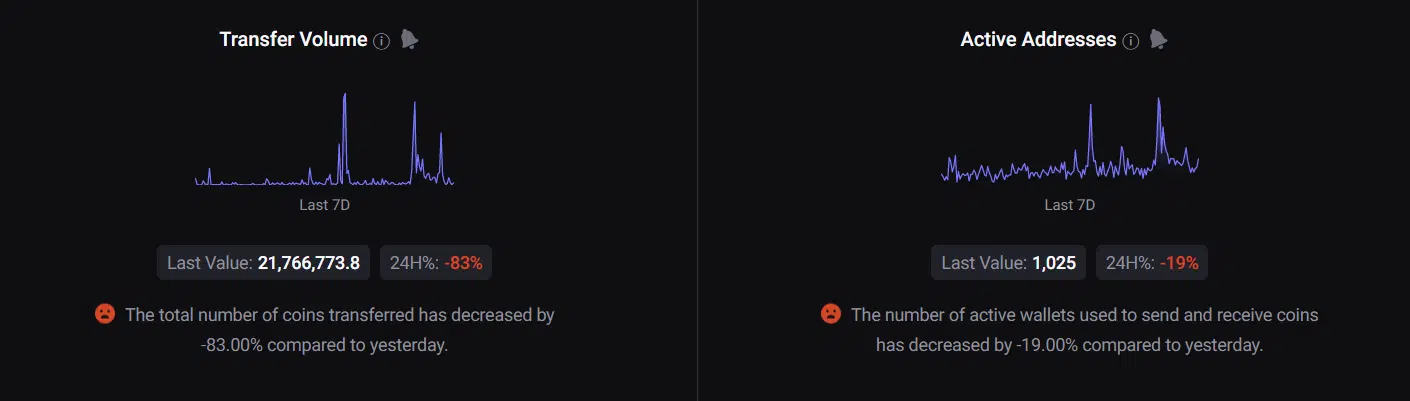
However, like the RSI, several other metrics were also not in favor of 1inch’s price surge. The total transfer volume and active addresses went down by 83% and 19%, respectively – A bearish signal.
On top of that, 1inch’s total exchange netflows were also high compared to the 7-day average – A sign of higher selling pressure. Therefore, a possibility arises of bears gaining an advantage in the market, which might restrict 1inch from moving north in the short-term.
Looking forward
1inch’s 4-hour chart also painted an ambiguous picture as the market indicators underlined both possibilities. On one hand, the 20-day EMA was slightly above the 50-day EMA – A bull sign. On the other hand, the MACD highlighted the possibility of a bearish crossover soon, decreasing the chances of a northward breakout in the coming days.
Though the developments in the 1inch ecosystem look promising, most of the on-chain metrics and market indicators suggest that a short-term bull rally is pretty unlikely.
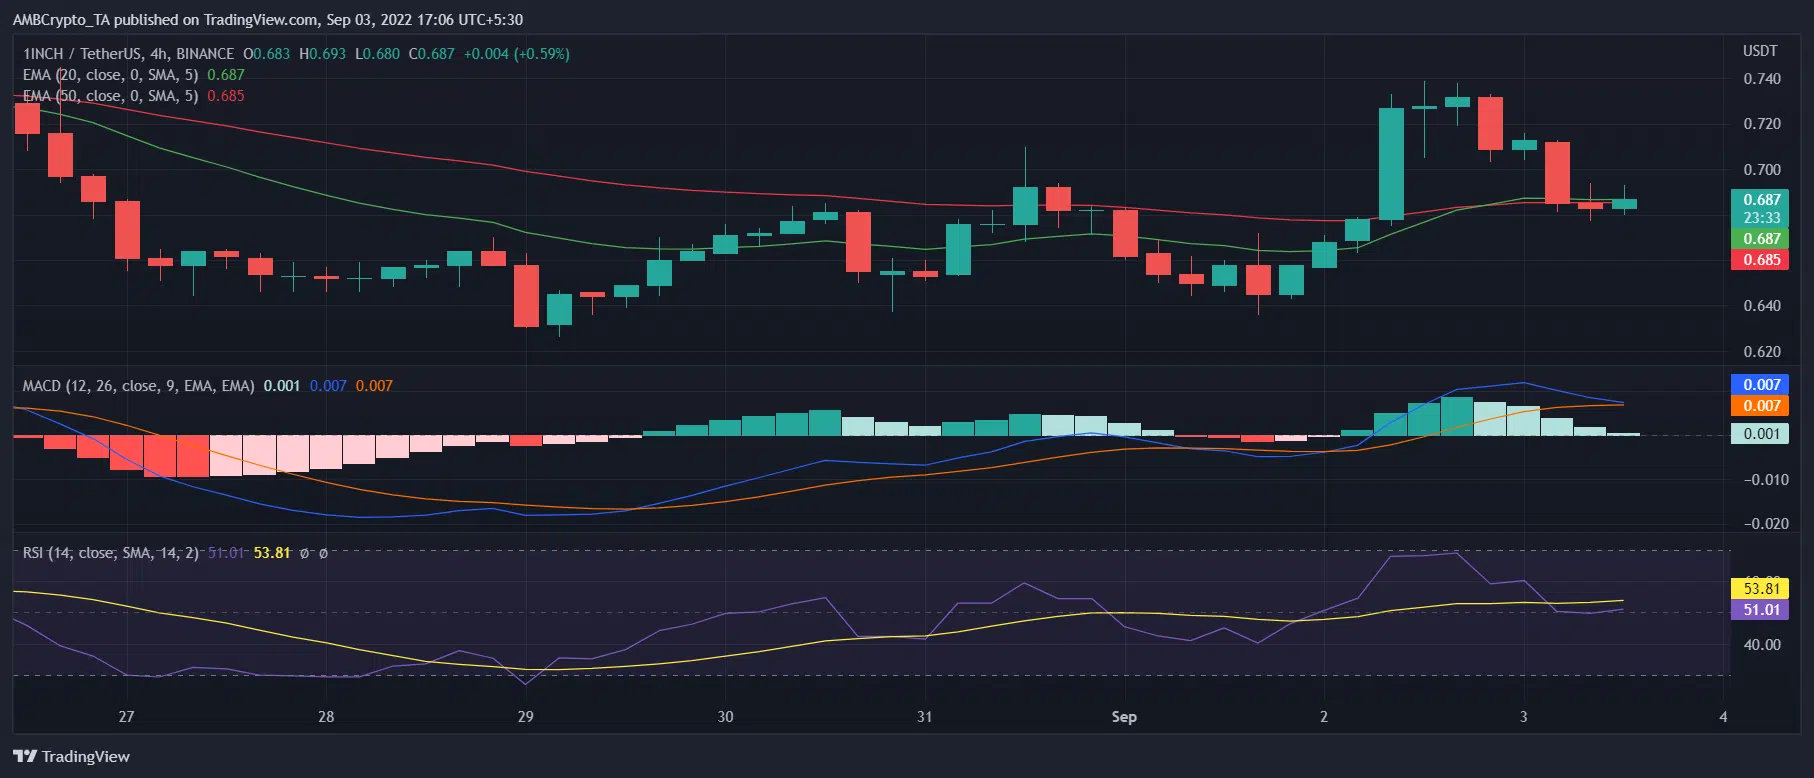
Source: TradingView