Is this a roadblock to Polkadot’s recovery in the months ahead

Disclaimer: The findings of the following analysis are the sole opinions of the writer and should not be considered investment advice
On lower timeframes, there was some indication on the charts in the past couple of weeks that Polkadot saw some compression in its price action. This could continue for a few days to come, before volatility to either direction for DOT. However, on longer timeframes, an accumulation phase could be in play for Polkadot. The indicators did not show strong buying pressure yet, and the bearish market structure remained bearish.
DOT- 1D
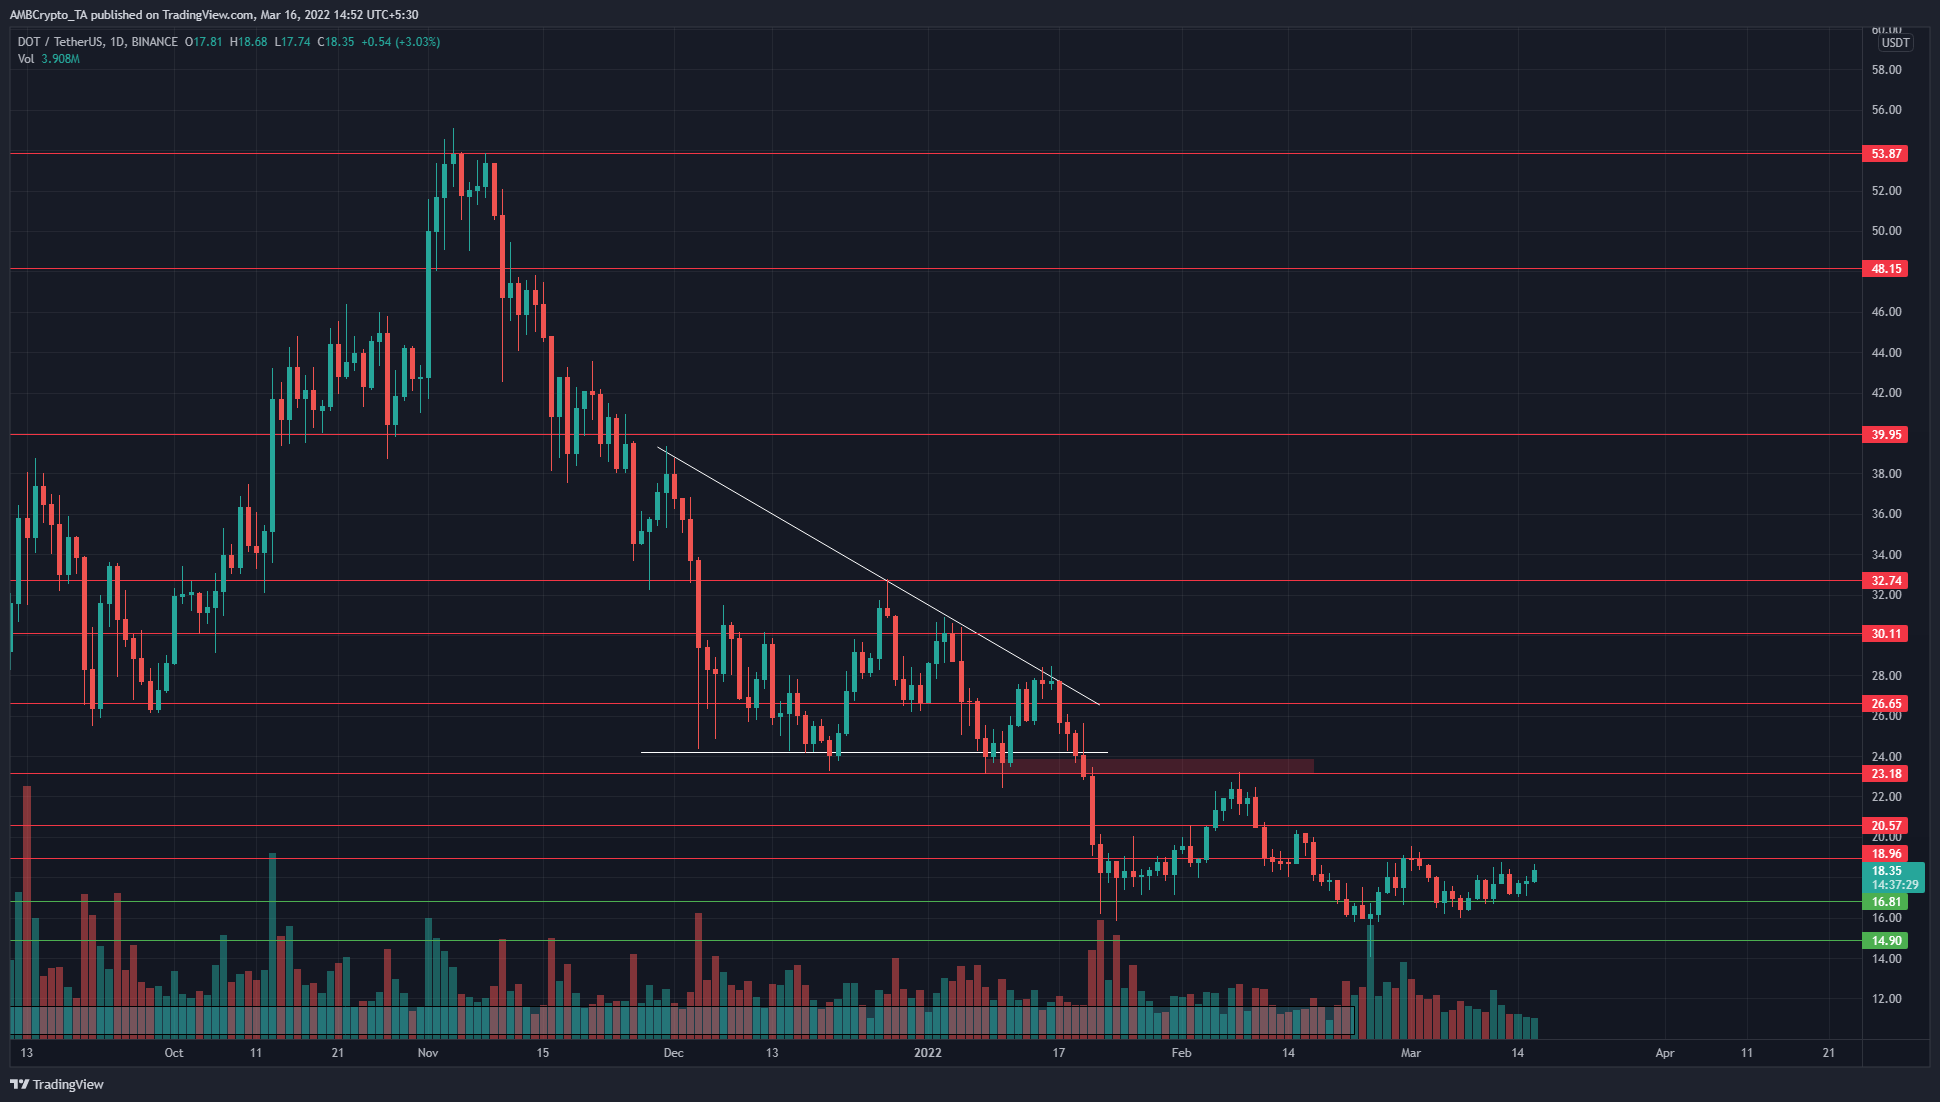
Polkadot has seen huge losses since November when it was trading at $54 near the ATHs. In the past three months, the $16.81 level has served as support. In the past month, the $15.88 mark saw a daily session close. However, the price has registered higher lows in recent weeks.
Was it enough to stall the downtrend? Can DOT push higher from here on? It was not clear yet. $19.61 and $20.34 are levels that DOT would need to climb above from here on, to give an idea of a bullish leaning for Polkadot.
Long-term, the downtrend has not yet been broken, but it could be in the days to come. Even past $20.34, the $23.1 area would still be likely to offer strong resistance.
Rationale
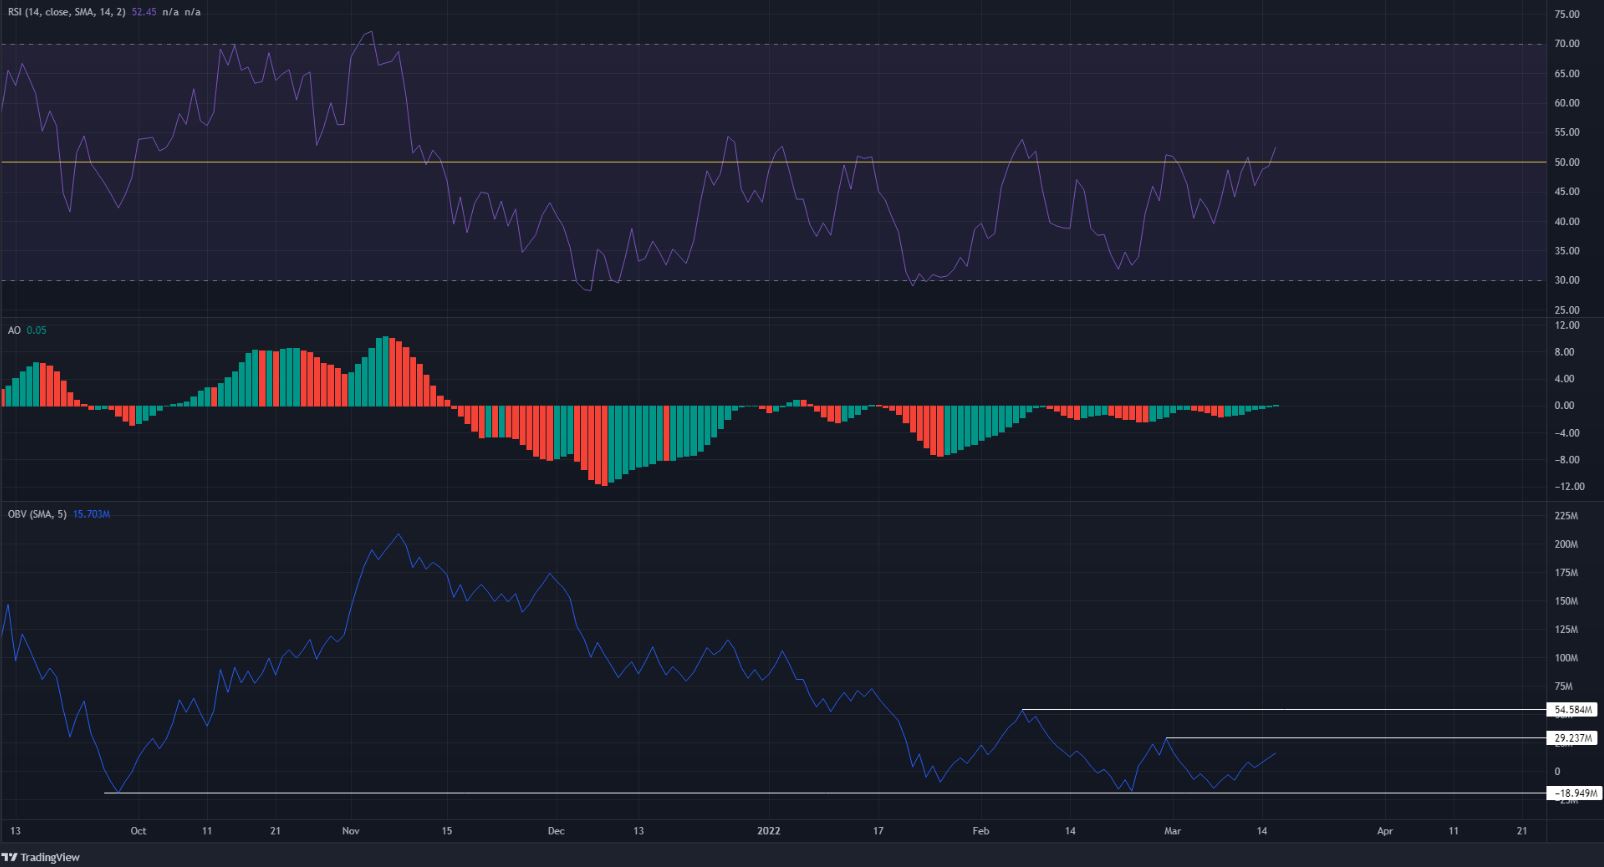
The RSI poked its head above the neutral 50 mark. This could be an early indication that the long-term trend could be on the verge of shifting. The Awesome Oscillator also crossed above the zero line, which could again be seen as a signal of a shift in bias.
There remains a long way to go, though. The OBV has been sliding downward since November, but in the past two weeks, it offered the possibility that buyers were slowly entering the market. They weren’t the dominant side yet though.
Conclusion
The price action and indicators showed a faint possibility of a shift in longer-term bias from bearish to bullish. It was quite early to tell, and $20.34 and $23.1 remain levels to beat. The overall market conditions still reeked of fear and uncertainty. Hence, risk-averse investors could wait for buying opportunities. Flipping $23.1 to support would be an encouraging sign for bulls, and a buying opportunity in preparation for a run upwards.